此工具用来获取程序所有内存分配、释放情况的 PinTool。
首先看pin提供的一些pintoos,在文件/Desktop/pin-gcc-linux/source/tools/ManualExamples$ 中
malloctrace.cpp文件
这个 PinTool 可以实现函数粒度的插桩并实现对 malloc(内存分配) 与 free(释放) 的简单分析:记录 malloc 的参数及返回值,记录 free 的参数。
/*
 * Copyright 2002-2019 Intel Corporation.
 *
 * This software is provided to you as Sample Source Code as defined in the accompanying
 * End User License Agreement for the Intel(R) Software Development Products ("Agreement")
 * section 1.L.
 *
 * This software and the related documents are provided as is, with no express or implied
 * warranties, other than those that are expressly stated in the License.
 */


#include "pin.H"
#include <iostream>
#include <fstream>
using std::hex;
using std::cerr;
using std::string;
using std::ios;
using std::endl;

/* ===================================================================== */
/* Names of malloc and free */
/* ===================================================================== */
#if defined(TARGET_MAC)
#define MALLOC "_malloc"
#define FREE "_free"
#else
#define MALLOC "malloc"
#define FREE "free"
#endif

/* ===================================================================== */
/* Global Variables */
/* ===================================================================== */

std::ofstream TraceFile;

/* ===================================================================== */
/* Commandline Switches */
/* ===================================================================== */

KNOB<string> KnobOutputFile(KNOB_MODE_WRITEONCE, "pintool",
    "o", "malloctrace.out", "specify trace file name");

/* ===================================================================== */


/* ===================================================================== */
/* Analysis routines                                                     */
/* ===================================================================== */

VOID Arg1Before(CHAR * name, ADDRINT size)
{


    TraceFile << name << "(" << size << ")" << endl;
}

VOID MallocAfter(ADDRINT ret)
{


    TraceFile << "  returns " << ret << endl;
}


/* ===================================================================== */
/* Instrumentation routines                                              */
/* ===================================================================== */

VOID Image(IMG img, VOID *v)
{


    // Instrument the malloc() and free() functions.  Print the input argument
    // of each malloc() or free(), and the return value of malloc().
    //
    //  Find the malloc() function.
    RTN mallocRtn = RTN_FindByName(img, MALLOC);
    if (RTN_Valid(mallocRtn))
    {


        RTN_Open(mallocRtn);

        // Instrument malloc() to print the input argument value and the return value.
        RTN_InsertCall(mallocRtn, IPOINT_BEFORE, (AFUNPTR)Arg1Before,
                       IARG_ADDRINT, MALLOC,
                       IARG_FUNCARG_ENTRYPOINT_VALUE, 0,
                       IARG_END);
        RTN_InsertCall(mallocRtn, IPOINT_AFTER, (AFUNPTR)MallocAfter,
                       IARG_FUNCRET_EXITPOINT_VALUE, IARG_END);

        RTN_Close(mallocRtn);
    }

    // Find the free() function.
    RTN freeRtn = RTN_FindByName(img, FREE);
    if (RTN_Valid(freeRtn))
    {


        RTN_Open(freeRtn);
        // Instrument free() to print the input argument value.
        RTN_InsertCall(freeRtn, IPOINT_BEFORE, (AFUNPTR)Arg1Before,
                       IARG_ADDRINT, FREE,
                       IARG_FUNCARG_ENTRYPOINT_VALUE, 0,
                       IARG_END);
        RTN_Close(freeRtn);
    }
}

/* ===================================================================== */

VOID Fini(INT32 code, VOID *v)
{


    TraceFile.close();
}

/* ===================================================================== */
/* Print Help Message                                                    */
/* ===================================================================== */

INT32 Usage()
{


    cerr << "This tool produces a trace of calls to malloc." << endl;
    cerr << endl << KNOB_BASE::StringKnobSummary() << endl;
    return -1;
}

/* ===================================================================== */
/* Main                                                                  */
/* ===================================================================== */

int main(int argc, char *argv[])
{


    // Initialize pin & symbol manager
    PIN_InitSymbols();
    if( PIN_Init(argc,argv) )
    {


        return Usage();
    }

    // Write to a file since cout and cerr maybe closed by the application
    TraceFile.open(KnobOutputFile.Value().c_str());
    TraceFile << hex;
    TraceFile.setf(ios::showbase);

    // Register Image to be called to instrument functions.
    IMG_AddInstrumentFunction(Image, 0);
    PIN_AddFiniFunction(Fini, 0);

    // Never returns
    PIN_StartProgram();

    return 0;
}

/* ===================================================================== */
/* eof */
/* ===================================================================== */
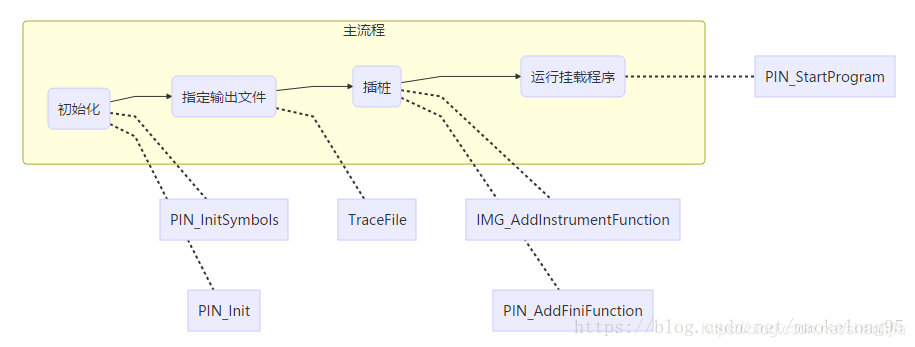
这个PinTool的生命周期
>引用https://blog.csdn.net/maokelong95/article/details/78974271
代码解读
从main函数开始
PIN_InitSymbols();//符号表管理器
if( PIN_Init(argc,argv) )//pintool的初始化
{
return Usage();
}
如果没有初始化符号表管理器,PinTool 将无法识别挂载程序中的符号,如函数名。
然后
//PinTool 打开由 KnobOutputFile 指定的追踪结果输出文件
TraceFile.open(KnobOutputFile.Value().c_str());
TraceFile << hex;
TraceFile.setf(ios::showbase);
//通过IMG_AddInstrumentFunction函数注册Image,向挂载程序中插入插桩函数
// Register Image to be called to instrument functions.
IMG_AddInstrumentFunction(Image, 0);
PIN_AddFiniFunction(Fini, 0);
// Never returns
PIN_StartProgram();
List item
```cpp
通过 RTN_InsertCall 向相应函数插入插桩函数
// Instrument malloc() to print the input argument value and the return value.
**RTN_InsertCall**(mallocRtn, IPOINT_BEFORE, (AFUNPTR)Arg1Before,
//在 malloc 函数执行前执行 Arg1Before 函数,并向Arg1Before 函数传递两个参数
IARG_ADDRINT, MALLOC,
IARG_FUNCARG_ENTRYPOINT_VALUE, 0,
// 第一个函数是 IARG_ADDRINT 型的常量,其值是宏 MALLOC;IARG_FUNCARG_ENTRYPOINT_VALUE 表示第二个参数是仅在函数入口处有效的函数本身参数,其中接下来的 0 表示第一个参数。
IARG_END);
**RTN_InsertCall**(mallocRtn, IPOINT_AFTER, (AFUNPTR)MallocAfter,
IARG_FUNCRET_EXITPOINT_VALUE, IARG_END);
RTN_Close(mallocRtn);
}
// Find the free() function.
RTN freeRtn = RTN_FindByName(img, FREE);
if (RTN_Valid(freeRtn))
{
RTN_Open(freeRtn);
// Instrument free() to print the input argument value.
RTN_InsertCall(freeRtn, IPOINT_BEFORE, (AFUNPTR)Arg1Before,
IARG_ADDRINT, FREE,
IARG_FUNCARG_ENTRYPOINT_VALUE, 0,
IARG_END);
RTN_Close(freeRtn);
}
}
PIN_AddFiniFunction() //
注册 Fini(),以在挂载程序结束后执行 Fini() 函数。
PIN_StartProgram();//运行挂载程序
2.编写一个简单的被测程序
如下
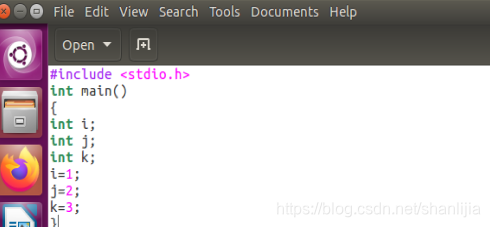
然后使用GCC进行编译
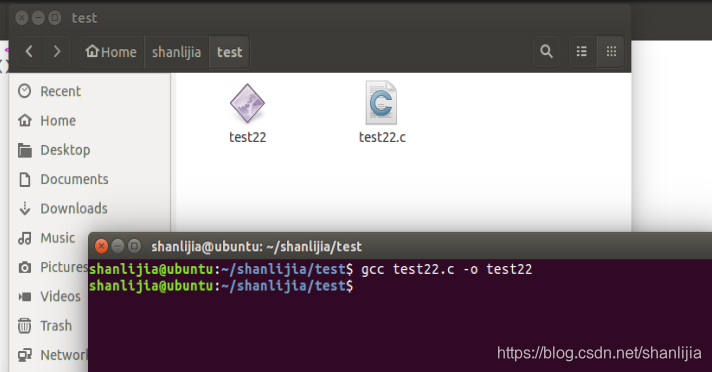
输入gcc -o test.c,生成可执行的名为test的文件,这个才是pin检测的程序。
使用pin 分析程序,pin工具是malloctrace.so

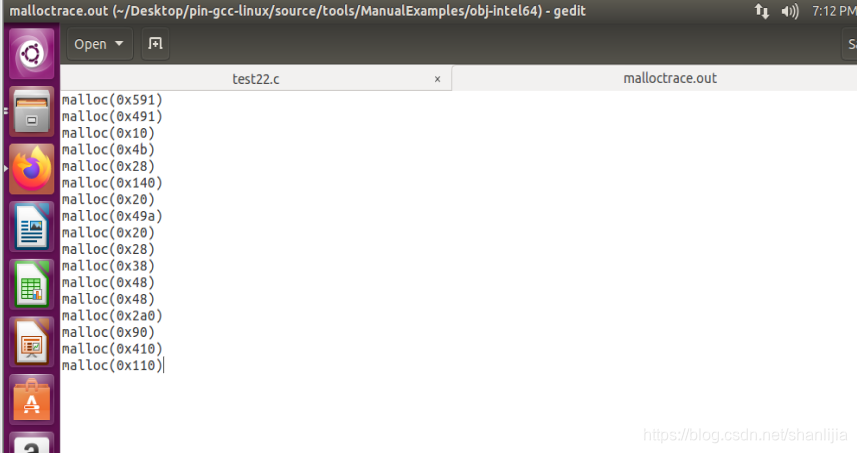
在目录下会有插桩输出数据文件产生,这就是我们得到的程序分析数据,在此基础上我们可以做其他的处理工作了:
运行完毕后,将在挂载程序所在目录下生成 malloctrace.out,打开即为 PinTools 输出的插桩所得信息。
案例二: 进入到source/tools/ManualExamples中
我们使用itrace.cpp这个pintool
/*
 * Copyright 2002-2019 Intel Corporation.
 *
 * This software is provided to you as Sample Source Code as defined in the accompanying
 * End User License Agreement for the Intel(R) Software Development Products ("Agreement")
 * section 1.L.
 *
 * This software and the related documents are provided as is, with no express or implied
 * warranties, other than those that are expressly stated in the License.
 */

#include <stdio.h>
#include "pin.H"

FILE * trace;

// This function is called before every instruction is executed
// and prints the IP
VOID printip(VOID *ip) {

     fprintf(trace, "%p\n", ip); }

// Pin calls this function every time a new instruction is encountered
VOID Instruction(INS ins, VOID *v)
{


    // Insert a call to printip before every instruction, and pass it the IP
    INS_InsertCall(ins, IPOINT_BEFORE, (AFUNPTR)printip, IARG_INST_PTR, IARG_END);
}

// This function is called when the application exits
VOID Fini(INT32 code, VOID *v)
{


    fprintf(trace, "#eof\n");
    fclose(trace);
}

/* ===================================================================== */
/* Print Help Message                                                    */
/* ===================================================================== */

INT32 Usage()
{


    PIN_ERROR("This Pintool prints the IPs of every instruction executed\n"
              + KNOB_BASE::StringKnobSummary() + "\n");
    return -1;
}

/* ===================================================================== */
/* Main                                                                  */
/* ===================================================================== */

int main(int argc, char * argv[])
{


    trace = fopen("itrace.out", "w");

    // Initialize pin
    if (PIN_Init(argc, argv)) return Usage();

    // Register Instruction to be called to instrument instructions
    INS_AddInstrumentFunction(Instruction, 0);

    // Register Fini to be called when the application exits
    PIN_AddFiniFunction(Fini, 0);

    // Start the program, never returns
    PIN_StartProgram();

    return 0;
}
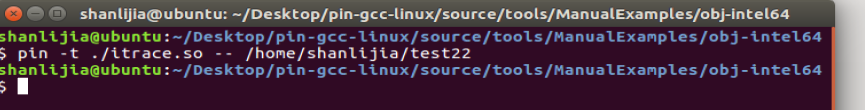
这个例子是会输出所有的test22的指令的地址到文件itrace.out中。运行完后可以查看该文件。
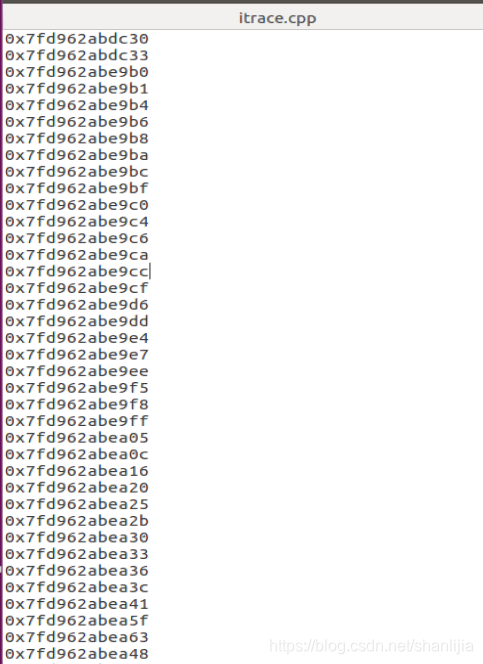
完毕!