我新开了一个专栏放资源分享,专门放一些我搜集的觉的不错的,不至于吃土的学习资源。希望给大家一些帮助。能找到出处的我都会尽力注明,没有的大家知道也可以评论告诉我。
还有就是,只是单纯分享,我没有收取任何利益。
今天介绍的是一位日本可爱的大佬的github项目,项目地址:
https://github.com/gzr2017/ImageProcessing100Wen
图像处理100问,这个项目切切实实的包含了100个各种直击你薄弱底子的问题,看完可以帮你完善很多的知识漏洞和误区。

直接看看目录吧:
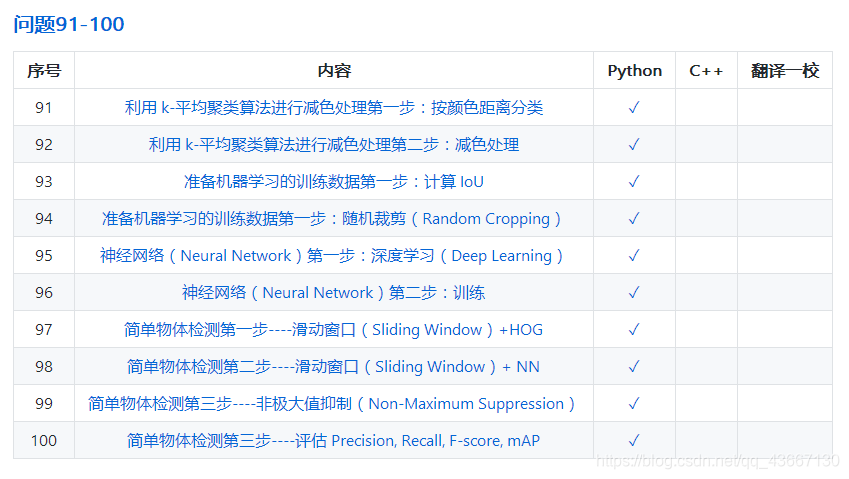

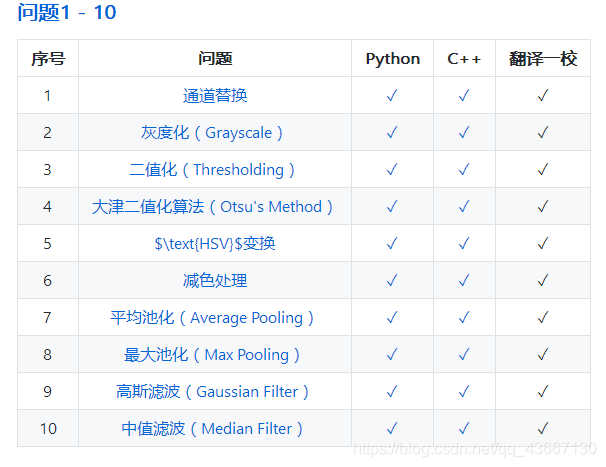
截取了三张,应该能看出他覆盖的还是很全面的了叭。附带python和c++两套代码,可以根据自己条件选择。
来随便找一个问题看看:

问题简单直接,还附带一点点知识点介绍,该项目作者本人奉行的是手写代码实现,而不是简单的调用一句opencv的API,可以看看这道题的答案:
C++版:
#include <opencv2/core.hpp>
#include <opencv2/highgui.hpp>
#include <iostream>
#include <math.h>
// histogram normalization
cv::Mat histogram_normalization(cv::Mat img, int a, int b){
  // get height and width
  int width = img.cols;
  int height = img.rows;
  int channel = img.channels();

  int c, d;
  int val;

  // prepare output
  cv::Mat out = cv::Mat::zeros(height, width, CV_8UC3);

  // get [c, d]
  for (int y = 0; y < height; y++){
    for (int x = 0; x < width; x++){
      for (int _c = 0; _c < channel; _c++){
        val = (float)img.at<cv::Vec3b>(y, x)[_c];
        c = fmin(c, val);
        d = fmax(d, val);
      }
    }
  }

  // histogram transformation
  for (int y = 0; y < height; y++){
    for ( int x = 0; x < width; x++){
      for ( int _c = 0; _c < 3; _c++){
        val = img.at<cv::Vec3b>(y, x)[_c];

        if (val < a){
          out.at<cv::Vec3b>(y, x)[_c] = (uchar)a;
        }
        else if (val <= b){
          out.at<cv::Vec3b>(y, x)[_c] = (uchar)((b - a) / (d - c) * (val - c) + a);
        }
        else {
          out.at<cv::Vec3b>(y, x)[_c] = (uchar)b;
        }
      }
    }
  }

  return out;
}

int main(int argc, const char* argv[]){
  // read image
  cv::Mat img = cv::imread("imori_dark.jpg", cv::IMREAD_COLOR);

  // histogram normalization
  cv::Mat out = histogram_normalization(img, 0, 255);

  //cv::imwrite("out.jpg", out);
  cv::imshow("answer", out);
  cv::waitKey(0);
  cv::destroyAllWindows();

  return 0;
}
python版本:
import cv2
import numpy as np
import matplotlib.pyplot as plt

# histogram normalization
def hist_normalization(img, a=0, b=255):
  # get max and min
  c = img.min()
  d = img.max()

  out = img.copy()

  # normalization
  out = (b-a) / (d - c) * (out - c) + a
  out[out < a] = a
  out[out > b] = b
  out = out.astype(np.uint8)

  return out

# Read image
img = cv2.imread("imori_dark.jpg").astype(np.float)
H, W, C = img.shape

# histogram normalization
out = hist_normalization(img)

# Display histogram
plt.hist(out.ravel(), bins=255, rwidth=0.8, range=(0, 255))
plt.savefig("out_his.png")
plt.show()

# Save result
cv2.imshow("result", out)
cv2.waitKey(0)
cv2.imwrite("out.jpg", out)
纯手写实现,真的可以加深你对一个概念的理解。关于直方图我也发过两篇原创文章,我觉得很详细了:
【opencv】带你再学一遍直方图
唉,再再再学一下直方图:直方图反投影
最后再放一遍github地址:
https://github.com/gzr2017/ImageProcessing100Wen
如果觉的有用,就点个赞吧。
关注公众号,查看资源分享专栏看更多opencv图像处理学习资源。
