在所有的应用中,cache 是个好东西。因为是在内存里,它的访问速度快,而且有时甚至直接进行使用,这样它就无形加快我们的搜索速度。默认情况下 cache 是启动的。你也可以通过如下的方式来关掉 cache:
PUT /my-index-000001
{
  "settings": {
    "index.requests.cache.enable": false
  }
}
在今天的文章中,我将分享几个小的技巧。希望对大家的学习有所帮助。为了方便我们的讲解,我们先使用 Kibana 自带的索引来进行展示。
准备数据
在今天的教程中,我们将使用 Kibana 自带的索引来进行展示。打开 Kibana 界面:
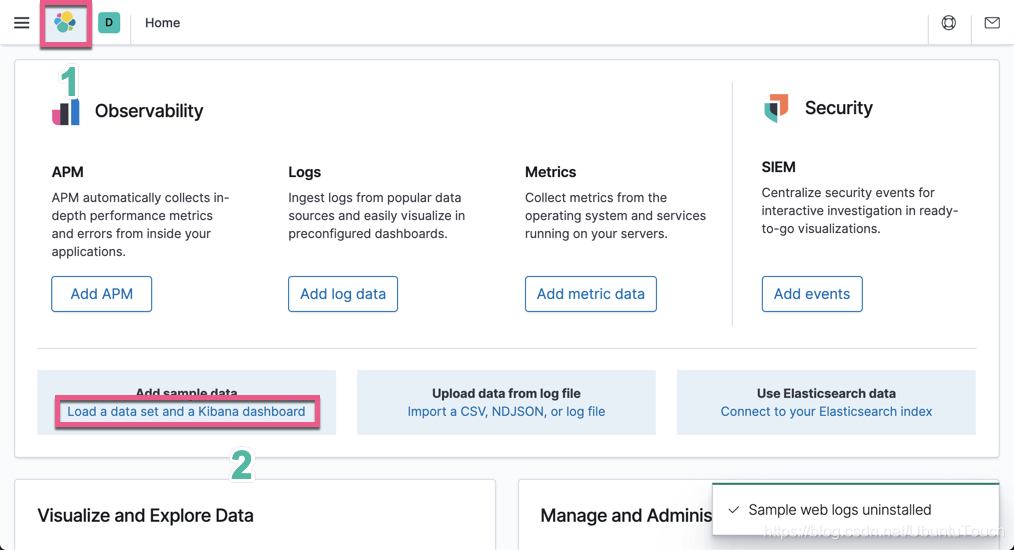
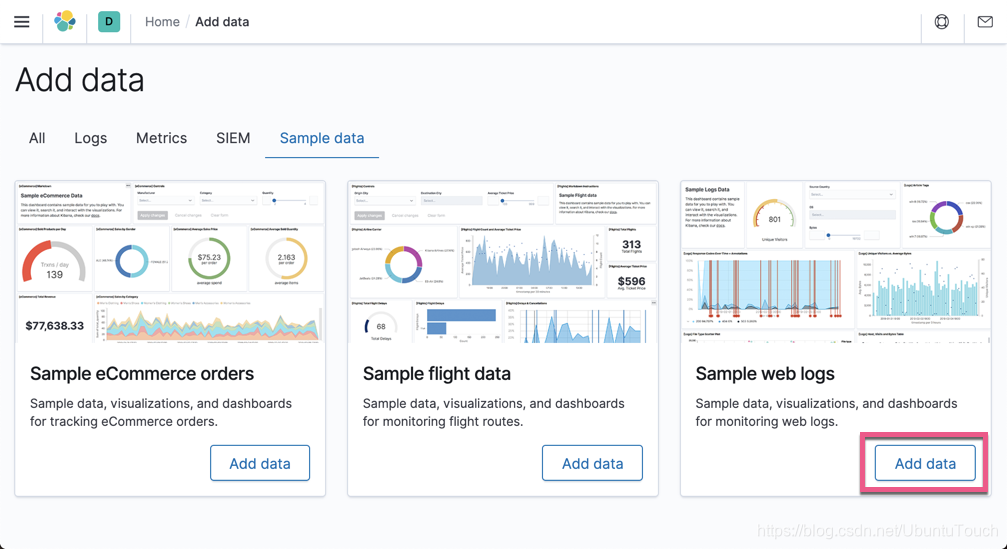
点击 Add data:
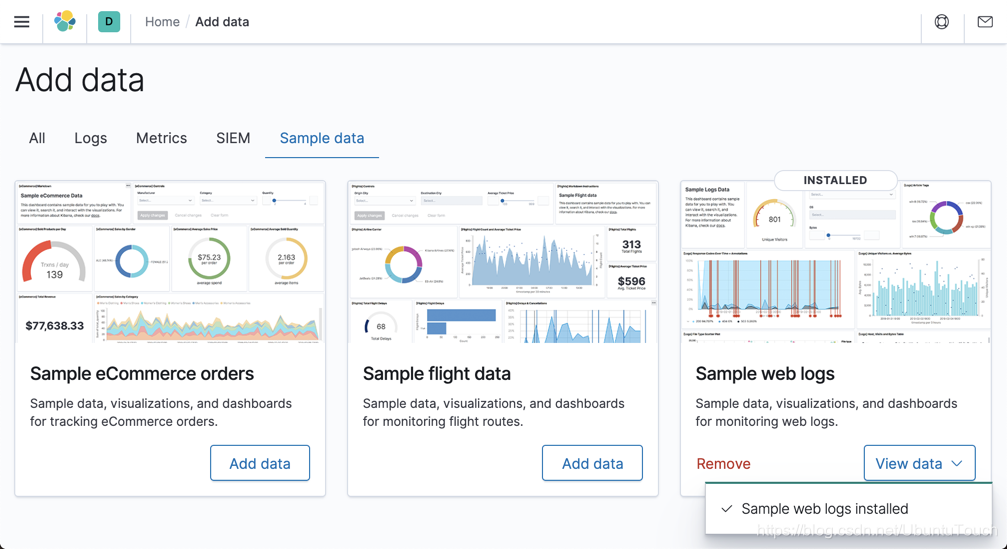
这样我们的样本数据就导入进 Elasticsearch 了。通过上面的操作,我们在 Elasticsearch 中将生成一个叫做 kibana_sample_data_logs 的索引。
使用 filter 还是 一般的查询?
在 Elasticsearch 中,如果使用 filter 的话,它将被 cache,从而可以帮我们提高性能。在使用 filter 时,必须注意的一点就是 filter 不会对我们的最终的分数有任何的影响,也就是说,如果你不想这个部分的查询对分数有所影响,你首先 filter,而且尽量使用 filter。
我们先对我们的 kibana_sample_data_logs 来进行操作:
GET kibana_sample_data_logs/_search
{
  "query": {
    "range": {
      "@timestamp": {
        "gte": "2020-07-26",
        "lte": "2020-08-03"
      }
    }
  }
}
上面的查询结果是:
  "hits" : {
    "total" : {
      "value" : 2096,
      "relation" : "eq"
    },
    "max_score" : 1.0,
    "hits" : [
      {
        "_index" : "kibana_sample_data_logs",
        "_type" : "_doc",
        "_id" : "Rm84uHMBZS6OOEix1ZMc",
        "_score" : 1.0,
        "_source" : {
          "agent" : "Mozilla/5.0 (X11; Linux x86_64; rv:6.0a1) Gecko/20110421 Firefox/6.0a1",
          "bytes" : 6219,
          "clientip" : "223.87.60.27",
          "extension" : "deb",
          "geo" : {
            "srcdest" : "IN:US",
            "src" : "IN",
            "dest" : "US",
            "coordinates" : {
              "lat" : 39.41042861,
              "lon" : -88.8454325
            }
          },
          "host" : "artifacts.elastic.co",
          "index" : "kibana_sample_data_logs",
          "ip" : "223.87.60.27",
          "machine" : {
            "ram" : 8589934592,
            "os" : "win 8"
          },
          "memory" : null,
          "message" : "223.87.60.27 - - [2018-07-22T00:39:02.912Z] \"GET /elasticsearch/elasticsearch-6.3.2.deb_1 HTTP/1.1\" 200 6219 \"-\" \"Mozilla/5.0 (X11; Linux x86_64; rv:6.0a1) Gecko/20110421 Firefox/6.0a1\"",
          "phpmemory" : null,
          "referer" : "http://twitter.com/success/wendy-lawrence",
          "request" : "/elasticsearch/elasticsearch-6.3.2.deb",
          "response" : 200,
          "tags" : [
            "success",
            "info"
          ],
          "timestamp" : "2020-07-26T00:39:02.912Z",
          "url" : "https://artifacts.elastic.co/downloads/elasticsearch/elasticsearch-6.3.2.deb_1",
          "utc_time" : "2020-07-26T00:39:02.912Z",
          "event" : {
            "dataset" : "sample_web_logs"
          }
        }
      },
    ...
在上面的查询中,它是不被 cache 的,同时我们可以看到分数(_score)都为 1.0。
如果这个查询我们经常会用,并且我们不关心搜索结果的分数,那么,我们可以使用 filter 来代替上面的 range 查询:
GET kibana_sample_data_logs/_search
{
  "query": {
    "bool": {
      "filter": [
        {
          "range": {
            "@timestamp": {
              "gte": "2020-07-26",
              "lte": "2020-08-03"
            }
          }
        }
      ]
    }
  }
}
上面的返回结果的结果是:
  "hits" : {
    "total" : {
      "value" : 2096,
      "relation" : "eq"
    },
    "max_score" : 0.0,
    "hits" : [
      {
        "_index" : "kibana_sample_data_logs",
        "_type" : "_doc",
        "_id" : "Rm84uHMBZS6OOEix1ZMc",
        "_score" : 0.0,
        "_source" : {
          "agent" : "Mozilla/5.0 (X11; Linux x86_64; rv:6.0a1) Gecko/20110421 Firefox/6.0a1",
          "bytes" : 6219,
          "clientip" : "223.87.60.27",
          "extension" : "deb",
          "geo" : {
            "srcdest" : "IN:US",
            "src" : "IN",
            "dest" : "US",
            "coordinates" : {
              "lat" : 39.41042861,
              "lon" : -88.8454325
            }
          },
          "host" : "artifacts.elastic.co",
          "index" : "kibana_sample_data_logs",
          "ip" : "223.87.60.27",
          "machine" : {
            "ram" : 8589934592,
            "os" : "win 8"
          },
          "memory" : null,
          "message" : "223.87.60.27 - - [2018-07-22T00:39:02.912Z] \"GET /elasticsearch/elasticsearch-6.3.2.deb_1 HTTP/1.1\" 200 6219 \"-\" \"Mozilla/5.0 (X11; Linux x86_64; rv:6.0a1) Gecko/20110421 Firefox/6.0a1\"",
          "phpmemory" : null,
          "referer" : "http://twitter.com/success/wendy-lawrence",
          "request" : "/elasticsearch/elasticsearch-6.3.2.deb",
          "response" : 200,
          "tags" : [
            "success",
            "info"
          ],
          "timestamp" : "2020-07-26T00:39:02.912Z",
          "url" : "https://artifacts.elastic.co/downloads/elasticsearch/elasticsearch-6.3.2.deb_1",
          "utc_time" : "2020-07-26T00:39:02.912Z",
          "event" : {
            "dataset" : "sample_web_logs"
          }
        }
      },
上面的分数(_score)显示为0,也就是说它不计入分数。使用这种 filter 的方式,查询是使用 cache,也就是说,当你第二次或之后使用同样的查询,你的速度将会大大提高,这是因为查询的结果来自cache。由于我们的数据有限,所以,我们看不出来时间的差异。对于大量的数据来说
另外的一个例子就是:
GET kibana_sample_data_logs/_search
{
  "query": {
    "bool": {
      "must": [
        {
          "match": {
            "geo.src": "CN"
          }
        },
        {
          "range": {
            "@timestamp": {
              "gte": "2020-07-26",
              "lte": "2020-08-03"
            }
          }
        }
      ]
    }
  }
}
在这里,我们差来自 CN 的,并且在 2020-07-26 和 2020-08-03 之间的所有文档。我们最好修改为:
GET  kibana_sample_data_logs/_search
{
  "query": {
    "bool": {
      "must": [
        {
          "match": {
            "geo.src": "CN"
          }
        }
      ],
      "filter": [
        {
          "range": {
            "@timestamp": {
              "gte": "2020-07-26",
              "lte": "2020-08-03"
            }
          }
        }
      ]
    }
  }
}
当然在任何的情况下,我们可以使用 request_cache=true 来强制使用 cache:
GET kibana_sample_data_logs/_search?request_cache=true
{
  "query": {
    "range": {
      "@timestamp": {
        "gte": "2020-07-26",
        "lte": "2020-08-03"
      }
    }
  }
}
在 aggregation 时设置 size=0 会自动 cache
即使在索引设置中启用了请求缓存,也不会缓存 size大于0的请求。如果你想使用缓存,一种办法就是把 size 置为 0。
我们打入如下的命令:
GET kibana_sample_data_logs/_search
{
  "size": 0,
  "aggs": {
    "src_countries": {
      "terms": {
        "field": "geo.src",
        "size": 10
      }
    }
  }
}
我们可以运行上面的命令多次,在返回的时间里:

我们会发现,第二次执行的时间比第一次的要少。如果我们去掉 size:0,那么:
GET kibana_sample_data_logs/_search
{
  "aggs": {
    "src_countries": {
      "terms": {
        "field": "geo.src",
        "size": 10
      }
    }
  }
}
那么这个搜索是不会缓存的。对于小的数据集来说,这个可能并不明显,但是对于大的数据集的查询来说,你将会看到很大的变化。
如果你确实不想把 size 设置为0, 那么,你必须在请求的时候,明显地指出来:
GET kibana_sample_data_logs/_search?request_cache=true
{
  "aggs": {
    "src_countries": {
      "terms": {
        "field": "geo.src",
        "size": 10
      }
    }
  }
}