import matplotlib.pyplot as plt
import seaborn as sns
planets = sns.load_dataset('planets')
方法一:
- plt.figure()
- plt.subplot()
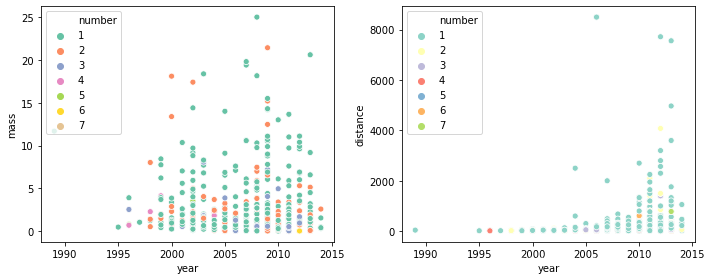
plt.figure(figsize=(10,4))
plt.subplot(1,2,1)
sns.scatterplot('year','mass',
data=planets,
hue='number',
palette='Set2')
plt.subplot(1,2,2)
sns.scatterplot('year','distance',
data=planets,
hue='number',
palette='Set3')
plt.tight_layout()
方法二:
- fig = plt.figure()
- ax = fig.add_subplot()
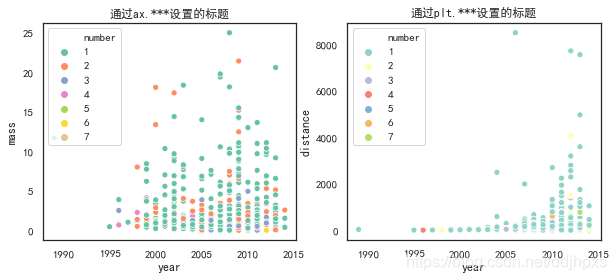
fig = plt.figure(figsize=(10,4))
sns.set(font='SimHei',style='white')
ax1 = fig.add_subplot(121)
sns.scatterplot('year','mass',
data=planets,
hue='number',
palette='Set2')
plt.title('通过plt.***设置的标题')
ax2 = fig.add_subplot(122)
sns.scatterplot('year','distance',
data=planets,
hue='number',
palette='Set3')
ax2.set_title('通过ax.***设置的标题')
plt.tight_layout()

方法三:
- fig, ax = plt.subplots()
- ax[]
fig, ax = plt.subplots(1,2,figsize=(10,4))
sns.scatterplot('year','mass',
data=planets,
hue='number',
palette='Set2',
ax=ax[0])
ax[0].set_title('通过ax.***设置的标题')
sns.scatterplot('year','distance',
data=planets,
hue='number',
palette='Set3',
ax=ax[1])
plt.title('通过plt.***设置的标题')
更加灵活的方式
fig = plt.figure(constrained_layout=True)
gs = fig.add_gridspec(2,2)
ax1 = fig.add_subplot(gs[0,:])
sns.scatterplot('year','mass',
data=planets,
hue='number',
palette='Set2',
legend=None)
ax2 = fig.add_subplot(gs[1,0])
sns.scatterplot('year','distance',
data=planets,
hue='number',
palette='Set3',
legend=None)
ax3 = fig.add_subplot(gs[1,1])
sns.scatterplot('year','orbital_period',
data=planets,
hue='number',
palette='Set2',
legend=None)
<matplotlib.axes._subplots.AxesSubplot at 0x205fa02fe88>
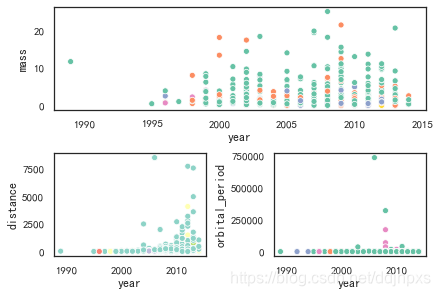
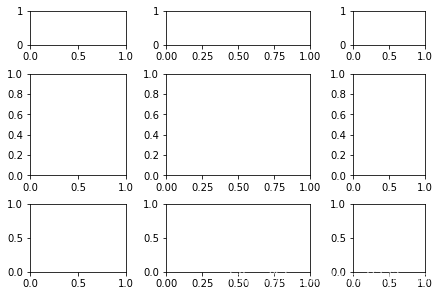
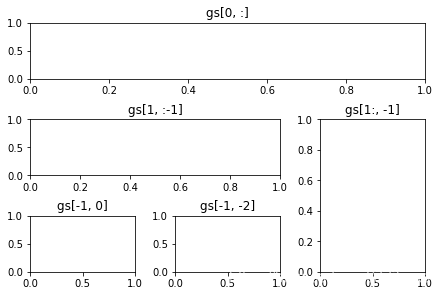
fig3 = plt.figure(constrained_layout=True)
gs = fig3.add_gridspec(3, 3)

f3_ax1 = fig3.add_subplot(gs[0, :])
f3_ax1.set_title('gs[0, :]')

f3_ax2 = fig3.add_subplot(gs[1, :-1])
f3_ax2.set_title('gs[1, :-1]')

f3_ax3 = fig3.add_subplot(gs[1:, -1])
f3_ax3.set_title('gs[1:, -1]')

f3_ax4 = fig3.add_subplot(gs[-1, 0])
f3_ax4.set_title('gs[-1, 0]')

f3_ax5 = fig3.add_subplot(gs[-1, -2])
f3_ax5.set_title('gs[-1, -2]')
通过传入gs_kw参数设定高宽比
gs_kw = dict(width_ratios=widths, height_ratios=heights)
fig6, f6_axes = plt.subplots(ncols=3, nrows=3, constrained_layout=True,
                             gridspec_kw=gs_kw)