import cv2
import numpy as np
import matplotlib.pyplot as plt
import time
def calcGrayHist(I):
h, w = I.shape[:2]
grayHist = np.zeros([256], np.uint64)
for i in range(h):
for j in range(w):
grayHist[I[i][j]] += 1
return grayHist
if __name__ == "__main__":
img_path = "./0.jpg"
frame = cv2.imread(img_path)
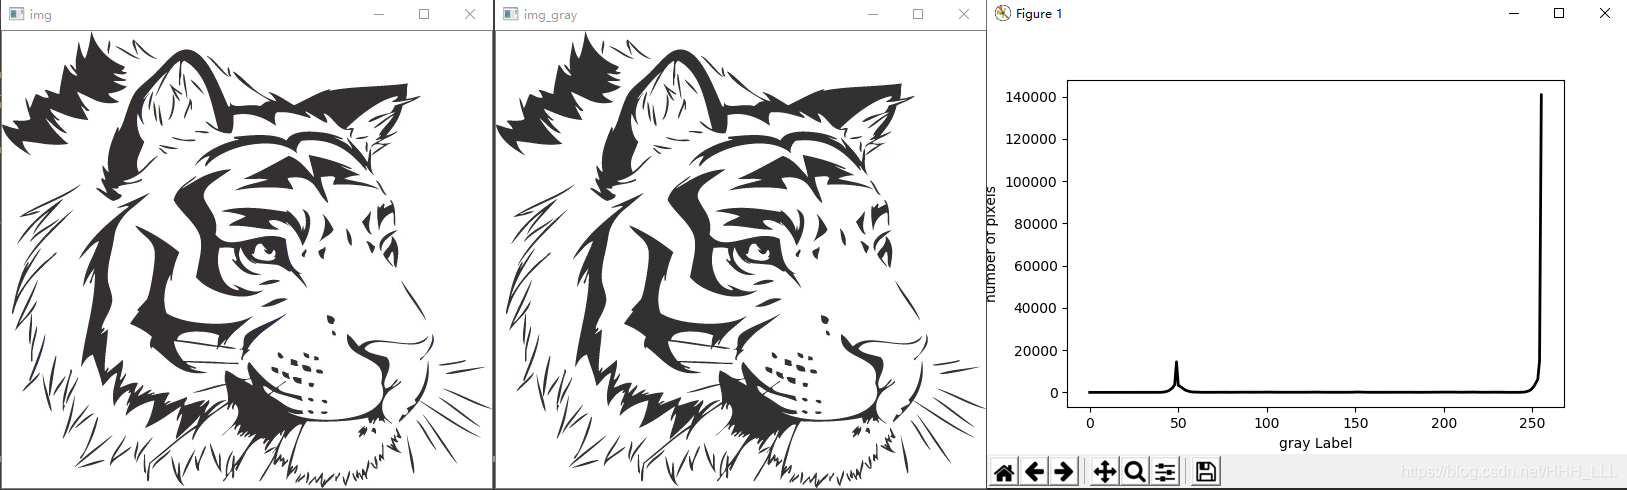
cv2.imshow("img",frame)
frame_gray = cv2.cvtColor(frame, cv2.COLOR_RGB2GRAY)
cv2.imshow("img_gray",frame_gray)
cv2.waitKey(0)
grayHist = calcGrayHist(frame_gray)
x = np.arange(256)
plt.plot(x, grayHist, 'r', linewidth=2, c='black')
plt.xlabel("gray Label")
plt.ylabel("number of pixels")
plt.show()