文章目录

Pre
当你的应用没有一套完善的监控告警系统,线上故障了 ,总是很被动,但是还得要定位问题 ,奈何手里无利器 ,没办法只能硬上了,虽然原始,好在有效~
所以原生的命令你需要特别熟悉,故障的时间很宝贵,所以留给我们翻资料的时间并不多 ~
如果你还不是很了解JVM提供的诊断命令, 戳这里–> JVM-10虚拟机性能监控与故障处理工具之【JDK的命令行】
常见故障
OOM
OOM了 , 但是你没有配置
-XX:+HeapDumpOnOutOfMemoryError -XX:HeapDumpPath=/opt/dump/heapdump.hprof -XX:OnOutOfMemoryError=/opt/restart.sh
重要的参数
-XX:+HeapDumpOnOutOfMemoryError: 表示当JVM发生OOM时,自动生成DUMP文件 最重要的参数,剩余两个参数可选-XX:HeapDumpPath: 表示生成DUMP文件的路径, 可以指定文件名称,-XX:HeapDumpPath=${目录}/java_heapdump.hprof。若不指定文件名,默认为:java_<pid>_<date>_<time>_heapDump.hprof-XX:OnOutOfMemoryError: 表示OOM时 需要触发的脚本,比如 重启动作,发送告警等等 用户自定义
或者GC很厉害,你怀疑有内存泄漏的地方 要看堆信息
那你需要谁呢?
- jmap Java 内存映射工具 + jhat 虚拟机堆转储快照分析工具
- jmap Java 内存映射工具 + MAT (推荐)
jmap Java 内存映射工具
概述
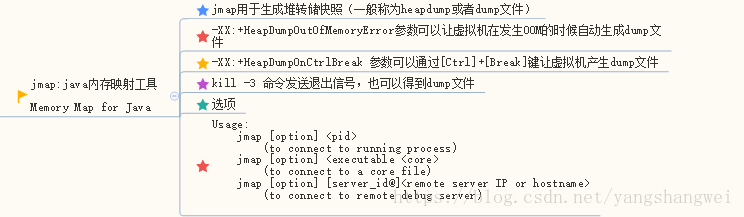
语法及使用
Usage:
    jmap [option] <pid>
        (to connect to running process)
    jmap [option] <executable <core>
        (to connect to a core file)
    jmap [option] [server_id@]<remote server IP or hostname>
        (to connect to remote debug server)

where <option> is one of:
    <none>               to print same info as Solaris pmap
    -heap                to print java heap summary
    -histo[:live]        to print histogram of java object heap; if the "live"
                         suboption is specified, only count live objects
    -clstats             to print class loader statistics
    -finalizerinfo       to print information on objects awaiting finalization
    -dump:<dump-options> to dump java heap in hprof binary format
                         dump-options:
                           live         dump only live objects; if not specified,
                                        all objects in the heap are dumped.
                           format=b     binary format
                           file=<file>  dump heap to <file>
                         Example: jmap -dump:live,format=b,file=heap.bin <pid>
    -F                   force. Use with -dump:<dump-options> <pid> or -histo
                         to force a heap dump or histogram when <pid> does not
                         respond. The "live" suboption is not supported
                         in this mode.
    -h | -help           to print this help message
    -J<flag>             to pass <flag> directly to the runtime system
jmap的主要选项
| 选项 | 作用 |
|---|---|
| -dump | 生成java堆转储快照。 格式为 -dump:[live,] format=b,file=<filename> 其中live子参数说明是否只dump出存活的对象 |
| -finalizeinfo | 显示在F-Queue中等待Finalizer线程执行finalize方法的对象。 只在linux/solaris平台有效 |
| -heap | 只显示Java堆详细信息。如使用脑胀回收器、参数配置、分代状况等。只在linux/solaris平台有效 |
| -histo | 显示堆中对象统计信息,包括类、实例数量、合计容量 |
| -permstat | 以ClassLoader为统计口径显示永久代内存状态。 只在linux/solaris平台有效 |
| -F | 当虚拟机进程对-dump选项没有响应时,可以使用这个选项强制生成dump快照。只在linux/solaris平台有效 |
使用举例, 对pid=12888的进程输出dump信息
E:\Program Files\Java\jdk1.8.0_161\bin>jmap -dump:format=b,file=test.bin 12888
Dumping heap to E:\Program Files\Java\jdk1.8.0_161\bin\test.bin ...
Heap dump file created
jhat 虚拟机堆转储快照分析工具
概述
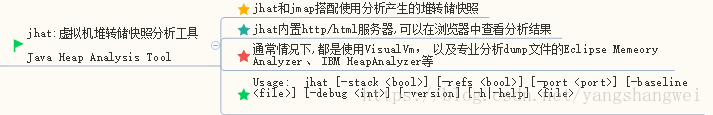
语法及使用
Usage:  jhat [-stack <bool>] [-refs <bool>] [-port <port>] [-baseline <file>] [-debug <int>] [-version] [-h|-help] <file>

        -J<flag>          Pass <flag> directly to the runtime system. For
                          example, -J-mx512m to use a maximum heap size of 512MB
        -stack false:     Turn off tracking object allocation call stack.
        -refs false:      Turn off tracking of references to objects
        -port <port>:     Set the port for the HTTP server.  Defaults to 7000
        -exclude <file>:  Specify a file that lists data members that should
                          be excluded from the reachableFrom query.
        -baseline <file>: Specify a baseline object dump.  Objects in
                          both heap dumps with the same ID and same class will
                          be marked as not being "new".
        -debug <int>:     Set debug level.
                            0:  No debug output
                            1:  Debug hprof file parsing
                            2:  Debug hprof file parsing, no server
        -version          Report version number
        -h|-help          Print this help and exit
        <file>            The file to read

For a dump file that contains multiple heap dumps,
you may specify which dump in the file
by appending "#<number>" to the file name, i.e. "foo.hprof#3".

All boolean options default to "true"
用法举例
E:\Program Files\Java\jdk1.8.0_161\bin>jmap -dump:format=b,file=test.bin 12888
Dumping heap to E:\Program Files\Java\jdk1.8.0_161\bin\test.bin ...
File exists

E:\Program Files\Java\jdk1.8.0_161\bin>jhat test.bin
Reading from test.bin...
Dump file created Mon Aug 06 20:49:25 CST 2018
Snapshot read, resolving...
Resolving 244224 objects...
Chasing references, expect 48 dots................................................
Eliminating duplicate references................................................
Snapshot resolved.
Started HTTP server on port 7000
Server is ready.
浏览器输入 http://localhost:7000/
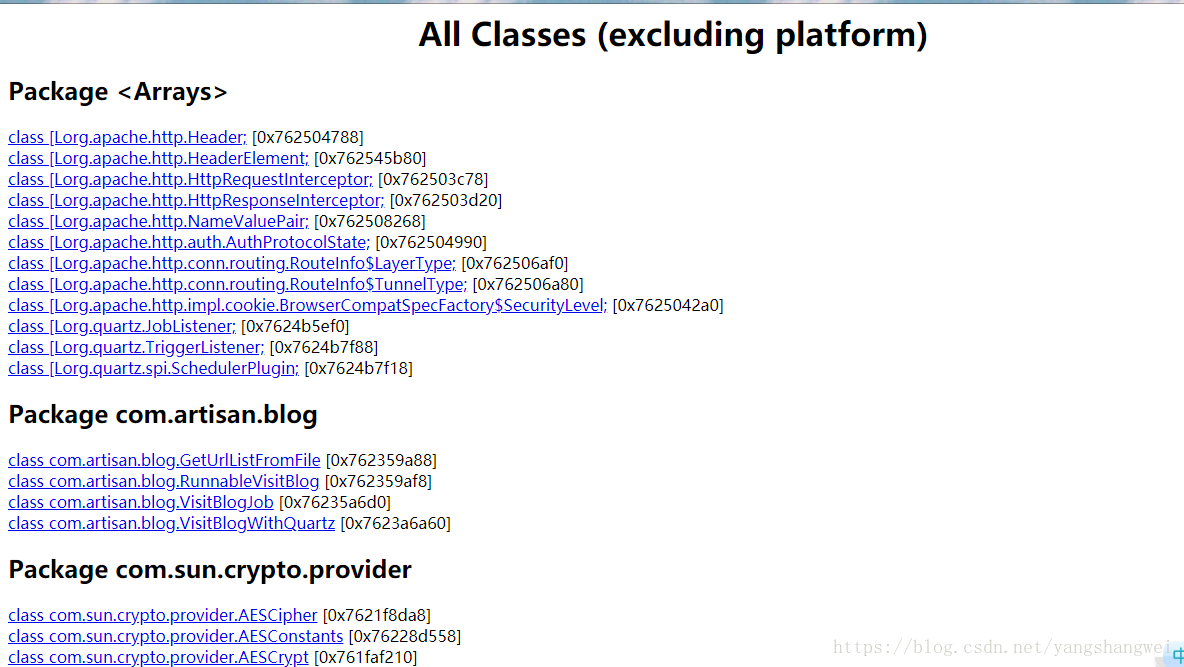
MAT
jmap导出的堆内存信息,如果有MAT, 更方便直观 ,推荐
CPU居高不下
传统步骤
- top -c ( -c 显示整个命令行而不只是显示命令名 ) ,查看占用cpu的进程
- shift+p 按照CPU消耗大小 给进程排序, 找到对应的PID 【P 根据CPU使用百分比大小进行排序】
top -Hp <PID>具体占用cpu利用率最高的线程号tid ,shift+p 按照CPU消耗大小【H 线程模式 】print "%\n" tid【将获取到的线程号转换成16进制】, 用于导出的线程堆栈中根据该关键字查到对应的线程信息jstack -l <PID> >001.log多执行几次 【-l 附带输出锁的信息】- 去log中取查找 第四步中转换出来的16进制的内容,看看相应的代码
总结下 ,top 找到 占用CPU最高的 PID, 然后使用top的H参数 线程模式 ,查找到最占用CPU的 TID , 这个tid 是十进制的, jstack导出来的tid是16进制,因此需要转成16进制 ,然后多执行几次jstack , 如果每次都有这个玩意,基本没跑了
jstack Java堆栈跟踪工具
概述
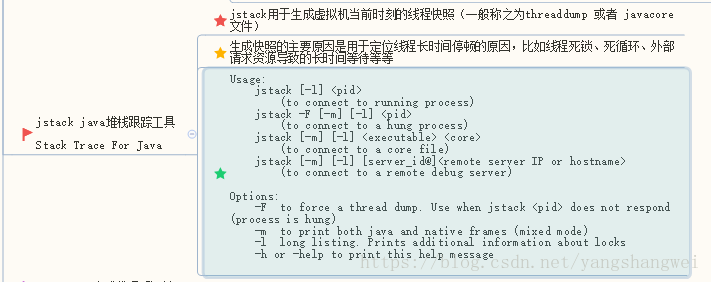
语法及使用
Usage:
    jstack [-l] <pid>
        (to connect to running process)
    jstack -F [-m] [-l] <pid>
        (to connect to a hung process)
    jstack [-m] [-l] <executable> <core>
        (to connect to a core file)
    jstack [-m] [-l] [server_id@]<remote server IP or hostname>
        (to connect to a remote debug server)

Options:
    -F  to force a thread dump. Use when jstack <pid> does not respond (process is hung)
    -m  to print both java and native frames (mixed mode)
    -l  long listing. Prints additional information about locks
    -h or -help to print this help message
jstack的主要选项
| 选项 | 作用 |
|---|---|
| -F | 当正常输出的请求不被响应时,强制输出线程堆栈 |
| -m | 如果调用到本地方法的话,可以显示C/C++的堆栈 |
| -l | 除了堆栈信息,显示关于锁的附件信息 |
用法举例
E:\Program Files\Java\jdk1.8.0_161\bin>jstack -l 12888
2018-08-06 21:01:10
Full thread dump Java HotSpot(TM) 64-Bit Server VM (24.51-b03 mixed mode):

"DestroyJavaVM" prio=6 tid=0x000000000e1ab800 nid=0x2f80 waiting on condition [0x0000000000000000]
   java.lang.Thread.State: RUNNABLE

   Locked ownable synchronizers:
        - None

"DefaultQuartzScheduler_QuartzSchedulerThread" prio=6 tid=0x000000000e1a9800 nid=0xb5c in Object.wait() [0x000000000f59f000]
   java.lang.Thread.State: TIMED_WAITING (on object monitor)
        at java.lang.Object.wait(Native Method)
        at org.quartz.core.QuartzSchedulerThread.run(QuartzSchedulerThread.java:410)
        - locked <0x0000000762395018> (a java.lang.Object)

   Locked ownable synchronizers:
        - None
......
.......
..........
线上分析工具

高阶工具 Arthas
https://alibaba.github.io/arthas/arthas-tutorials?language=cn

Arthas 是Alibaba开源的Java诊断工具,深受开发者喜爱。
当你遇到以下类似问题而束手无策时,Arthas可以帮助你解决:
-
这个类从哪个 jar 包加载的?为什么会报各种类相关的 Exception?
-
我改的代码为什么没有执行到?难道是我没 commit?分支搞错了?
-
遇到问题无法在线上 debug,难道只能通过加日志再重新发布吗?
-
线上遇到某个用户的数据处理有问题,但线上同样无法 debug,线下无法重现!
-
是否有一个全局视角来查看系统的运行状况?
-
有什么办法可以监控到JVM的实时运行状态?
-
怎么快速定位应用的热点,生成火焰图?
Arthas支持JDK 6+,支持Linux/Mac/Winodws,采用命令行交互模式,同时提供丰富的 Tab 自动补全功能,进一步方便进行问题的定位和诊断。
后续单独开篇介绍Arthas 这个牛逼的工具的使用及原理。