HQChart使用教程55- 自定义PC端K线图Tooltip
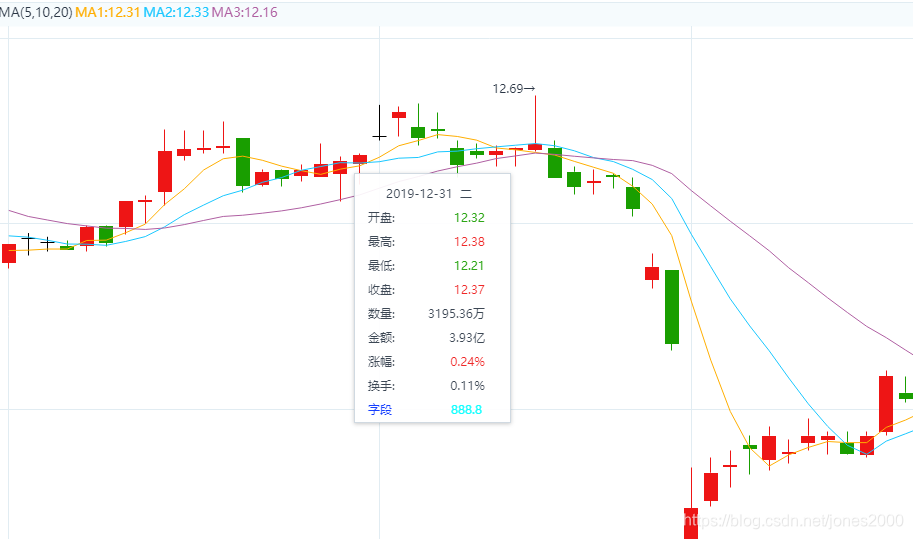
效果图
在原来tooltip增加一列数据
PC端Tooltip
pc端tooltip由div组成的, 这个和移动端的tooltip不一样, 移动端的是在canvas自己绘制的。 所以如果要定制自己的tooltip输出, 只需要修改tooltip的div元素和内容就可以
tooltip css
k线tooltip div对应的css名字为jschart-tooltip 如果要修改样式直接在外面把这个样式覆盖就可以
以下是hqchart内部默认的tooltip css.
/*tooltip的外层样式*/
.jschart-tooltip{
    box-shadow: 0px 1px 4px 0px rgba(0, 0, 0, 0.23);
    border: solid 1px rgba(200, 210, 219, 0.92);
    padding:7px 20px 15px 13px;
    box-sizing: border-box;
    position:relative;
    display: none;
    z-index: 9;
}

/*tooltip的内层样式*/
.tooltip-title{
    color:#2b3645;
    font-family: 微软雅黑;
    font-size:12px;
    text-align:center;
    display: block;
    line-height: 24px;
}
.tooltip-con{
    color:#2b3645;
    font-family: 微软雅黑;
    font-size:12px;
    line-height: 24px;
}
.tooltip-num{
    font-family: 微软雅黑;
    font-size:12px;
    line-height: 24px;
    text-align: right;
    display:inline-block;
    width:90px;
}
数据输出格式化类
tooltip内容输出由专门的K线tooltip格式化类完成(类名HistoryDataStringFormat), 如果要自定义,可以自己写一个新类来替换内置的类。
类成员变量
this.Value
包含当前K线的数据 和 K线线段绘制类
this.Text
最后输出div的html内容
this.Symbol
股票代码
this.LineCount
一共显示几行
this.Width
div的宽度
this.LanguageID
输出的语言
成员函数
this.Operator
this.Operator=function() {} 这个函数里面完成对K线的输出格式的拼接, 返回true/false, 如果返回false就不显示tooltip
下面是一个空tooltip的格式化类
//行情tooltip提示信息格式
function CustomHistoryDataStringFormat()
{
    this.Value;     //数据
    this.Text;      //输出字符串

    this.Symbol;
    this.LanguageID=JSCHART_LANGUAGE_ID.LANGUAGE_CHINESE_ID;//语言
    this.LineCount=0;    //一共几行
    this.Width=157;     //宽度

    this.Operator=function()    //拼div html 字符串 返回 true/false   注意false不显示tooltip
    {
    }
挂接自己的tooltip格式化类
所有格式化类都是由格式化类工厂创建的, 我们只要替换到类工厂创建的方法就可以。
下面是示类
- 获取全局的格式化类工厂实例
- 替换K线tooltip格式化类创建方法, 改成我们自己的格式化类
注意这个必须放在SetOption前面
JSChart.GetDivTooltipDataFormat().DataMap.set(
'HistoryDataStringFormat',
{ Create:()=> { return new CustomHistoryDataStringFormat() } }
);
完整示例
<!DOCTYPE html PUBLIC "-//W3C//DTD XHTML 1.0 Transitional//EN" "http://www.w3.org/TR/xhtml1/DTD/xhtml1-transitional.dtd">
<html xmlns="http://www.w3.org/1999/xhtml">
<head>
<meta name="viewport" content="width=device-width, initial-scale=1.0, minimum-scale=1.0, maximum-scale=1.0, user-scalable=no" />
<meta http-equiv="Content-Type" content="text/html; charset=utf-8" />
<title>PC自定义Tooltip(K线图)</title>
<!-- 加载资源 -->
<link rel="stylesheet" href="../jscommon/umychart.resource/css/tools.css" />
<link rel="stylesheet" href="../jscommon/umychart.resource/font/iconfont.css" />
</head>
<body>
<div id="kline" style="width: 900px;height:400px;position: relative;"></div>
<script src="content/js/jquery.min.js"></script>
<script src="content/js/webfont.js"></script>
<script src='../jscommon/umychart.console.js'></script>
<script src="../jscommon/umychart.network.js"></script>
<script src="../jscommon/umychart.js"></script> <!-- K线图形 -->
<script src="../jscommon/umychart.complier.js"></script> <!-- 麦语言解析执行器 -->
<script src="../jscommon/umychart.index.data.js"></script> <!-- 基础指标库 -->
<script src="../jscommon/umychart.style.js"></script> <!-- 白色风格和黑色风格配置信息 -->
<script>
//JSConsole.Chart.Log=() =>{}
//JSConsole.Complier.Log=()=>{}
//行情tooltip提示信息格式
function CustomHistoryDataStringFormat()
{
this.Value; //数据
this.Text; //输出字符串
this.Symbol;
this.UpColor="rgb(238,21,21)"; //上涨颜色
this.DownColor="rgb(25,158,0)"; //下跌颜色
this.UnchagneColor="rgb(0,0,0)"; //平盘
this.VolColor="rgb(43,54,69)"; //成交量
this.AmountColor="rgb(43,54,69)"; //成交金额
this.LanguageID=0; //语言 0 中文 1 英文
this.LineCount=0; //一共几行
this.Width=157; //宽度
this.Height; //高度
this.Operator=function() //拼div html 字符串
{
var data=this.Value.Data;
if (!data) return false;
console.log('[CustomHistoryDataStringFormat::CustomHistoryDataStringFormat] data', data);
let WEEK_NAME=["日","一","二","三","四","五","六"];
var date=new Date(parseInt(data.Date/10000),(data.Date/100%100-1),data.Date%100);
var strDate=data.Date; //日期 可以根据需求自己格式化日期
var title2=WEEK_NAME[date.getDay()]; //星期
if (data.Time>=0) title2=data.Time; //时间 可以根据需求自己格式化日期
var defaultfloatPrecision=2;//价格小数位数
var increase=null;
if (data.YClose>0) increase=(data.Close-data.YClose)/data.YClose*100;
var strText=
"<span class='tooltip-title'>"+strDate+"  "+title2+"</span>"+
"<span class='tooltip-con'>开盘</span>"+
"<span class='tooltip-num' style='color:"+this.GetColor(data.Open,data.YClose)+";'>"+data.Open.toFixed(defaultfloatPrecision)+"</span><br/>"+
"<span class='tooltip-con'>最高</span>"+
"<span class='tooltip-num' style='color:"+this.GetColor(data.High,data.YClose)+";'>"+data.High.toFixed(defaultfloatPrecision)+"</span><br/>"+
"<span class='tooltip-con'>最低</span>"+
"<span class='tooltip-num' style='color:"+this.GetColor(data.Low,data.YClose)+";'>"+data.Low.toFixed(defaultfloatPrecision)+"</span><br/>"+
"<span class='tooltip-con'>收盘</span>"+
"<span class='tooltip-num' style='color:"+this.GetColor(data.Close,data.YClose)+";'>"+data.Close.toFixed(defaultfloatPrecision)+"</span><br/>"+
//"<span style='color:"+this.YClose+";font:微软雅黑;font-size:12px'> 前收: "+IFrameSplitOperator.FormatValueString(data.YClose,2)+"</span><br/>"+
"<span class='tooltip-con'>数量</span>"+
"<span class='tooltip-num' style='color:"+this.VolColor+";'>"+IFrameSplitOperator.FormatValueString(data.Vol,2,this.LanguageID)+"</span><br/>"+
"<span class='tooltip-con'>金额</span>"+
"<span class='tooltip-num' style='color:"+this.AmountColor+";'>"+IFrameSplitOperator.FormatValueString(data.Amount,2,this.LanguageID)+"</span><br/>"+
"<span class='tooltip-con'>涨幅</span>"+
(increase==null? "<span class='tooltip-num' style='color:"+this.GetColor(0,0)+";'>"+'--'+"</span><br/>" :
"<span class='tooltip-num' style='color:"+this.GetColor(increase,0)+";'>"+increase.toFixed(2)+'%'+"</span><br/>");
this.LineCount=8;
if(data.FlowCapital>0) //股票换手率
{
var value=data.Vol/data.FlowCapital*100;
strText+= "<span class='tooltip-con'>换手</span>"+
"<span class='tooltip-num' style='color:"+this.AmountColor+";'>"+value.toFixed(2)+'%'+"</span><br/>";
++this.LineCount;
}
//显示叠加股票名称
if (this.Value.ChartPaint.Name=="Overlay-KLine")
{
var title="<span style='color:rgb(0,0,0);font:微软雅黑;font-size:12px;text-align:center;display: block;'>"+this.Value.ChartPaint.Title+"</span>";
strText=title+strText;
++this.LineCount;
}
//增加一个字段
strText+="<span class='tooltip-con' style='color:rgb(0,45,255);'>字段</span><span class='tooltip-num' style='color:rgb(0,255,255);'>888.8</span> <br/> ";
++this.LineCount;
this.Text=strText;
this.Width=157;
this.Height=this.LineCount*25; //每行高度25
return true;
}
this.GetColor=function(price,yclse)
{
if(price>yclse) return this.UpColor;
else if (price<yclse) return this.DownColor;
else return this.UnchagneColor;
}
}
//简单的把K线控件封装下
function KLineChart(divKLine)
{
this.DivKLine=divKLine;
this.Chart=JSChart.Init(divKLine); //把K线图绑定到一个Div上
this.DivTitle=document.getElementById('klinetitle');
//K线配置信息
this.Option= {
Type:'历史K线图', //创建图形类型
Windows: //窗口指标
[
{Index:"MA", Modify:false,Change:false},
{Index:"VOL", Modify:false,Change:false},
],
Symbol:'600000.sh',
IsAutoUpdate:true, //是自动更新数据
//TradeIndex: {Index:'交易系统-BIAS'}, //交易系统
IsShowRightMenu:true, //右键菜单
CorssCursorTouchEnd:true,
KLine: //K线设置
{
DragMode:1, //拖拽模式 0 禁止拖拽 1 数据拖拽 2 区间选择
Right:1, //复权 0 不复权 1 前复权 2 后复权
Period:0, //周期 0 日线 1 周线 2 月线 3 年线
MaxReqeustDataCount:1000, //数据个数
MaxRequestMinuteDayCount:10, //分钟数据取5天
PageSize:50, //一屏显示多少数据
//Info:["互动易","大宗交易",'龙虎榜',"调研","业绩预告","公告"], //信息地雷
IsShowTooltip:true, //是否显示K线提示信息
DrawType:0 //K线类型 0=实心K线柱子 1=收盘价线 2=美国线 3=空心K线柱子 4=收盘价面积图
},
KLineTitle: //标题设置
{
IsShowName:true, //不显示股票名称
IsShowSettingInfo:true //不显示周期/复权
},
Border: //边框
{
Left:5, //左边间距
Right:60, //右边间距
Bottom:25, //底部间距
Top:4 //顶部间距
},
Frame: //子框架设置
[
{SplitCount:3,StringFormat:0, IsShowLeftText:false},
{SplitCount:2,StringFormat:0, IsShowLeftText:false},
{SplitCount:2,StringFormat:0, IsShowLeftText:false}
]
};
this.Create=function() //创建图形
{
var self=this;
$(window).resize(function() { self.OnSize(); }); //绑定窗口大小变化事件
var blackStyle=HQChartStyle.GetStyleConfig(STYLE_TYPE_ID.BLACK_ID); //读取黑色风格配置
//JSChart.SetStyle(blackStyle);
//this.DivKLine.style.backgroundColor=blackStyle.BGColor; //设置最外面的div背景
this.OnSize(); //让K线全屏
this.Chart.SetOption(this.Option); //设置K线配置
}
this.OnSize=function() //自适应大小调整
{
var height= $(window).height();
var width = $(window).width();
this.DivKLine.style.top='px';
this.DivKLine.style.left='px';
this.DivKLine.style.width=width+'px';
this.DivKLine.style.height=height+'px';
this.Chart.OnSize();
}
}
$(function ()
{
WebFont.load({ custom: { families: ['iconfont'] } }); //预加载下iconfont资源
//Tooltip使用自己的格式类
JSChart.GetDivTooltipDataFormat().DataMap.set('HistoryDataStringFormat', { Create:()=> { return new CustomHistoryDataStringFormat() } } );
var klineControl=new KLineChart(document.getElementById('kline'));
klineControl.Create();
})
</script>
</body>
</html>
<style>
</style>
VUE 部分代码
vue 需要加上空间名
 import HQChart from 'hqchart'
 .........
 HQChart.Chart.JSChart.GetDivTooltipDataFormat().DataMap.set(
 	'HistoryDataStringFormat',
 	{ Create:()=> { return new CustomHistoryDataStringFormat() } }
 );
内置类HistoryDataStringFormat代码
这个是hqchart内置的HistoryDataStringFormat类的实现代码
- 使用了统一的全局置域配置变量 g_JSChartResource
- 使用了统一的多语言配置 g_JSChartLocalization
- 日期和时间进行了格式化输出
//行情tooltip提示信息格式
var WEEK_NAME=["日","一","二","三","四","五","六"];
function HistoryDataStringFormat()
{
this.newMethod=IChangeStringFormat; //派生
this.newMethod();
delete this.newMethod;
this.Symbol;
this.UpColor=g_JSChartResource.UpTextColor;
this.DownColor=g_JSChartResource.DownTextColor;
this.UnchagneColor=g_JSChartResource.UnchagneTextColor;
this.VolColor=g_JSChartResource.DefaultTextColor;
this.AmountColor=g_JSChartResource.DefaultTextColor;
this.LanguageID=JSCHART_LANGUAGE_ID.LANGUAGE_CHINESE_ID;
this.LineCount=0; //一共几行
this.Width=157; //宽度
this.Height=25*5; //高度
this.Operator=function()
{
var data=this.Value.Data;
if (!data) return false;
this.Width=157;
if (this.LanguageID==JSCHART_LANGUAGE_ID.LANGUAGE_ENGLISH_ID) this.Width=180;
var date=new Date(parseInt(data.Date/10000),(data.Date/100%100-1),data.Date%100);
var strDate=IFrameSplitOperator.FormatDateString(data.Date);
var title2=g_JSChartLocalization.GetText(WEEK_NAME[date.getDay()],this.LanguageID);
if (ChartData.IsMinutePeriod(this.Value.ChartPaint.Data.Period,true)) // 分钟周期
{
title2=IFrameSplitOperator.FormatTimeString(data.Time);
}
else if (ChartData.IsSecondPeriod(this.Value.ChartPaint.Data.Period))
{
title2=IFrameSplitOperator.FormatTimeString(data.Time,'HH:MM:SS');
}
var defaultfloatPrecision=GetfloatPrecision(this.Symbol);//价格小数位数
var increase=null;
if (data.YClose>0) increase=(data.Close-data.YClose)/data.YClose*100;
var strText=
"<span class='tooltip-title'>"+strDate+"  "+title2+"</span>"+
"<span class='tooltip-con'>"+g_JSChartLocalization.GetText('DivTooltip-Open',this.LanguageID)+"</span>"+
"<span class='tooltip-num' style='color:"+this.GetColor(data.Open,data.YClose)+";'>"+data.Open.toFixed(defaultfloatPrecision)+"</span><br/>"+
"<span class='tooltip-con'>"+g_JSChartLocalization.GetText('DivTooltip-High',this.LanguageID)+"</span>"+
"<span class='tooltip-num' style='color:"+this.GetColor(data.High,data.YClose)+";'>"+data.High.toFixed(defaultfloatPrecision)+"</span><br/>"+
"<span class='tooltip-con'>"+g_JSChartLocalization.GetText('DivTooltip-Low',this.LanguageID)+"</span>"+
"<span class='tooltip-num' style='color:"+this.GetColor(data.Low,data.YClose)+";'>"+data.Low.toFixed(defaultfloatPrecision)+"</span><br/>"+
"<span class='tooltip-con'>"+g_JSChartLocalization.GetText('DivTooltip-Close',this.LanguageID)+"</span>"+
"<span class='tooltip-num' style='color:"+this.GetColor(data.Close,data.YClose)+";'>"+data.Close.toFixed(defaultfloatPrecision)+"</span><br/>"+
//"<span style='color:"+this.YClose+";font:微软雅黑;font-size:12px'> 前收: "+IFrameSplitOperator.FormatValueString(data.YClose,2)+"</span><br/>"+
"<span class='tooltip-con'>"+g_JSChartLocalization.GetText('DivTooltip-Vol',this.LanguageID)+"</span>"+
"<span class='tooltip-num' style='color:"+this.VolColor+";'>"+IFrameSplitOperator.FormatValueString(data.Vol,2,this.LanguageID)+"</span><br/>"+
"<span class='tooltip-con'>"+g_JSChartLocalization.GetText('DivTooltip-Amount',this.LanguageID)+"</span>"+
"<span class='tooltip-num' style='color:"+this.AmountColor+";'>"+IFrameSplitOperator.FormatValueString(data.Amount,2,this.LanguageID)+"</span><br/>"+
"<span class='tooltip-con'>"+g_JSChartLocalization.GetText('DivTooltip-Increase',this.LanguageID)+"</span>"+
(increase==null? "<span class='tooltip-num' style='color:"+this.GetColor(0,0)+";'>"+'--'+"</span><br/>" :
"<span class='tooltip-num' style='color:"+this.GetColor(increase,0)+";'>"+increase.toFixed(2)+'%'+"</span><br/>");
this.LineCount=8;
if(MARKET_SUFFIX_NAME.IsSHSZStockA(this.Symbol) && data.FlowCapital>0) //换手率
{
var value=data.Vol/data.FlowCapital*100;
strText+= "<span class='tooltip-con'>"+g_JSChartLocalization.GetText('DivTooltip-Exchange',this.LanguageID)+"</span>"+
"<span class='tooltip-num' style='color:"+this.AmountColor+";'>"+value.toFixed(2)+'%'+"</span><br/>";
++this.LineCount;
}
//叠加股票
if (this.Value.ChartPaint.Name=="Overlay-KLine")
{
var title="<span style='color:rgb(0,0,0);font:微软雅黑;font-size:12px;text-align:center;display: block;'>"+this.Value.ChartPaint.Title+"</span>";
strText=title+strText;
++this.LineCount;
}
this.Text=strText;
this.Height=this.LineCount*25;
return true;
}
this.GetColor=function(price,yclse)
{
if(price>yclse) return this.UpColor;
else if (price<yclse) return this.DownColor;
else return this.UnchagneColor;
}
}
如果还有问题可以加交流QQ群: 950092318
HQChart代码地址
地址:github.com/jones2000/HQChart