实验案例
监控nginx服务,实现nginx宕机,zabbix自动重启其服务,如若重启失败,则邮件报警。
环境:
server:
192.168.1.11
centos7 zabbix4.4
agent:
192.168.1.12
centos7 zabbix4.4
一、安装zabbix服务端,见上篇文章
https://blog.csdn.net/oToyix/article/details/106853849
改字体
[root@localhost ~]# mv stkaiti.ttf /usr/local/nginx/html/zabbix/assets/fonts/DejaVuSans.ttf
二、安装配置zabbix-agent端
安装zabbix源
[root@localhost ~]# yum install http://repo.zabbix.com/zabbix/4.5/rhel/7/x86_64/zabbix-release-4.5-2.el7.noarch.rpm
安装zabbix-agent
[root@localhost ~]# yum install zabbix40 abbix40-agent -y
[root@localhost ~]# rpm -qa|grep zabbix
zabbix40-4.0.17-1.el7.x86_64
zabbix-release-4.5-2.el7.noarch
zabbix40-agent-4.0.17-1.el7.x86_64
客户端口开启主动模式
[root@localhost ~]# sed -i "s/ServerActive=127.0.0.1/ServerActive=192.168.1.11/g" /etc/zabbix_agentd.conf
[root@localhost ~]# sed -i "s/Hostname=Zabbix server/Hostname=192.168.1.12/" /etc/zabbix_agentd.conf
[root@localhost ~]# egrep -v '^#|^$' /etc/zabbix_agentd.conf
PidFile=/run/zabbix/zabbix_agentd.pid
LogFile=/var/log/zabbix/zabbix_agentd.log
LogFileSize=0
Server=192.168.1.11
ServerActive=192.168.1.11
Hostname=192.168.1.12
启动zabbix-agent
[root@localhost ~]# systemctl start zabbix-agent
[root@localhost ~]# ps -ef|grep zabbix
zabbix    2312     1  0 18:37 ?        00:00:00 /usr/sbin/zabbix_agentd -f
zabbix    2313  2312  0 18:37 ?        00:00:00 /usr/sbin/zabbix_agentd: collector [idle 1 sec]
zabbix    2314  2312  0 18:37 ?        00:00:00 /usr/sbin/zabbix_agentd: listener #1 [waiting for connection]
zabbix    2315  2312  0 18:37 ?        00:00:00 /usr/sbin/zabbix_agentd: listener #2 [waiting for connection]
zabbix    2316  2312  0 18:37 ?        00:00:00 /usr/sbin/zabbix_agentd: listener #3 [waiting for connection]
zabbix    2317  2312  0 18:37 ?        00:00:00 /usr/sbin/zabbix_agentd: active checks #1 [idle 1 sec]
root      2319  1961  0 18:37 pts/0    00:00:00 grep --color=auto zabbix
三、zabbixserver添加客户端主机-nginx监控项_nginx_port
配置-主机-创建主机

server端测试
[root@localhost ~]# /usr/local/zabbix/bin/zabbix_get -s 192.168.1.12 -k "net.tcp.listen[80]"
1
创建图形
配置-主机-图形-创建图形

查看监控结果

四、zabbixserver添加 nginx监控项stub_status
[root@localhost ~]# vim /usr/local/nginx/conf/nginx.conf
 48         location /status {
 49                 stub_status;
 50         }
 51
 [root@localhost ~]# /usr/local/nginx/sbin/nginx -s reload
查看状态数据
[root@localhost ~]# curl -s 192.168.1.12/status
Active connections: 1
server accepts handled requests
 32 32 39
Reading: 0 Writing: 1 Waiting: 0
[root@localhost ~]# curl -s 192.168.1.12/status 2>/dev/null |awk 'NR==3 {print $3}'
40
注:
NR==3意思是第三行
$3 表示第3个值即39(访问数),因为本次又执行了一遍curl,所以为40
为了更好的利用stub_status模块,写个脚本来传递参数
[root@localhost ~]# mkdir -p /data/sh
[root@localhost ~]# vim /data/sh/nginx_stub_status.sh
#!/bin/bash
# by toyix
#######################

function active {
        curl 192.168.1.12/status 2>/dev/null |awk 'NR==1{print $NF}'
        }
function accepts {
        curl 192.168.1.12/status 2>/dev/null | awk 'NR==3{print $1}'
        }
function handled {
        curl 192.168.1.12/status 2>/dev/null | awk 'NR==3{print $2}'
        }
function requests {
        curl 192.168.1.12/status 2>/dev/null | awk 'NR==3{print $3}'
}
function reading {
        curl 192.168.1.12/status 2>/dev/null | awk 'NR==4{print $2}'
}
function writing {
        curl 192.168.1.12/status 2>/dev/null | awk 'NR==4{print $4}'
}
function waiting {
        curl 192.168.1.12/status 2>/dev/null | awk 'NR==4{print $NF}'
}

$1
使用脚本,定义进zabbix_agent.conf中
[root@localhost sh]# vim /etc/zabbix_agentd.conf
292 UserParameter=nginx.stub.status[*],bash /data/sh/nginx_stub_status.sh $1
[root@localhost sh]# systemctl restart zabbix-agent
server端测试脚本
[root@localhost sh]# /usr/local/zabbix/bin/zabbix_get -s 192.168.1.12 -k "nginx.stub.status[requests]"
42
web端添加此监控项(nginx.stub.status)

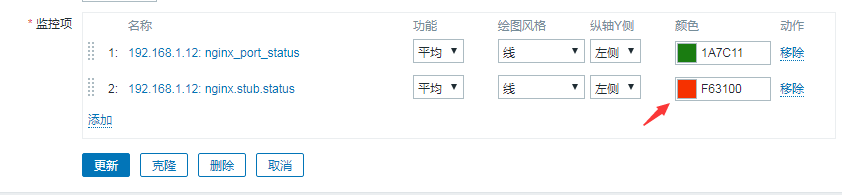
加入图形
查看最新数据

五、zabbixserver添加 nginx监控项killall -0
客户端安装killall工具
[root@localhost sh]# yum install psmisc -y
[root@localhost ~]# chmod u+s /usr/bin/killall
编辑脚本
[root@localhost ~]# vim /data/sh/nginx.killall_echo.sh
#!/bin/bash
#by toyix
#############################

killall -0 nginx &>/dev/null

if [ $? -eq 0 ];then
        echo 1
else
        echo 0
fi
[root@localhost ~]# chmod +x /data/sh/nginx.killall_echo.sh
加入zabbix_agent.conf
[root@localhost ~]# vim /etc/zabbix_agentd.conf
UserParameter=nginx.killall,bash /data/sh/nginx.killall_echo.sh
[root@localhost ~]# systemctl restart zabbix-agent
server端脚本测试
[root@localhost sh]# /usr/local/zabbix/bin/zabbix_get -s 192.168.1.12 -k "nginx.killall"
1
加入监控项


六、创建触发器
配置-主机-触发器-创建触发器


七、动作-邮件报警
1、设置报警媒介-设置邮件信息
管理-报警媒介类型(点击email)
发件人:

收件人:

2、添加动作-发 邮件
配置-动作-创建动作


停止服务
[root@localhost ~]# pkill nginx
检测是否会发送邮件

八、动作-自动启动服务,启动成功后不再发送邮件,启动失败,则发送邮件


1、启动服务成功,不发送邮件
测试,关闭服务,看结果
[root@localhost ~]# pkill nginx
查看问题,右下角发现已执行远程命令

查看进程是否成功启动
[root@localhost ~]# ps -ef|grep nginx
root      6622     1  0 00:35 ?        00:00:00 nginx: master process /usr/local/nginx/sbin/nginx
nginx     6623  6622  0 00:35 ?        00:00:00 nginx: worker process
root      6637  1961  0 00:36 pts/0    00:00:00 grep --color=auto nginx
上面为启动成功,没有发送邮件
2、现在改配置文件,让nginx启动失败,发送邮件
    keepalive_timeout  65;
dsfdsfdsfdsf   nginx.conf中随便加几个字
    #gzip  on;
[root@localhost ~]# pkill nginx
查看问题状态,发送邮件了


注:
1、当监测问题时间与系统时间不一致时,改
[root@localhost ~]# vim /usr/local/php7/etc/php-fpm.d/default.conf
php_value[date.timezone] = Asia/Shanghai
2、创建触发器规则时,T值最好等于1,如果=2,会执行完远程命令后,直接发送问题邮件,因为在检查问题是否解决时,会认为问题没有解决,这是一个bug.
---------------end