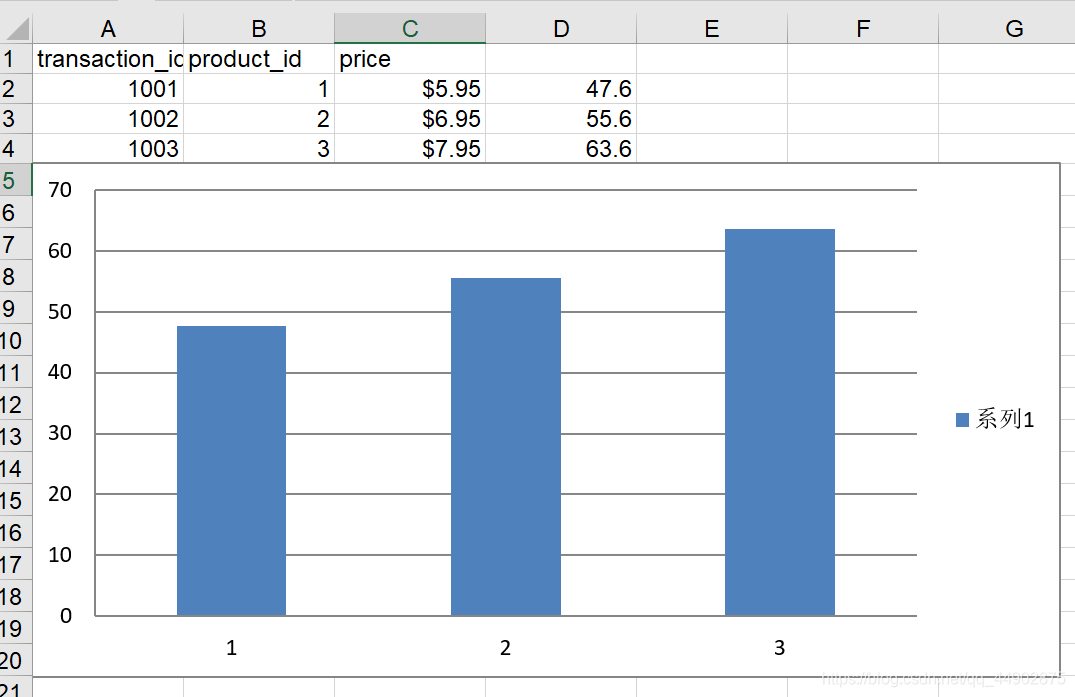
本列展示如何在Excel中自动的计算值以及如何自动的添加表格
#别名
import openpyxl as xl
from openpyxl.chart import BarChart,Reference
#加载对象
wb = xl.load_workbook('transactions.xlsx')
sheet = wb['Sheet1']    #excel中的下面的Sheet1
cell = sheet['a1']      #a1为列表
cell = sheet.cell(1,1)  #取第一个表格的值
# print(cell.value)
# print(sheet.max_row)
for row in range(2,sheet.max_row + 1):
    # print(row)
    cell = sheet.cell(row,3)	#取第三列的值
    # print(cell.value)
    cor_price = cell.value * 8
    cor_price_call = sheet.cell(row,4)	#计算完的值显示在第四列
    cor_price_call.value = cor_price

values = Reference(sheet,min_row=2,
          max_row=sheet.max_row,
          min_col=4,	#需要显示的表格的行
          max_col=4)	#需要显示的表格的列

chart = BarChart()
chart.add_data(values)
sheet.add_chart(chart,'a5')
wb.save('transactions1.xlsx')
如果要处理成千的表格,就需要去定义一个模块和函数
#xmlcl.py
#别名
import openpyxl as xl
from openpyxl.chart import BarChart,Reference
#加载对象
def con_f(filename):
    wb = xl.load_workbook(filename)
    sheet = wb['Sheet1']    #excel中的下面的Sheet1
    # print(cell.value)
    # print(sheet.max_row)
    for row in range(2,sheet.max_row + 1):
        # print(row)
        cell = sheet.cell(row,3)
        # print(cell.value)
        cor_price = cell.value * 8
        cor_price_call = sheet.cell(row,4)
        cor_price_call.value = cor_price

    values = Reference(sheet,min_row=2,
              max_row=sheet.max_row,
              min_col=3,
              max_col=3)

    chart = BarChart()
    chart.add_data(values)
    sheet.add_chart(chart,'a5')
    wb.save(filename)
#2.py
from xmlcl import con_f
con_f('transactions.xlsx')
