ELK技术栈(二)
2020/4/14
一、通过rsyslog收集haproxy日志
在centos6及之前的版本叫做syslog,centos7开始叫做rsyslog,根据官方的介绍,rsyslog(2013年版本)可以带到每秒转发百万条日志的级别,官方网址:http://www.rsyslog.com/,确认系统安装版本命令如下:
[root@study62 ~]# yum list syslog
Installed Packages
rsyslog.x86_64                    8.24.0-34.el7                         @anaconda
1.1.1 编译安装haproxy(study63)
1.1.1.1 编译安装
[root@study62 ~]# cd /opt/src/
[root@study62 src]# ls | grep haproxy
haproxy-2.0.14.tar.gz
# 安装依赖包
[root@study62 src]# tar xf haproxy-2.0.14.tar.gz
[root@study62 src]# cd haproxy-2.0.14/
[root@study62 haproxy-2.0.14]# yum install gcc pcre pcre-devel openssl openssl-devel -y
# make安装
[root@study62 haproxy-2.0.14]# make TARGET=linux-glibc USE_PCRE=1 USE_OPENSSL=1 USE_ZLIB=1 ARCH=x86_64 PREFIX=/usr/local/haproxy
[root@study62 haproxy-2.0.14]# make install PREFIX=/usr/local/haproxy
# 确认版本
[root@study62 haproxy-2.0.14]# /usr/local/haproxy/sbin/haproxy -v
HA-Proxy version 2.0.14 2020/04/02 - https://haproxy.org/
1.1.1.2 准备启动脚本
[root@study62 haproxy-2.0.14]# cp examples/haproxy.init /etc/init.d/haproxy
[root@study62 haproxy-2.0.14]# chmod 0755 /etc/init.d/haproxy
1.1.1.3 准备配置文件
[root@study62 haproxy-2.0.14]# mkdir /etc/haproxy
[root@study62 haproxy-2.0.14]# vim /etc/haproxy/haproxy.cfg
global
maxconn 100000
chroot /usr/local/haproxy
uid 99
gid 99
daemon
nbproc 1
pidfile /usr/local/haproxy/run/haproxy.pid
log 127.0.0.1 local6 info

defaults
option http-keep-alive
option  forwardfor
maxconn 100000
mode http
timeout connect 300000ms
timeout client  300000ms
timeout server  300000ms

listen stats
 mode http
 bind 0.0.0.0:9999
 stats enable
 log global
 stats uri     /haproxy-status
 stats auth    haadmin:123456

#frontend web_port
frontend web_port
        bind 0.0.0.0:80
        mode http
        option httplog
        log global
        option  forwardfor
###################ACL Setting##########################
        acl pc          hdr_dom(host) -i www.elk.com
        acl mobile      hdr_dom(host) -i m.elk.com
###################USE ACL##############################
        use_backend     pc_host        if  pc
        use_backend     mobile_host    if  mobile
########################################################

backend pc_host
        mode    http
        option  httplog
        balance source
        server web1  10.0.0.62:80 check inter 2000 rise 3 fall 2 weight 1

backend mobile_host
        mode    http
        option  httplog
        balance source
        server web1  10.0.0.62:80 check inter 2000 rise 3 fall 2 weight 1
1.1.1.4 启动服务
[root@study63 ~]# systemctl daemon-reload
[root@study63 ~]# systemctl start haproxy
[root@study62 haproxy-2.0.14]# lsof -i:80
浏览器访问http://10.0.0.63:9999/haproxy-status查看haproxy监控页面
1.1.2 编辑rsyslog服务配置文件
14 # Provides UDP syslog reception
15 $ModLoad imudp
16 $UDPServerRun 514
17
18 # Provides TCP syslog reception
19 $ModLoad imtcp
20 $InputTCPServerRun 514
# 在配置文件最下边添加配置
#local6.*       /var/log/haproxy.log # 添加到本地
# 添加到logstash
local6.*     @@10.0.0.62:5160 # 指定给Logstash
[root@study63 ~]# systemctl restart haproxy.service
[root@study63 ~]# systemctl restart rsyslog.service
1.1.3 配置rsyslog记录haproxy日志
1.1.3.1 测试配置
[root@study62 ~]# vim /etc/logstash/conf.d/rsyslog.conf

input {
  syslog {
    type => "haproxy063"
    port => "5160"
  }
}

output {
  stdout { codec => "rubydebug"
  }
}
[root@study62 ~]# /usr/share/logstash/bin/logstash -f /etc/logstash/conf.d/rsyslog.conf -t
1.1.3.2 通过logstash将haproxy日志打入es中
[root@study62 ~]# vim /etc/logstash/conf.d/rsyslog.conf
input {
  syslog {
    type => "rsyslog-haproxy063"
    port => "5160"
  }
}

output {
  if [type] == "rsyslog-haproxy063" {
    elasticsearch {
      hosts => ["10.0.0.62:9200"]
      index => "logstash-rsyslog-haproxy063-%{+YYYY.MM.dd}"
  }}
}

[root@study62 ~]# /usr/share/logstash/bin/logstash -f /etc/logstash/conf.d/rsyslog.conf -t
[root@study62 ~]# systemctl restart logstash.service
二、日志写入redis及读取redis
用一台服务器按照部署redis服务,专门用于日志缓存使用,用于web服务器产生大量日志的场景,例如下面的服务器内存即将被使用完毕,查看是因为redis服务保存了大量的数据没有被读取而占用了大量的内存空间。


2.1.1 部署redis
[root@study63 src]# tar xf redis-5.0.8.tar.gz
[root@study63 src]# cd redis-5.0.8/
[root@study63 redis-5.0.8]# ls
00-RELEASENOTES  COPYING  Makefile   redis.conf       runtest-moduleapi  src
BUGS             deps     MANIFESTO  runtest          runtest-sentinel   tests
CONTRIBUTING     INSTALL  README.md  runtest-cluster  sentinel.conf      utils
[root@study63 redis-5.0.8]# make -j2
[root@study63 redis-5.0.8]# ln -sv /opt/src/redis-5.0.8 /opt/redis
[root@study63 redis-5.0.8]# cd /opt/redis/
修改配置
69 bind 10.0.0.63
136 daemonize yes
216 save ""
217
218 #save 900 1
219 #save 300 10
220 #save 60 10000
507 requirepass 123456
启动服务
[root@study63 redis]# cp src/redis-server /usr/bin
[root@study63 redis]# cp src/redis-cli /usr/bin
[root@study63 redis]# redis-server /opt/redis/redis.conf
验证
[root@study63 opt]# redis-cli -h 10.0.0.63
10.0.0.63:6379> KEYS *
(error) NOAUTH Authentication required.
10.0.0.63:6379> AUTH 123456
OK
10.0.0.63:6379> KEYS *
(empty list or set)
2.1.2 配置logstash将日志写入redis
[root@study62 ~]# vim /etc/logstash/conf.d/rsyslog.conf

input {
  syslog {
    type => "rsyslog-haproxy063"
    port => "5160"
  }
}

output {
  if [type] == "rsyslog-haproxy063" {
    redis {
      data_type => "list"
      host => "10.0.0.63"
      db => "1"
      port => "6379"
      key => "rsyslog-haproxy063"
      password => "123456"
  }}
}
2.1.3 检测配置语法
[root@study62 ~]# /usr/share/logstash/bin/logstash -f /etc/logstash/conf.d/rsyslog.conf -t
WARNING: Could not find logstash.yml which is typically located in $LS_HOME/config or /etc/logstash. You can specify the path using --path.settings. Continuing using the defaults
Could not find log4j2 configuration at path /usr/share/logstash/config/log4j2.properties. Using default config which logs to console
Configuration OK
11:01:36.649 [LogStash::Runner] INFO  logstash.runner - Using config.test_and_exit mode. Config Validation Result: OK. Exiting Logstash

[root@study62 ~]# systemctl restart logstash.service
2.1.4 登录redis中查看
[root@study63 opt]# redis-cli -h 10.0.0.63 -a 123456
Warning: Using a password with '-a' or '-u' option on the command line interface may not be safe.
10.0.0.63:6379> SELECT 1
10.0.0.63:6379[1]> keys *
1) "rsyslog-haproxy063"
10.0.0.63:6379[1]> LLEN rsyslog-haproxy063 # 查看key的长度
(integer) 12
10.0.0.63:6379[1]> LPOP rsyslog-haproxy063 #展示一条记录会减少一条
"{\"severity\":6,\"pid\":\"14556\",\"program\":\"haproxy\",\"message\":\"Connect from 10.0.0.1:52144 to 10.0.0.63:9999 (stats/HTTP)\\n\",\"type\":\"rsyslog-haproxy063\",\"priority\":182,\"logsource\":\"localhost\",\"@timestamp\":\"2020-04-15T03:09:00.000Z\",\"@version\":\"1\",\"host\":\"10.0.0.63\",\"facility\":22,\"severity_label\":\"Informational\",\"timestamp\":\"Apr 15 11:09:00\",\"facility_label\":\"local6\"}"
10.0.0.63:6379[1]> LLEN rsyslog-haproxy063
(integer) 11
2.2.5 配置logstash从reids中取出数据到elasticsearch
2.2.5.1 使用study63上的logstash从redis取数据
[root@study63 ~]# vim /etc/logstash/conf.d/redis-es.conf
input {
  redis {
    data_type => "list"
    host => "10.0.0.63"
    db => "1"
    port => "6379"
    key => "rsyslog-haproxy063"
    password => "123456"
  }
}


output {
  elasticsearch {
    hosts => ["10.0.0.63:9200"]
    index => "redis-rsyslog-haproxy063-%{+YYYY.MM.dd}"
  }
}
[root@study63 ~]# /usr/share/logstash/bin/logstash -f /etc/logstash/conf.d/redis-es.conf -t
[root@study63 ~]# systemctl restart logstash.service
2.2.5.2 从study63上写入数据查看
[root@study63 opt]# redis-cli -h 10.0.0.63 -a 123456
Warning: Using a password with '-a' or '-u' option on the command line interface may not be safe.
10.0.0.63:6379> SELECT 1
10.0.0.63:6379[1]> keys *
10.0.0.63:6379[1]> LLEN rsyslog-haproxy063
(integer) 11
10.0.0.63:6379[1]> LLEN rsyslog-haproxy063
(integer) 0
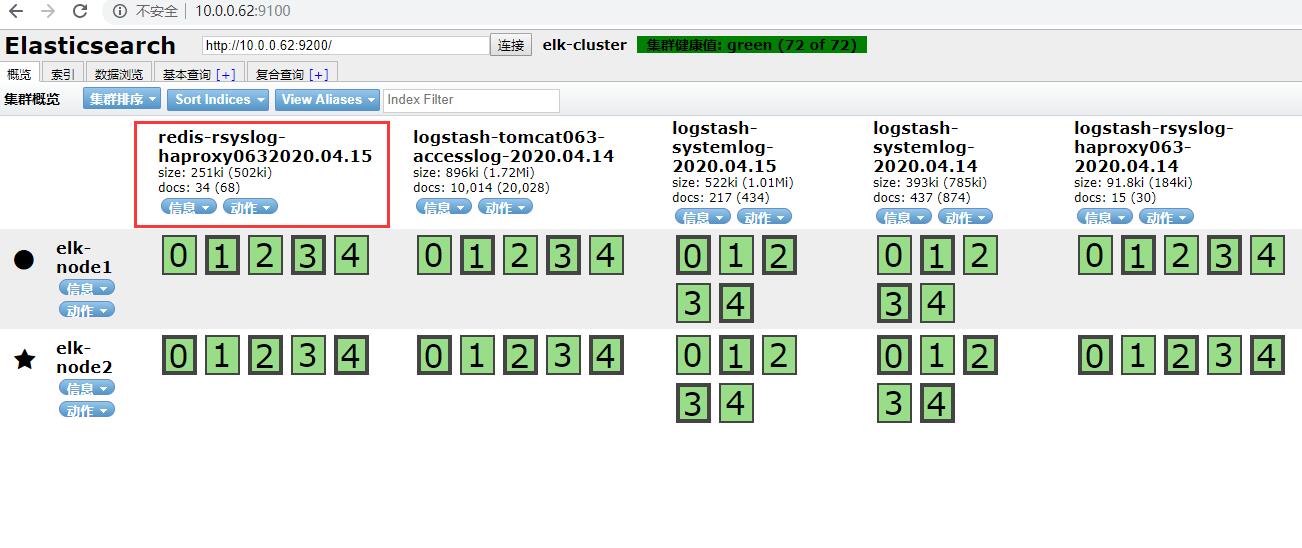
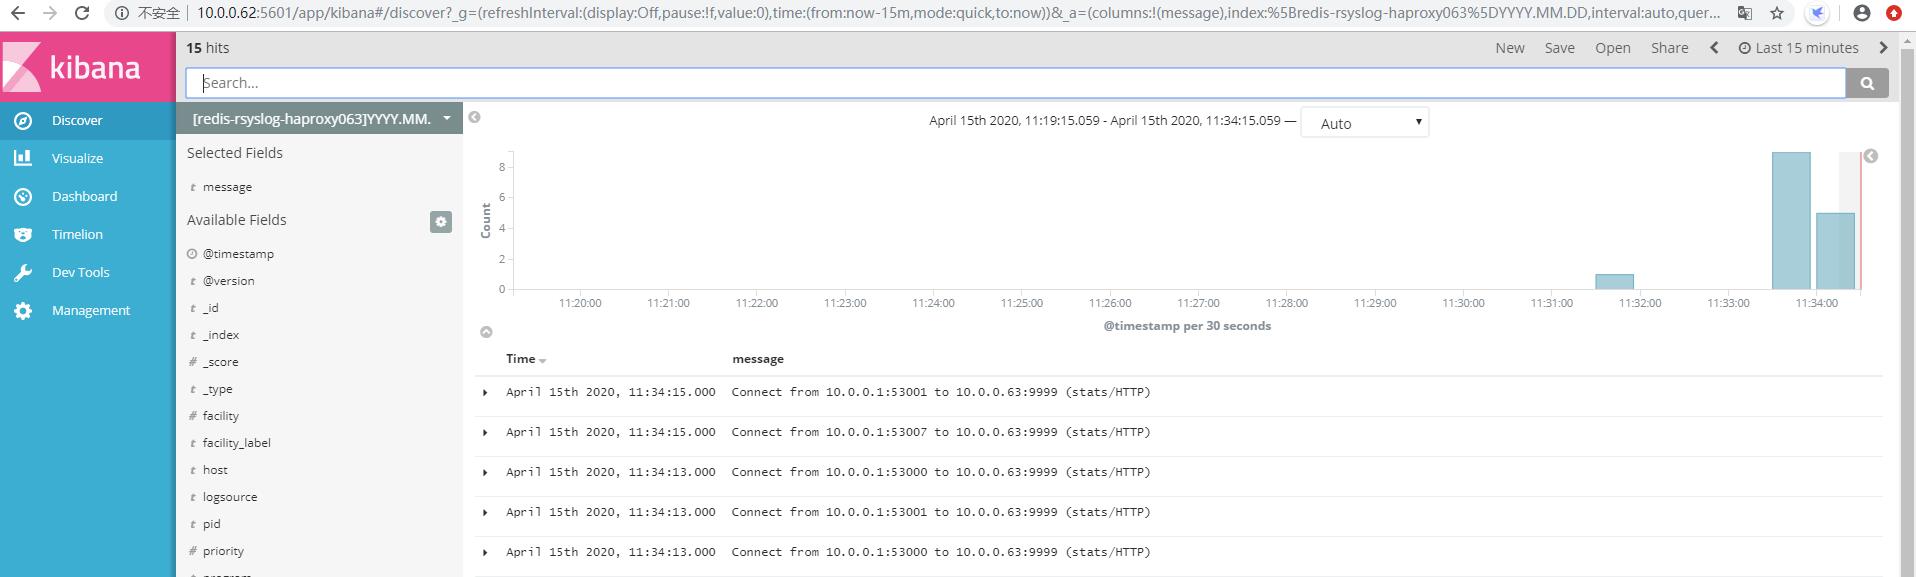
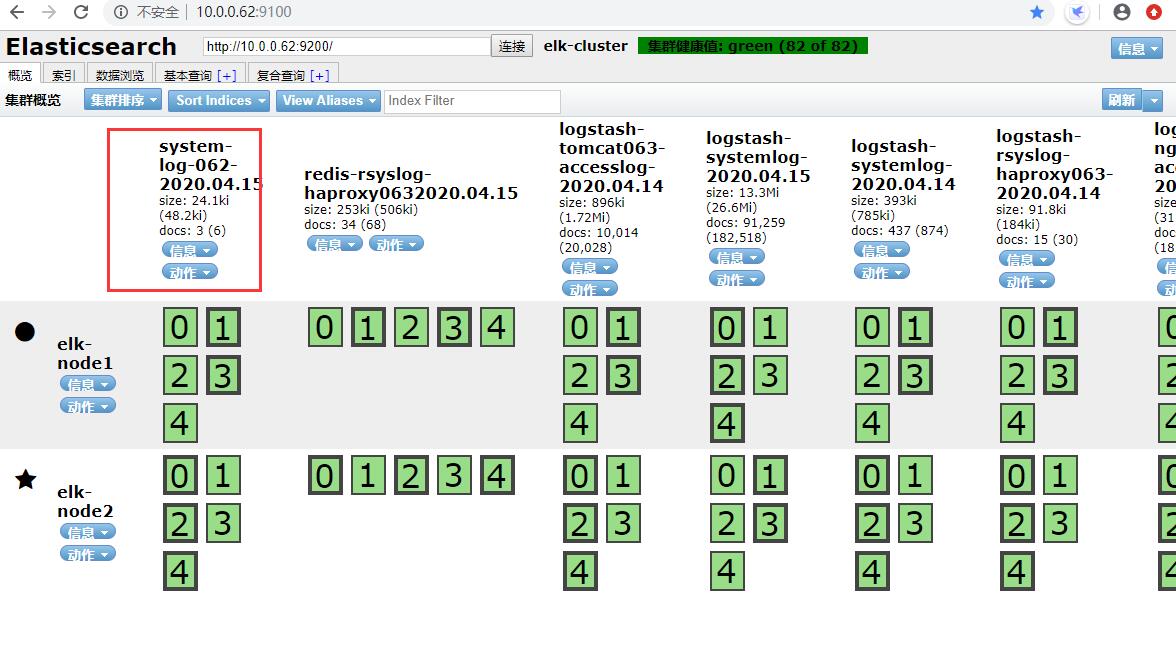
2.2.5.3 head插件和Kibana添加索引查看


三、filebeat-redis-logstash-es
为什么使用 Filebeat
Logstash 是一个 Java 程序,当作为收集日志的 Agent 时,显得太臃肿了。
之前听过一个公司(斗鱼)使用 Logstash 作为日志收集 Agent 时,资源占用好像比业务进程占用还多! 这时我们需要一个轻量级的日志收集 Agent,上面说的那家公司的处理方法是自己写了一个 Agent。
其实我们可以先看看官方是否提供相关的 Agent,现在我的需求是收集特定的日志文件, 官方提供了这样的工具:Filebeat,官方给 Filebeat 的定义就是轻量级的日志收集工具。
Filebeat 是基于原先 logstash-forwarder 的源码改造出来的。
换句话说:Filebeat 就是新版的 logstash-forwarder,也会是 ELK Stack 在 shipper 端的第一选择。
3.1 安装Filebeat
3.1.1 准备条件
ELK 环境应该部署好,这在之前的文章已经配置过了
3.1.2 安装Filebeat
下载并安装Filebeat软件白
[root@study62 src]# ll | grep filebeat
-rw-r--r--  1 root root   9159159 Apr 15 14:56 filebeat-5.4.0-x86_64.rpm
[root@study62 src]# yum install filebeat-5.4.0-x86_64.rpm -y
3.2 配置Filebeat
3.2.1 输出到文件
# 本例参数为输出到文件
[root@study62 src]# grep -v "#" /etc/filebeat/filebeat.yml | grep -v "^$"
filebeat.prospectors:
- input_type: log
  paths:
    - /var/log/*.log
    - /var/log/messages
  exclude_lines: ["^DBG","^$"]
  document_type: system-log-062
output.file:
  path: "/tmp"
  filename: filebeat.txt

[root@study62 src]# vim /var/log/messages
aaaaaaa
bbbbbbbbb
bbbbbbbbb
[root@study62 src]# systemctl restart filebeat

[root@study62 src]# tail /tmp/filebeat.txt
{"@timestamp":"2020-04-15T07:36:39.935Z","beat":{"hostname":"study62","name":"study62","version":"5.4.0"},"input_type":"log","message":"aaaaaaa","offset":5409247,"source":"/var/log/messages","type":"system-log-062"}
  @timestamp":"2020-04-15T07:36:39.935Z","beat":{"hostname":"study62","name":"study62","version":"5.4.0"},"input_type":"log","message":"bbbbbbbbb","offset":5409257,"source":"/var/log/messages","type":"system-log-062"}
{"@timestamp":"2020-04-15T07:36:39.935Z","beat":{"hostname":"study62","name":"study62","version":"5.4.0"},"input_type":"log","message":"bbbbbbbbb","offset":5409267,"source":"/var/log/messages","type":"system-log-062"}

[root@study62 src]# echo "test" >> /var/log/messages
[root@study62 src]# tail /tmp/filebeat.txt
{"@timestamp":"2020-04-15T07:39:34.950Z","beat":{"hostname":"study62","name":"study62","version":"5.4.0"},"input_type":"log","message":"test","offset":5409332,"source":"/var/log/messages","type":"system-log-062"}
3.2.2 输出到redis
# 添加输出到redis的配置
#----------------------------- File output --------------------------------
output.redis:
  hosts: ["10.0.0.63"]
  db: 3
  port: 6379
  key: system-log-062
  password: 123456
  datatype: list

[root@study62 src]# systemctl restart filebeat.service
[root@study62 src]# echo "test to redis" >> /var/log/messages
[root@study62 src]# echo "test1 to redis" >> /var/log/messages                   [root@study62 src]# echo "test2 to redis" >> /var/log/messages
# redis中验证key
10.0.0.63:6379[1]> SELECT 3
OK
10.0.0.63:6379[3]> KEYS *
1) "system-log-062"
10.0.0.63:6379[3]> LLEN system-log-062
(integer) 3
3.2.3 通过Logstash将redis中的日志信息导入ES中
[root@study62 src]# vim /etc/logstash/conf.d/rsyslog.conf
input {
  redis {
      data_type => "list"
      host => "10.0.0.63"
      db => "3"
      port => "6379"
      key => "system-log-062"
      password => "123456"
  }

  syslog {
    type => "rsyslog-haproxy063"
    port => "5160"
  }
}

output {
  if [type] == "rsyslog-haproxy063" {
    redis {
      data_type => "list"
      host => "10.0.0.63"
      db => "1"
      port => "6379"
      key => "rsyslog-haproxy063"
      password => "123456"
  }}
  if [type] == "system-log-062"{
    elasticsearch {
      hosts => ["10.0.0.62:9200"]
      index => "system-log-062-%{+YYYY.MM.dd}"
  }}
}

[root@study62 src]# systemctl restart logstash
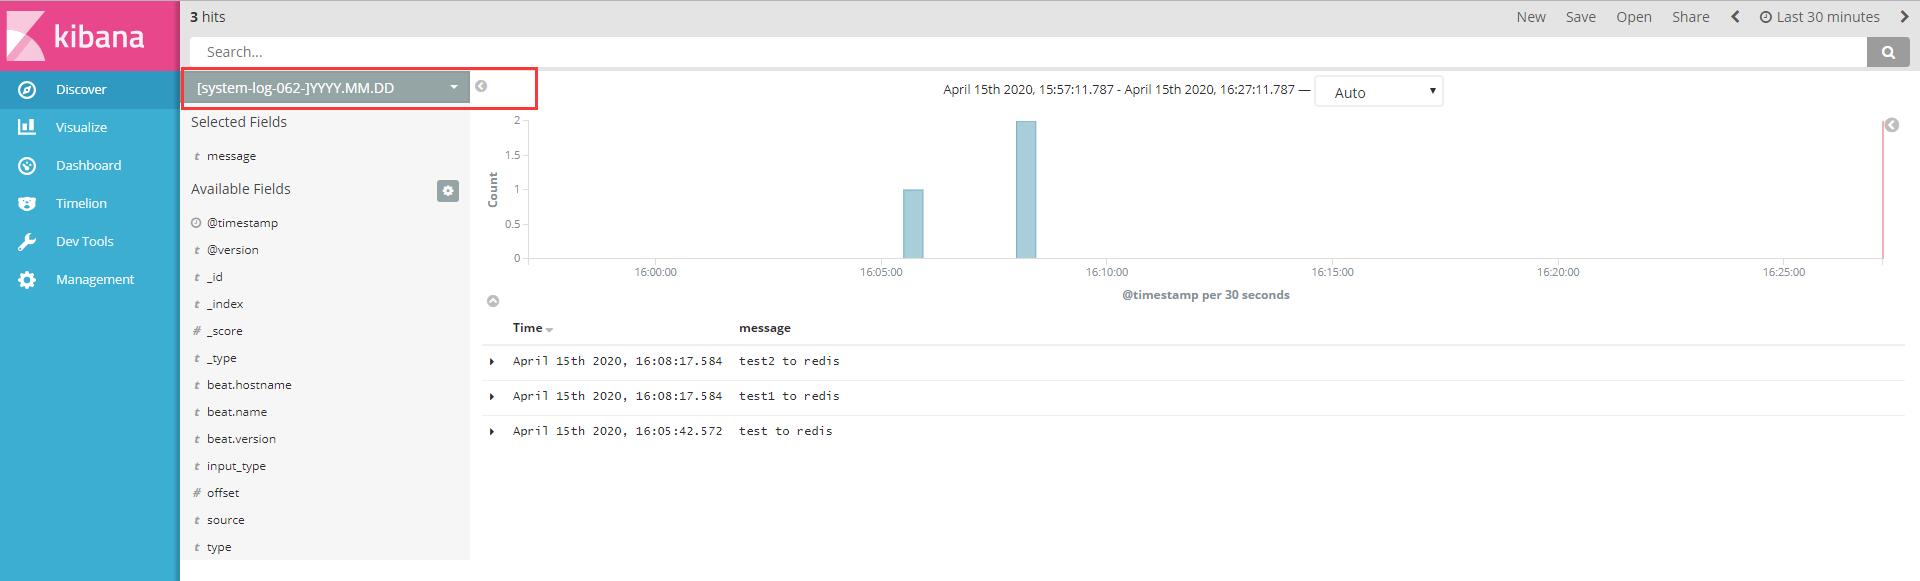
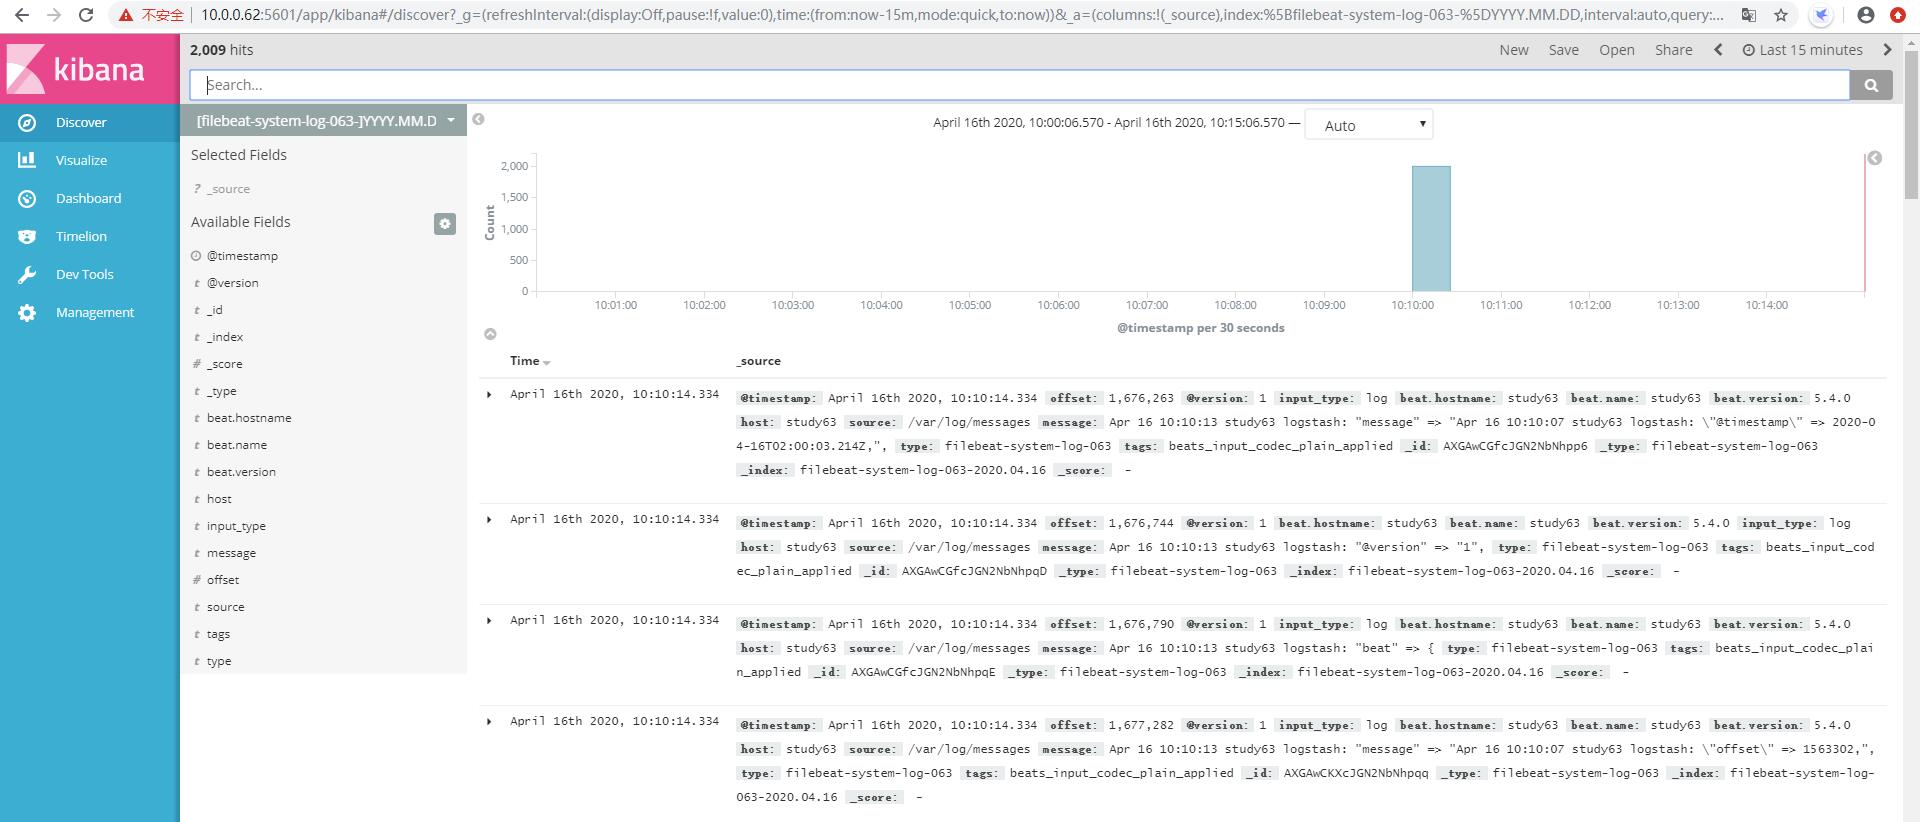
3.2.4 head插件和Kibana添加索引查看


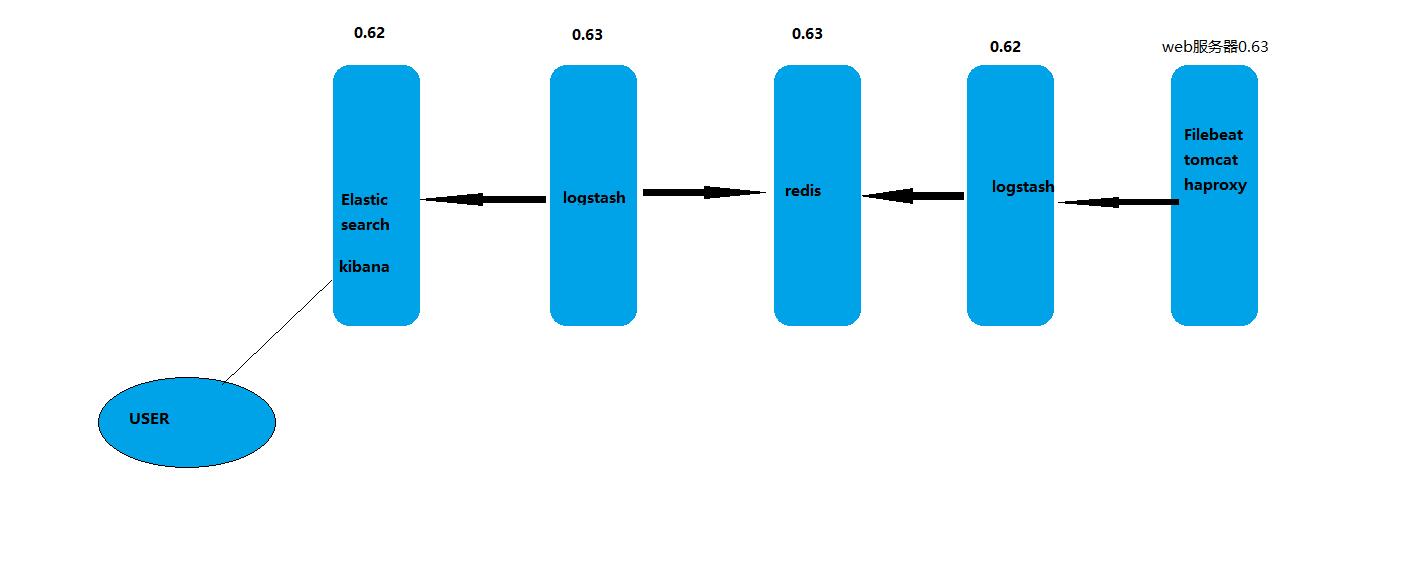
四、日志流程回顾及监控redis队列长度
[root@study63 src]# grep -v "#" /etc/filebeat/filebeat.yml | grep -v "^$"
filebeat.prospectors:
- input_type: log
  paths:
    - /var/log/*.log
    - /var/log/messages
  exclude_lines: ["^DBG","^$"]
  document_type: filebeat-system-log-063

output.redis:
  hosts: ["10.0.0.63"]
  db: 3
  port: 6379
  key: filebeat-system-log-063
  password: 123456
  datatype: list
[root@study63 src]# vim /etc/logstash/conf.d/redis-es.conf
input {
  redis {
    data_type => "list"
    host => "10.0.0.63"
    db => "3"
    port => "6379"
    key => "filebeat-system-log-063"
    password => "123456"
  }
}


output {
  elasticsearch {
    hosts => ["10.0.0.62:9200"]
    index => "filebeat-system-log-062-%{+YYYY.MM.dd}"
  }
}
监控redis队列长度
安装Python的redis模块
[root@study62 opt]# yum install python-pip -y
[root@study62 opt]# pip install --upgrade pip
[root@study62 opt]# pip install redis
编辑监控redis队列长度脚本
[root@study62 python-script]# vim redis-test.py
#!/usr/bin/env python
#ending:utf-8
import redis
def redis_conn():
    pool = redis.ConnectionPool(host="10.0.0.63",port=6379,db=3,password=123456)
    conn = redis.Redis(connection_pool=pool)
    data = conn.llen("filebeat-system-log-063")
    print(data)

redis_conn()
测试与验证脚本
[root@study62 python-script]# systemctl stop logstash.service
[root@study62 python-script]#  echo "test-llen to redis" >> /var/log/messages
 10.0.0.63:6379[3]> LLEN system-log-062
(integer) 1
然后可以通过zabbix调用这个脚本监控队列长度设置阀值报警

五、filebeat单类型日志通过logstash写入redis

filebeat.yaml

output.logstash:
  hosts: ["10.0.0.0.62:5044"] # logstash服务器地址,可以是多个,多个可以进行负载
  enabled:true #是否开启输出至logstash,默认为true
  worker: 1 # 工作线程数
  compression_level: 3 # 压缩级别
  #loadbalance: true #多个输出的时候开启负载
logstash/conf.d/beats.conf

input {
  beats {
    port => 5044
  }

}

output {
  stdout {
    codec => rubydebug
  }
}
测试验证
[root@study62 ~]# echo "5044" >> /var/log/messages

[root@study62 ~]# /usr/share/logstash/bin/logstash -f /etc/logstash/conf.d/beats.conf
{
    "@timestamp" => 2020-04-16T00:49:41.699Z,
        "offset" => 5409524,
      "@version" => "1",
    "input_type" => "log",
          "beat" => {
        "hostname" => "study62",
            "name" => "study62",
         "version" => "5.4.0"
    },
          "host" => "study62",
        "source" => "/var/log/messages",
       "message" => "5044",
          "type" => "system-log-062",
          "tags" => [
        [0] "beats_input_codec_plain_applied"
    ]
}
5.1 完整案例配置
5.1.2 filebeat配置
[root@study63 ~]# grep -v "#" /etc/filebeat/filebeat.yml | grep -v "^$"
filebeat.prospectors:
- input_type: log
  paths:
    - /var/log/messages
    - /var/log/*.log
  exclude_lines: ["^DBG","^$"]
  document_type: filebeat-system-log-063
output.logstash:
  hosts: ["10.0.0.62:5044"]
  enabled: 1
  worker: 1
  compression_level: 3
5.1.2 study62主机logstash配置
[root@study62 ~]# vim /etc/logstash/conf.d/beats.conf
input {
  beats {
    port => 5044
  }

}

output {
  if [type] == "filebeat-system-log-063" {
    redis {
      data_type => "list"
      host => "10.0.0.63"
      db => "3"
      port => "6379"
      key => "filebeat-system-log-063"
      password => "123456"
  }}
}

[root@study62 ~]# /usr/share/logstash/bin/logstash -f /etc/logstash/conf.d/beats.conf
[root@study63 ~]# echo "testing" >> /var/log/messages
10.0.0.63:6379[3]> KEYS *
1) "filebeat-system-log-063-2020.04.16"
10.0.0.63:6379[3]> LLEN filebeat-system-log-063-2020.04.16
(integer) 7
[root@study62 ~]# systemctl restart logstash.service
5.1.3 study63主机logstash配置
[root@study63 ~]# vim /etc/logstash/conf.d/redis-es.conf

input {
  redis {
    data_type => "list"
    host => "10.0.0.63"
    db => "3"
    port => "6379"
    key => "filebeat-system-log-063"
    password => "123456"
  }
}


output {
  if [type] == "filebeat-system-log-063" {
  elasticsearch {
    hosts => ["10.0.0.62:9200"]
    index => "filebeat-system-log-063-%{+YYYY.MM.dd}"
  }}
}
[root@study63 ~]# systemctl restart logstash.service
10.0.0.63:6379[3]> LLEN filebeat-system-log-063
(integer) 12
10.0.0.63:6379[3]> LLEN filebeat-system-log-063
(integer) 0
5.1.4 head插件和Kibana添加索引查看


六、filebeat收集多类型日志文件
6.1 配置filebeat
[root@study63 ~]# grep -v "#" /etc/filebeat/filebeat.yml | grep -v "^$"
filebeat.prospectors:
- input_type: log
  paths:
    - /var/log/messages
    - /var/log/*.log
  exclude_lines: ["^DBG","^$"]
  document_type: filebeat-system-log-063
- input_type: log
  paths:
    - /opt/tomcat/logs/tomcat_access_log.*.log
  document_type: tomcat-accesslog-063
output.logstash:
  hosts: ["10.0.0.62:5044"]
  enabled: true
  worker: 2
  compression_level: 3
6.2 配置filebeat-logstash-redis
[root@study62 ~]# cat /etc/logstash/conf.d/beats.conf
input {
  beats {
    port => 5044
  }

}

output {
  if [type] == "filebeat-system-log-063" {
    redis {
      data_type => "list"
      host => "10.0.0.63"
      db => "3"
      port => "6379"
      key => "filebeat-system-log-063"
      password => "123456"
  }}
  if [type] == "tomcat-accesslog-063" {
    redis {
      data_type => "list"
      host => "10.0.0.63"
      db => "3"
      port => "6379"
      key => "tomcat-accesslog-063"
      password => "123456"
  }}
}
[root@study62 ~]# /usr/share/logstash/bin/logstash -f /etc/logstash/conf.d/beats.conf -t
6.3 配置redis-logstash-es
[root@study63 ~]# cat /etc/logstash/conf.d/redis-es.conf
input {
  redis {
    data_type => "list"
    host => "10.0.0.63"
    db => "3"
    port => "6379"
    key => "filebeat-system-log-063"
    password => "123456"
  }
}

input {
  redis {
    data_type => "list"
    host => "10.0.0.63"
    db => "3"
    port => "6379"
    key => "tomcat-accesslog-063"
  }
}


output {
  if [type] == "filebeat-system-log-063" {
  elasticsearch {
    hosts => ["10.0.0.62:9200"]
    index => "filebeat-system-log-063-%{+YYYY.MM.dd}"
  }}
  if [type] == "tomcat-accesslog-063" {
  elasticsearch {
    hosts => ["10.0.0.62:9200"]
    index => "tomcat-accesslog-063-%{+YYYY.MM.dd}"
  }}
}
[root@study63 ~]# /usr/share/logstash/bin/logstash -f /etc/logstash/conf.d/redis-es.conf -t
[root@study63 ~]# systemctl start logstash.service
6.4 查看redis队列长度变化
10.0.0.63:6379[3]> LLEN tomcat-accesslog-063
(integer) 40799
10.0.0.63:6379[3]> LLEN tomcat-accesslog-063
(integer) 5424
10.0.0.63:6379[3]> LLEN tomcat-accesslog-063
(integer) 5174
10.0.0.63:6379[3]> LLEN tomcat-accesslog-063
(integer) 4424
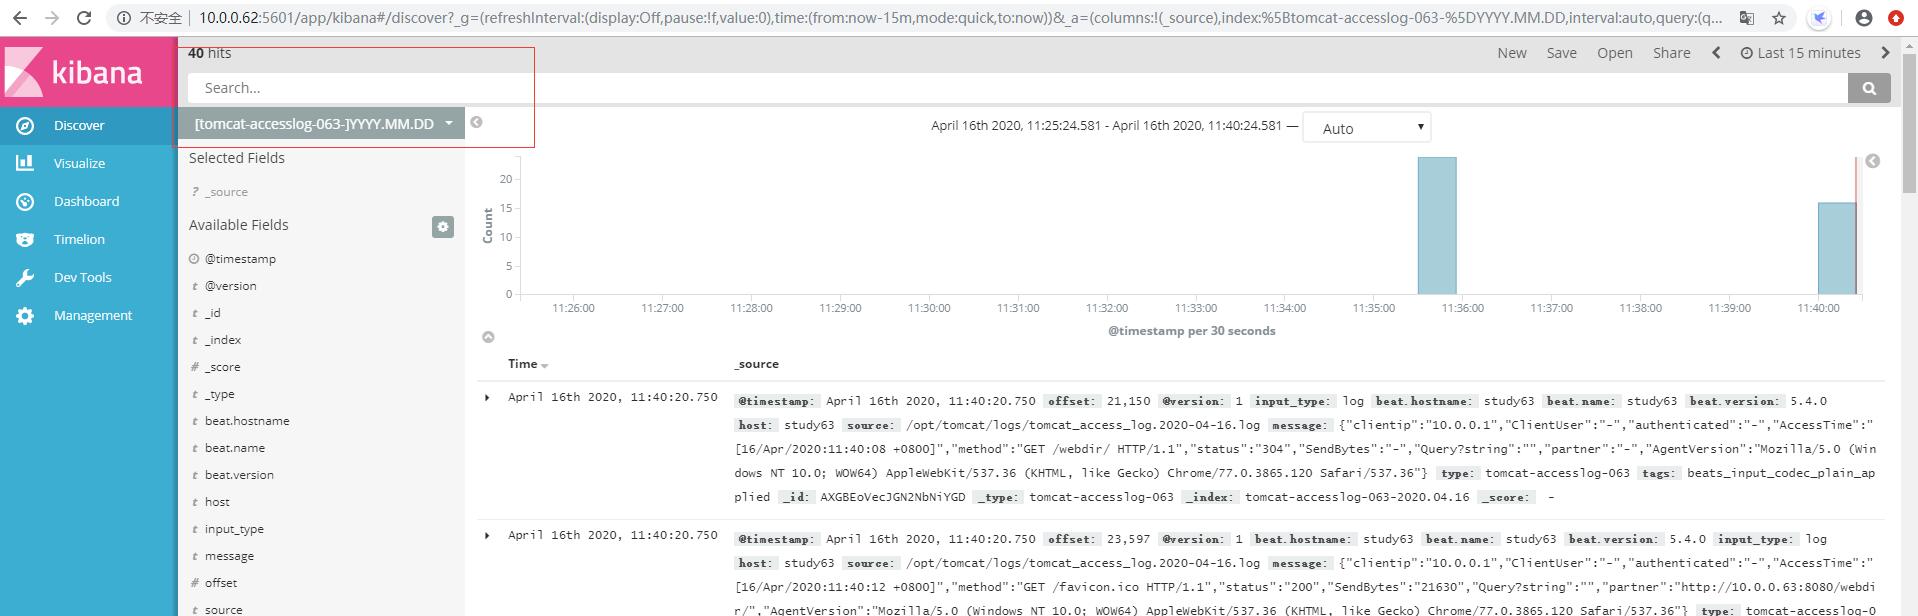
6.5 head插件和Kibana添加索引查看


七、haproxy和nginx代理
7.1 安装并配置haproxy
安装操作参照上文中的方法
global
maxconn 100000
chroot /usr/local/haproxy
uid 99
gid 99
daemon
nbproc 1
pidfile /usr/local/haproxy/run/haproxy.pid
log 127.0.0.1 local6 info

defaults
option http-keep-alive
option  forwardfor
maxconn 100000
mode http
timeout connect 300000ms
timeout client  300000ms
timeout server  300000ms

listen stats
 mode http
 bind 0.0.0.0:9999
 stats enable
 log global
 stats uri     /haproxy-status
 stats auth    haadmin:123456

#frontend web_port
frontend web_port
        bind 0.0.0.0:80
        mode http
        option httplog
        log global
        option  forwardfor
###################ACL Setting##########################
        acl pc          hdr_dom(host) -i www.elk.com
        acl mobile      hdr_dom(host) -i m.elk.com
        acl kibana        hdr_dom(host) -i www.kibana063.com
###################USE ACL##############################
        use_backend     pc_host        if  pc
        use_backend     mobile_host    if  mobile
        use_backend     kibana_host    if  kibana
########################################################

backend pc_host
        mode    http
        option  httplog
        balance source
        server web1  10.0.0.62:8080 check inter 2000 rise 3 fall 2 weight 1

backend mobile_host
        mode    http
        option  httplog
        balance source
        server web1  10.0.0.62:8080 check inter 2000 rise 3 fall 2 weight 1

backend kibana_host
        mode    http
        option  httplog
        balance source
        server web1  10.0.0.62:5601 check inter 2000 rise 3 fall 2 weight 1
        server web2  10.0.0.63:5601 check inter 2000 rise 3 fall 2 weight 1
7.2 study63主机安装并配置kibana
[root@study63 src]# yum install kibana-5.4.0-x86_64.rpm -y
[root@study63 src]# grep "^[a-Z]" /etc/kibana/kibana.yml
server.port: 5601
server.host: "10.0.0.63"
elasticsearch.url: "http://10.0.0.63:9200"

[root@study63 src]# systemctl start kibana
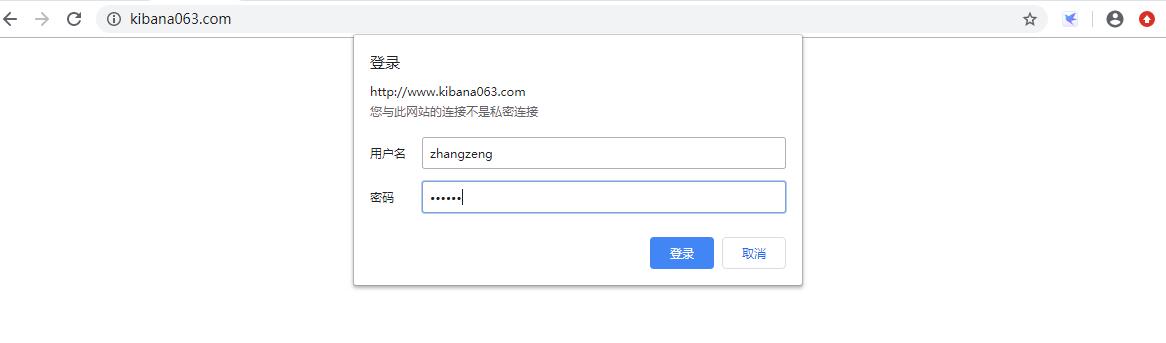
7.3 访问测试
7.4 配置nginx验证登录kibana
[root@study62 conf.d]# vim /etc/nginx/conf.d/elk.conf
upstream elkserver {
        server  10.0.0.62:5601 weight=1 max_fails=3  fail_timeout=60;
        server  10.0.0.63:5601 weight=1 max_fails=3  fail_timeout=60;
}

server {
        listen 80;
        server_name study62;  #当前主机名
        auth_basic "Restricted Access";
        auth_basic_user_file /etc/nginx/conf.d/htpasswd.users;  #登录认证
        location / {
        proxy_pass http://elkserver; #kibana端口
        proxy_http_version 1.1;
        proxy_set_header Upgrade $http_upgrade;
        proxy_set_header Connection 'upgrade';
        proxy_set_header Host $host;
        proxy_cache_bypass $http_upgrade;
        }
}

[root@study62 conf.d]# yum install httpd-tools -y
[root@study62 conf.d]# htpasswd -bc /etc/nginx/conf.d/htpasswd.users zhangzeng 123456
Adding password for user zhangzeng

[root@study62 conf.d]# chown nginx:nginx /etc/nginx/conf.d/htpasswd.users
[root@study62 conf.d]# chmod 600 /etc/nginx/conf.d/htpasswd.users
7.5 关闭一台elasticsearch服务器的kibana,测试web界面能否正常访问
[root@study62 conf.d]# systemctl stop kibana

八、写入数据库前期准备
8.1安装并配置数据库
[root@study63 ~]# yum install mariadb mariadb-server -y
[root@study63 ~]# mkdir /data/mysql
[root@study63 ~]# chown -R mysql:mysql /data/mysql
[root@study63 ~]# vim /etc/my.cnf
[mysqld]
datadir=/data/mysql
socket=/var/lib/mysql/mysql.sock
# Disabling symbolic-links is recommended to prevent assorted security risks
symbolic-links=0
# Settings user and group are ignored when systemd is used.
# If you need to run mysqld under a different user or group,
# customize your systemd unit file for mariadb according to the
# instructions in http://fedoraproject.org/wiki/Systemd

[mysqld_safe]
log-error=/var/log/mariadb/mariadb.log
pid-file=/var/run/mariadb/mariadb.pid

#
# include all files from the config directory
#
!includedir /etc/my.cnf.d

[root@study63 ~]# systemctl start mariadb
[root@study63 ~]# ss -tnl | grep 3306
LISTEN     0      50           *:3306                     *:*
8.2 数据库授权
[root@study63 ~]# mysql
MariaDB [(none)]> grant all on *.* to root@"%" identified by "123456" with grant option;  # 设置root用户密码及有授权权限
Query OK, 0 rows affected (0.00 sec)
MariaDB [(none)]> create database elk character set utf8 collate utf8_bin;
Query OK, 1 row affected (0.00 sec)
MariaDB [(none)]> grant all privileges on elk.* to elk@"%" identified by '123456';
Query OK, 0 rows affected (0.00 sec)
MariaDB [(none)]> use mysql;
MariaDB [mysql]> delete from user where password=""; # 删除密码为空的用户
Query OK, 6 rows affected (0.00 sec)
MariaDB [mysql]> select host,user,password from user;
+------+------+-------------------------------------------+
| host | user | password                                  |
+------+------+-------------------------------------------+
| %    | root | *6BB4837EB74329105EE4568DDA7DC67ED2CA2AD9 |
| %    | elk  | *6BB4837EB74329105EE4568DDA7DC67ED2CA2AD9 |
+------+------+-------------------------------------------+
2 rows in set (0.00 sec)
MariaDB [mysql]> flush privileges;
Query OK, 0 rows affected (0.00 sec)
8.3 在Logstash服务器使用elk用户登录测试
[root@study63 ~]# mysql -uelk -h10.0.0.63 -p
Enter password:
MariaDB [(none)]> show databases;
+--------------------+
| Database           |
+--------------------+
| information_schema |
| elk                |
| test               |
+--------------------+
3 rows in set (0.00 sec)
8.4 logstash服务器安装配置jdbc插件
[root@study63 src]# mkdir -pv /usr/share/logstash/vendor/jar/jdbc
[root@study63 src]# ls mysql-connector-java-5.1.47.tar.gz
mysql-connector-java-5.1.47.tar.gz
[root@study63 src]# tar xf mysql-connector-java-5.1.47.tar.gz
[root@study63 src]# cp mysql-connector-java-5.1.47/mysql-connector-java-5.1.47-bin.jar /usr/share/logstash/vendor/jar/jdbc/
[root@study63 src]# chown -R logstash:logstash /usr/share/logstash/vendor/jar/
8.5 更改gem源

[root@study63 src]# yum install gem -y
[root@study63 src]# gem update --system #尽可能用比较新的 RubyGems 版本,建议 2.6.x 以上
[root@study63 src]# gem -v
2.7.7
[root@study63 src]# gem sources --add https://gems.ruby-china.com/ --remove https://rubygems.org/
[root@study63 src]# gem sources list
*** CURRENT SOURCES ***

https://gems.ruby-china.com/

[root@study63 ~]# vim /usr/share/logstash/Gemfile
source "https://gems.ruby-china.com"
8.5 安装配置插件
[root@study63 src]# /usr/share/logstash/bin/logstash-plugin list #当前安装的所有插件

[root@study63 ~]# /usr/share/logstash/bin/logstash-plugin install logstash-output-jdbc
Validating logstash-output-jdbc
Installing logstash-output-jdbc
Installation successful
8.6 连接数据库创建表
time的默认值设置为CURRENT_TIMESTAMP


8.7 配置logstash将匹配的日志写入MySQL
[root@study63 ~]# vim /etc/logstash/conf.d/redis-es.conf

input {
  redis {
    data_type => "list"
    host => "10.0.0.63"
    db => "3"
    port => "6379"
    key => "filebeat-system-log-063"
    password => "123456"
  }
}

input {
  redis {
    data_type => "list"
    host => "10.0.0.63"
    db => "3"
    port => "6379"
    key => "tomcat-accesslog-063"
    password => "123456"
  }
}


output {
  if [type] == "filebeat-system-log-063" {
  elasticsearch {
    hosts => ["10.0.0.62:9200"]
    index => "filebeat-system-log-063-%{+YYYY.MM.dd}"
  }}
  if [type] == "tomcat-accesslog-063" {
  elasticsearch {
    hosts => ["10.0.0.62:9200"]
    index => "tomcat-accesslog-063-%{+YYYY.MM.dd}"
  }}
  jdbc {
                connection_string => "jdbc:mysql://10.0.0.63/elk?user=elk&password=123456&useUnicode=true&characterEncoding=UTF8"
                statement => ["INSERT INTO elklog(host,status,clientip,AgentVersion) VALUES(?,?,?,?)", "host","status","clientip","AgentVersion"]
        }
}
2020/4/17