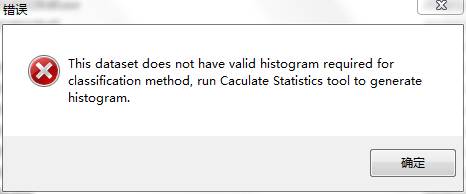
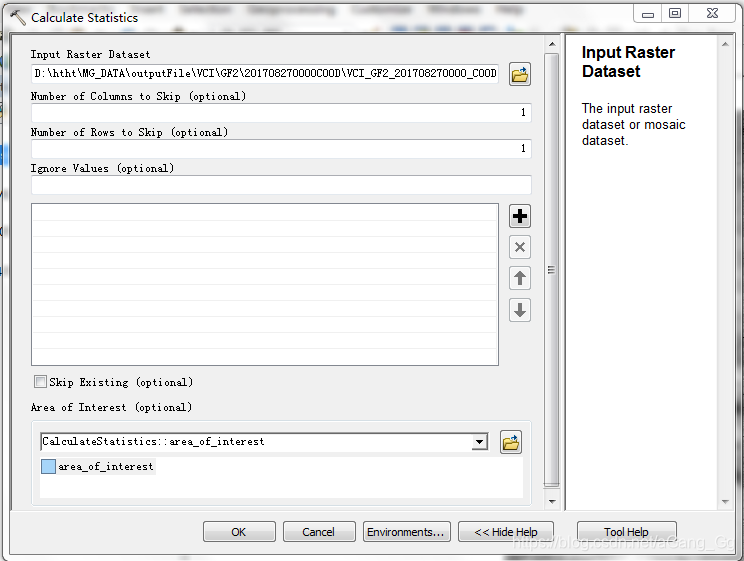
ArcMap栅格数据不能分类(Classified)时,利用工具Calculate Statistics解决。
工具
arcpy:
#!/usr/bin/python
# -*- coding: utf-8 -*-

# Calculate Statistics for single raster dataset

import arcpy
import numpy as np
from PIL import Image

traceback_template = '''Traceback (most recent call last):
  File "%(filename)s", line %(lineno)s, in %(name)s
%(type)s: %(message)s\n'''  # Skipping the "actual line" item

out_name='D:\\nmg_data_gf1\\mss_yu\\NDVI_GF1_PMS1_E109.8_N41.1_20180329.tif'
inBand = np.array(Image.open(out_name))  #��ȡӰ��Ϊ����
rows=inBand.shape[0]
cols=inBand.shape[1]
arcpy.CalculateStatistics_management(out_name, "1", "1")
print 'end'
