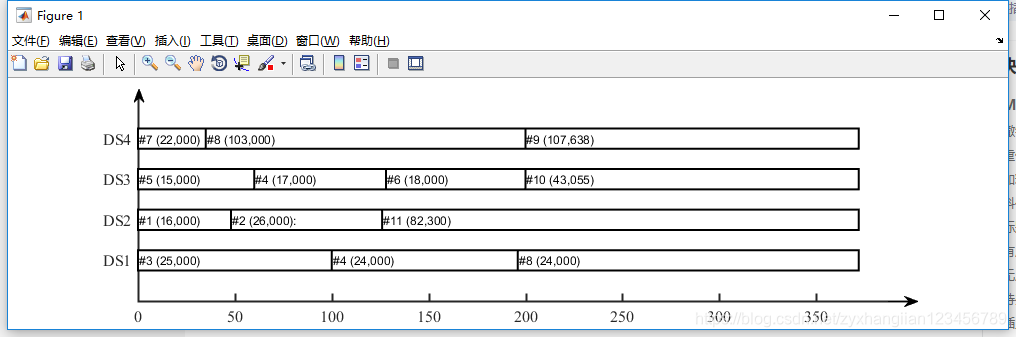
有时候我们需要绘制一些简单的甘特图,现有的软件都是比较复杂,并且不能满足我们的要求,因此,这里写一个简单的二维甘特图可视化实例,效果如下:
%机器 任务 时间1 时间2  属性
a={1   '#3 (25,000)'  0  100   3;
    1   '#4 (24,000)'  100  196   4;
    1   '#8 (24,000)'  196  372   8;
    2   '#1 (16,000)'  0  48   1;
    2   '#2 (26,000):'  48  126   2;
    2   '#11 (82,300)'  126  372   11;
    3   '#5 (15,000)'  0  60   5;
    3   '#4 (17,000)'  60  128   4;
    3   '#6 (18,000)'  128  200   6;
    3   '#10 (43,055)'  200  372   10;
  4   '#7 (22,000)'  0  35   7;
  4   '#8 (103,000)'  35  200   8;
  4   '#9 (107,638)'  200  372   9;};
xlabels = string({"0","50","100","150","200","250","300","350"});
ylabels = string({"DS1","DS2","DS3","DS4"});%num2str((1:max(a(:,1)))','DS%d');

h=figure(1);
clf;
w=0.5;
set(gcf,'color','w');

%配色方案
colors = {[51,204,255]/255;
[255,255,0]/255;
[51,204,102]/255;
[51,255,204]/255;
[255,255,153]/255;
[219,186,119]/255;

[204,255,255]/255;
[102,255,51]/255;
[255,204,0]/255;
[102,153,255]/255;
[153,204,51]/255;};

for ii=1:size(a,1)
   % 利用颜色区分所装的原油类型
   x=cell2mat({a{ii,[3 3 4 4]}});
   y=a{ii,1}+[-w/2 w/2 w/2 -w/2];
   p=patch('xdata',x,'ydata',y,'facecolor',[1,1,1],'LineWidth',1.5);   %这里[1,1,1]可以用上面的颜色代替,以标识不同的颜色
   text(a{ii,3}+0.5,a{ii,1},a{ii,2},'FontSize',9);
end

set(gca,'Box','on');
set(gca,'XTick',0:50:350);
set(gca,'YTick',0:max(cell2mat({a{:,1}})));
set(gca,'XTickLabel',xlabels);
set(gca,'YTickLabel',{'';ylabels;''});

% 设置宽高
set(gcf,'position',[500,300,1000,250]);
box off;
annotation1 = annotation(h,'arrow',[0.131 0.131],[0.92 0.96]);
annotation2 = annotation(h,'arrow',[0.88 0.91],[0.11 0.11]);

% 设置坐标轴字体大小
set(gca,'FontName','Times New Roman','FontSize',12,'LineWidth',1.5);
axis([0 400 0 5]);
