"""
author:魏振东
data:2019.12.13
func:折线图绘制
"""
import matplotlib.pyplot as plt
plt.rcParams['font.sans-serif'] = ['SimHei']
plt.rcParams['axes.unicode_minus'] = False
years=[]
score=[]
file = open("cj.txt", 'r')
linesList = file.readlines()
for line in linesList:
linesList = line.strip().split(',')
file.close()
for x in range(0,8,2):
years.append(linesList[x])
for y in range(1,8,2):
score.append(linesList[y])
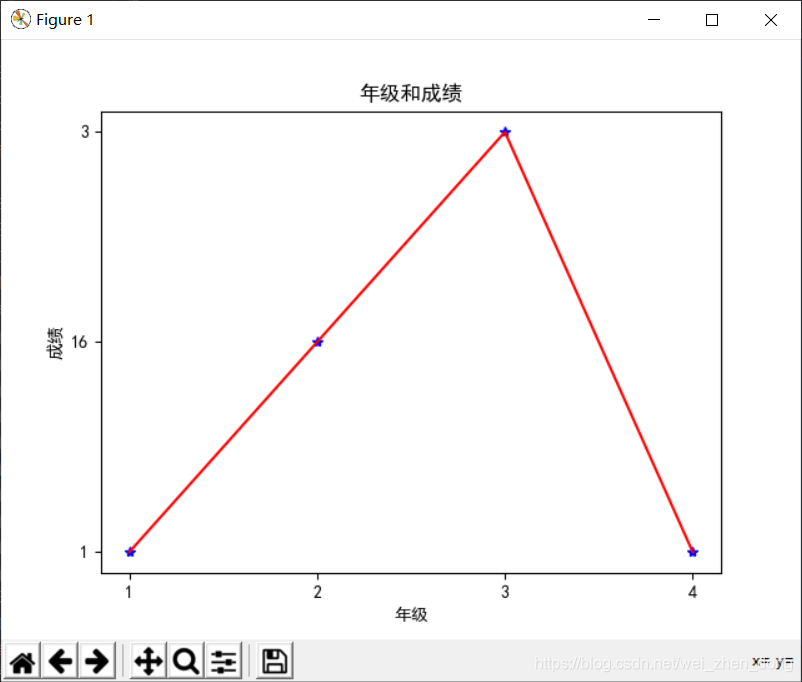
plt.plot(years, score, 'b*')
plt.plot(years, score, 'r')
plt.xlabel("年级")
plt.ylabel("成绩")
plt.title('年级和成绩')
plt.show()