import numpy as np
import matplotlib.pyplot as plt
import sys
%matplotlib inline
import caffe
caffe_example_path = "your caffe example path"
sys.path.append(caffe_example_path)
#configure plotting
plt.rcParams['figure.figsize']=(10, 10)
plt.rcParams['image.interpolation']='nearest'
plt.rcParams['image.cmap']='gray'
caffe.set_mode_cpu()
net = caffe.Net(caffe_example_path +'net_surgery/conv.prototxt', caffe.TEST)
print("blobs {}\n params {}".format(net.blobs.keys(), net.params.keys()))
blobs odict_keys(['data', 'conv'])
 params odict_keys(['conv'])
im = np.array(caffe.io.load_image(caffe_example_path+'images/cat gray.jpg', color=False)).squeeze()
plt.title("original image")
plt.imshow(im)
plt.axis('off')
/home/felaim/anaconda3/envs/tensorflow-gpu/lib/python3.7/site-packages/skimage/io/_io.py:48: UserWarning: `as_grey` has been deprecated in favor of `as_gray`
  warn('`as_grey` has been deprecated in favor of `as_gray`')

(-0.5, 479.5, 359.5, -0.5)

print("im.shape: ", im.shape)
im_input = im[np.newaxis, np.newaxis, :, :]
print("im_input.shape: ", im_input.shape)
net.blobs['data'].reshape(*im_input.shape)
print("reshape im_input.shape: ", im_input.shape)
net.blobs['data'].data[...] = im_input
im.shape:  (360, 480)
im_input.shape:  (1, 1, 360, 480)
reshape im_input.shape:  (1, 1, 360, 480)
def show_filters(net):
net.forward()
plt.figure()
filt_min, filt_max = net.blobs['conv'].data.min(), net.blobs['conv'].data.max()
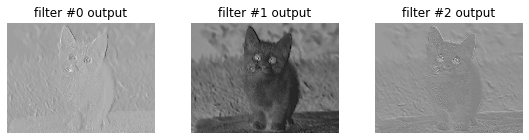
for i in range(3):
plt.subplot(1, 4, i+2)
plt.title("filter #{} output".format(i))
plt.imshow(net.blobs['conv'].data[0, i], vmin = filt_min, vmax=filt_max)
plt.tight_layout()
plt.axis('off')
# filter the image with initial
show_filters(net)
# pick first filter output
conv0 = net.blobs['conv'].data[0, 0]
print("pre-surgery output mean {:.2f}".format(conv0.mean()))
pre-surgery output mean 0.00
# set first filter bias to 1
net.params['conv'][1].data[0] = 1
net.forward()
print("post-surgery output mean {:.2f}".format(conv0.mean()))
post-surgery output mean 1.00
ksize = net.params['conv'][0].data.shape[2:]
print("ksize: ", ksize)
# make Gaussian blur
sigma = 1
y, x = np.mgrid[-ksize[0]//2+1:ksize[0]//2+1, -ksize[1]//2+1:ksize[1]//2+1]
print("y: ", y, " \n x: ", x)
ksize:  (5, 5)
y:  [[-2 -2 -2 -2 -2]
 [-1 -1 -1 -1 -1]
 [ 0  0  0  0  0]
 [ 1  1  1  1  1]
 [ 2  2  2  2  2]]
 x:  [[-2 -1  0  1  2]
 [-2 -1  0  1  2]
 [-2 -1  0  1  2]
 [-2 -1  0  1  2]
 [-2 -1  0  1  2]]
g = np.exp(-((x**2+y**2)/(2.0*sigma**2)))
print("g:", g)
g: [[0.01831564 0.082085   0.13533528 0.082085   0.01831564]
 [0.082085   0.36787944 0.60653066 0.36787944 0.082085  ]
 [0.13533528 0.60653066 1.         0.60653066 0.13533528]
 [0.082085   0.36787944 0.60653066 0.36787944 0.082085  ]
 [0.01831564 0.082085   0.13533528 0.082085   0.01831564]]
gaussian = (g/g.sum()).astype(np.float32)
net.params['conv'][0].data[0]= gaussian
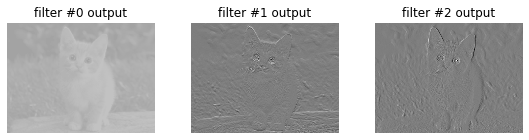
# make sobel operator for edge detection
net.params['conv'][0].data[1:] = 0
sobel = np.array((-1, -2, -1, 0, 0, 0, 1, 2, 1), dtype=np.float32).reshape((3, 3))
net.params['conv'][0].data[1, 0, 1:-1, 1:-1]= sobel # horizontal
net.params['conv'][0].data[2, 0, 1:-1, 1:-1]=sobel.T # vertical
show_filters(net)
!diff /home/felaim/Documents/software/caffe-master/examples/net_surgery/bvlc_caffenet_full_conv.prototxt /home/felaim/Documents/software/caffe-master/models/bvlc_reference_caffenet/deploy.prototxt
1,2c1
< # Fully convolutional network version of CaffeNet.
< name: "CaffeNetConv"
---
> name: "CaffeNet"
7,11c6
<   input_param {
<     # initial shape for a fully convolutional network:
<     # the shape can be set for each input by reshape.
<     shape: { dim: 1 dim: 3 dim: 451 dim: 451 }
<   }
---
>   input_param { shape: { dim: 10 dim: 3 dim: 227 dim: 227 } }
157,158c152,153
<   name: "fc6-conv"
<   type: "Convolution"
---
>   name: "fc6"
>   type: "InnerProduct"
160,161c155,156
<   top: "fc6-conv"
<   convolution_param {
---
>   top: "fc6"
>   inner_product_param {
163d157
<     kernel_size: 6
169,170c163,164
<   bottom: "fc6-conv"
<   top: "fc6-conv"
---
>   bottom: "fc6"
>   top: "fc6"
175,176c169,170
<   bottom: "fc6-conv"
<   top: "fc6-conv"
---
>   bottom: "fc6"
>   top: "fc6"
182,186c176,180
<   name: "fc7-conv"
<   type: "Convolution"
<   bottom: "fc6-conv"
<   top: "fc7-conv"
<   convolution_param {
---
>   name: "fc7"
>   type: "InnerProduct"
>   bottom: "fc6"
>   top: "fc7"
>   inner_product_param {
188d181
<     kernel_size: 1
194,195c187,188
<   bottom: "fc7-conv"
<   top: "fc7-conv"
---
>   bottom: "fc7"
>   top: "fc7"
200,201c193,194
<   bottom: "fc7-conv"
<   top: "fc7-conv"
---
>   bottom: "fc7"
>   top: "fc7"
207,211c200,204
<   name: "fc8-conv"
<   type: "Convolution"
<   bottom: "fc7-conv"
<   top: "fc8-conv"
<   convolution_param {
---
>   name: "fc8"
>   type: "InnerProduct"
>   bottom: "fc7"
>   top: "fc8"
>   inner_product_param {
213d205
<     kernel_size: 1
219c211
<   bottom: "fc8-conv"
---
>   bottom: "fc8"
# Load the original network and extract the fully connected layers' parameters
caffe_model_path = "path to caffe/models"
net = caffe.Net(caffe_model_path+"/bvlc_reference_caffenet/deploy.prototxt",
               caffe_model_path+"/bvlc_reference_caffenet/bvlc_reference_caffenet.caffemodel",
               caffe.TEST)

params = ['fc6', 'fc7', 'fc8']
fc_params = {pr:(net.params[pr][0].data, net.params[pr][1].data) for pr in params}
for fc in params:
    print("{} weights are {} dimensional and biases are {} dimensional".format(fc, fc_params[fc][0].shape, fc_params[fc][1].shape))
fc6 weights are (4096, 9216) dimensional and biases are (4096,) dimensional
fc7 weights are (4096, 4096) dimensional and biases are (4096,) dimensional
fc8 weights are (1000, 4096) dimensional and biases are (1000,) dimensional
net_full_conv = caffe.Net(caffe_example_path+'net_surgery/bvlc_caffenet_full_conv.prototxt',
                          caffe_model_path+'/bvlc_reference_caffenet/bvlc_reference_caffenet.caffemodel',
                          caffe.TEST)
params_full_conv =['fc6-conv', 'fc7-conv', 'fc8-conv']
# conv_params = {name:(weights, biases)}
conv_params ={pr:(net_full_conv.params[pr][0].data, net_full_conv.params[pr][1].data) for pr in params_fully_conv}

for conv in params_full_conv:
    print('{} weights are {} dimensional and biases are {} dimensional'.format(conv, conv_params[conv][0].shape, conv_params[conv][1].shape))
fc6-conv weights are (4096, 256, 6, 6) dimensional and biases are (4096,) dimensional
fc7-conv weights are (4096, 4096, 1, 1) dimensional and biases are (4096,) dimensional
fc8-conv weights are (1000, 4096, 1, 1) dimensional and biases are (1000,) dimensional
for pr,pr_conv in zip(params, params_full_conv):
    conv_params[pr_conv][0].flat = fc_params[pr][0].flat # flat unrolls the arrays
    conv_params[pr_conv][1][...]= fc_params[pr][1]
net_full_conv.save(caffe_example_path+"net_surgery/bvlc_caffenet_full_conv.caffemodel")
import numpy as np
import matplotlib.pyplot as plt
%matplotlib inline

#load input and configure prepeocessing
im = caffe.io.load_image(caffe_example_path+"images/cat.jpg")
transformer = caffe.io.Transformer({'data':net_full_conv.blobs['data'].data.shape})
transformer.set_mean('data', np.load("../python/caffe/imagenet/ilsvrc_2012_mean.npy").mean(1).mean(1))
transformer.set_transpose('data', (2, 0, 1))
transformer.set_channel_swap('data', (2, 1, 0))
transformer.set_raw_scale('data', 255.0)
# make classification map by forward and print prediction indices at each location
out = net_full_conv.forward_all(data=np.asarray([transformer.preprocess('data', im)]))
print (out['prob'][0].argmax(axis=0))
/home/felaim/anaconda3/envs/tensorflow-gpu/lib/python3.7/site-packages/skimage/io/_io.py:48: UserWarning: `as_grey` has been deprecated in favor of `as_gray`
  warn('`as_grey` has been deprecated in favor of `as_gray`')


[[282 282 281 281 281 281 277 282]
 [281 283 283 281 281 281 281 282]
 [283 283 283 283 283 283 287 282]
 [283 283 283 281 283 283 283 259]
 [283 283 283 283 283 283 283 259]
 [283 283 283 283 283 283 259 259]
 [283 283 283 283 259 259 259 277]
 [335 335 283 259 263 263 263 277]]
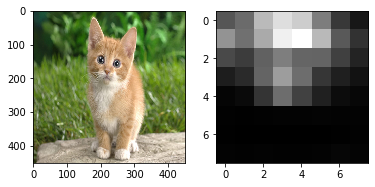
# show net input and confidence map (probability of the top prediction at each location)
plt.subplot(1, 2, 1)
plt.imshow(transformer.deprocess('data', net_full_conv.blobs['data'].data[0]))
plt.subplot(1, 2, 2)
plt.imshow(out['prob'][0, 281])
<matplotlib.image.AxesImage at 0x7f40a17a8208>
理解部分:
- 全连接的参数的存储方式:
权重尺寸是先输出尺寸,后输入尺寸,而偏差尺寸是输出尺寸。
权重存储位置: fc_params[fc][0]
偏差存储位置: fc_params[fc][1]
- 卷积的参数存储方式:
卷积权重按输出×输入×高度×宽度尺寸排列。
 权重存储位置:conv_params[conv][0]
 偏差存储位置:conv_params[conv][1]
参考地址:
https://nbviewer.jupyter.org/github/BVLC/caffe/blob/master/examples/net_surgery.ipynb
