MCM_PRE_PROJECT
import numpy as np
import matplotlib.pyplot as plt
import matplotlib
import pandas as pd
import math
plt.rcParams['savefig.dpi'] = 600 #图片像素
plt.rcParams['figure.dpi'] = 600 #分辨率
def transNWtoIthaca(x,XS,YS,StepLen):
    """
    x是一个列表
    通过XS、YS、StepLen来将真实世界中的坐标转化成伊萨卡坐标
    有:(row_temp ,col_temp ) = (x[0]-XS,YS-x[1])
        (row,col ) = (row_temp//StepLen ,col_temp//StepLen )
    """
    ans = []
    for i in x:
        xx = int(((i[0]-XS)//StepLen))
        yy = int(((YS-i[1])//StepLen))
        xx = max(xx,0)
        yy = max(yy,0)
        xx = min (xx, int(MAP_High))
        yy = min (yy, int(MAP_Width))
        ans.append((xx,yy))
    return ans
def copy2DList(List):
    ans = []
    cnt =0
    for i in List:
        ans.append([])
        for j in i:
            ans[cnt].append(int(j))
        cnt +=1
    return ans
预处理
1、读入数据
2、设置城市网格
注意,医院也可以停救护车,所以医院也可以作为parkinglot
def transPOSNUMTONUM(temp):
    ans = []
    for i in temp:
        [a,b,c,d,e,f] = i.split()
        a = int(a)
        b = int(b)
        c = float(c)
        c = a*3600 + b*60 + c
        c *= 1.309322
        d = int(d)
        e = int(e)
        f = float(f)
        f = d*3600 + e*60 + f
        ans.append((c,f))
    return ans
#获取hospital和parkinglots
hospitals = pd.read_excel('hospitals.xlsx')
parkinglots = pd.read_excel('parking lot.xlsx')

temp = np.array(hospitals['POS_NUM'])
temp = list(temp)
hospitals = transPOSNUMTONUM(temp)[0:4]

temp = np.array(parkinglots['POS_NUM'])
temp = list(temp)
parkinglots = transPOSNUMTONUM(temp)
print(parkinglots)
[(200054.84354940004, 275391.5), (200042.2740582, 275389.0), (200058.3787188, 275349.2), (200107.08549720002, 275379.5), (200035.3346516, 275394.1), (200049.344397, 275386.6), (200089.6715146, 275367.2), (199968.821094, 275457.8), (200057.5931256, 275361.6), (200045.41643100002, 275378.6), (200074.74524380002, 275341.9), (200066.62744740004, 275307.1), (200065.71092200003, 275316.4), (200064.00880340004, 275326.4), (200051.57024440003, 275314.2), (200065.71092200003, 275316.6), (200093.0757518, 275332.1), (200072.7812608, 275324.2), (200067.28210840002, 275323.1), (200059.81897300002, 275328.2), (199988.3299918, 275386.6), (199946.56262, 275479.8), (200022.76516040004, 275483.9), (200122.666429, 275455.3), (200154.22108920003, 275399.6)]
#获得伊萨卡的大致区域,左上右下
temp = ['42 27 42.6 76 31 38.1',
        '42 25 6.1 76 31 33',
        '42 27 50.3 76 28 34.4',
        '42 25 8.4 76 28 30.1']
Areas = transPOSNUMTONUM(temp)
print(Areas)
LEFT_DOWN = Areas[1]
RIGHT_UP  = Areas[2]
High = RIGHT_UP[0] - LEFT_DOWN[0]
Width = abs(RIGHT_UP[1] - LEFT_DOWN[1])
#NewPoint_X = X - LEFT_DOWN[0]
#NewPoint_Y = LEFT_DOWN - Y
X_START = LEFT_DOWN[0]
Y_START = LEFT_DOWN[1]
print(Y_START)
print(High,Width)
[(200146.36515720002, 275498.1), (199941.4562642, 275493.0), (200156.4469366, 275314.4), (199944.46770480002, 275310.1)]
275493.0
214.9906723999884 178.59999999997672
import networkx as nx
#开始建立一张图
StepLenth = 0.5
MAP_High = int(High//StepLenth)+20
MAP_Width = int(Width//StepLenth)+20
tra = np.load("HotTimeTim.npy")
peo = np.load("Peo.npy")
G=nx.Graph()
for i in range(MAP_High):
    for j in range(MAP_Width):
        G.add_node((i,j))#使用坐标当作索引
nodes = G.nodes()
#加边,每个点向上下左右加边
for i in range(MAP_High):
    for j in range(MAP_Width):
        a = (i-1,j)
        b = (i+1,j)
        c = (i,j+1)
        d = (i,j-1)
        w = tra[i][j]
        if(a  in nodes):
            G.add_weighted_edges_from([((i,j),a,w)])
        if(b  in nodes):
            G.add_weighted_edges_from([((i,j),b,w)])
        if(c  in nodes):
            G.add_weighted_edges_from([((i,j),c,w)])
        if(d  in nodes):
            G.add_weighted_edges_from([((i,j),d,w)])
print(MAP_High,MAP_Width)
449 377
def get_dis(x,y):
    return dijkstra_path_length(G, source, target, weight='weight')
定义函数,将经纬度转化成伊萨卡坐标
IthacaHospital = transNWtoIthaca(hospitals, X_START, Y_START,StepLenth )
IthacaParkingLots = transNWtoIthaca(parkinglots, X_START, Y_START,StepLenth )
print(IthacaHospital,IthacaParkingLots)
[(111, 126), (225, 88), (269, 120), (251, 339)] [(226, 203), (201, 208), (233, 287), (331, 227), (187, 197), (215, 212), (296, 251), (54, 70), (232, 262), (207, 228), (266, 302), (250, 371), (248, 353), (245, 333), (220, 357), (248, 352), (303, 321), (262, 337), (251, 339), (236, 329), (93, 212), (10, 26), (162, 18), (362, 75), (425, 186)]
delete = []
temp = len(IthacaParkingLots)
for i in range(temp):
    temp2 = len(IthacaParkingLots)
    for j in range(temp2):
        if(peo[IthacaParkingLots[j][0],IthacaParkingLots[j][1]]<1):
            del IthacaParkingLots[j]
            break
print(len(IthacaParkingLots))
19
在此,我们已经知道了hospital的经纬度,停车场的经纬度,并且已经知道他们的伊萨卡坐标了
读取数据
变量名:
**hospitals[i]**代表第i个医院的坐标
**parkingLots[i]**代表第i个停车场的坐标
n代表医院的数量
m代表停车场的数量
**N[i]**代表第i个医院片区内的停车场数目
**parkingLotOfHospital[i][j]**代表第i个医院片区内第j个停车场的序号
import random
STPART = 12
NDPART = 11
n = len(hospitals)
hospitals = IthacaHospital
for i in IthacaHospital:
    IthacaParkingLots.append(i)
print(IthacaParkingLots)
print(len(IthacaParkingLots))
random.shuffle(IthacaParkingLots)
parkinglots = IthacaParkingLots[0:STPART]
parkinglots2 =  IthacaParkingLots[len(IthacaParkingLots)-NDPART:]
m = STPART+NDPART
print(parkinglots,hospitals)
Ni = []
print(n,m)
[(226, 203), (201, 208), (233, 287), (331, 227), (187, 197), (215, 212), (296, 251), (232, 262), (207, 228), (266, 302), (248, 353), (245, 333), (220, 357), (248, 352), (303, 321), (262, 337), (251, 339), (236, 329), (162, 18), (111, 126), (225, 88), (269, 120), (251, 339)]
23
[(248, 352), (233, 287), (303, 321), (251, 339), (111, 126), (236, 329), (251, 339), (225, 88), (201, 208), (220, 357), (215, 212), (162, 18)] [(111, 126), (225, 88), (269, 120), (251, 339)]
4 23
对医院分配停车场
其中,变量:
**distancesFromHospitalToParkingLots[i][j]**代表i医院到j停车场的距离
FinalCost代表最终代价函数的大小
FinalBelongTo代表最终停车场的归类
**FinalN[i]**代表最终每个医院片区内的停车场数目
**POH[i][j]**代表第i个医院下属的第j个停车场的标号
其中,函数:
ComputeCost用于计算当前枚举出的情况的代价
ComputeK计算K,为了控制区域内的停车场不要过多
dfsForHealthArea枚举所有的情况,并在最后时刻进行检验,并且返回最小代价,以及对应的分组
方法:使用深度优先搜索
简而言之,数据量很小,每个停车场只可能被分配到4个医院中的一个,同时,停车场也不多,所以我们枚举出所有的可能,比较他们的代价,我们就可已找到全局的最优值。
distancesFromHospitalToParkingLots = np.zeros((n,m))#邻接矩阵表示距离
for i in range(n):
    for j in range(STPART):
        distancesFromHospitalToParkingLots[i][j] = nx.dijkstra_path_length(G, source = hospitals[i],target = parkinglots[j] )
#用来计算K
def ComputeK(x):
    if(x<=4):
        return 1
    else:
        return math.exp(x/12)

def ComputeCost(Temp, BelongTo):
    HospitalSet = Temp
    N = [0 for i in range(n)]
    if(len(HospitalSet)==0):
        HospitalSet = [[] for i in range(n)] # HospitalSet[i] 表示第i个医院区域中拥有的停车场集合
        N = [0 for i in range(n)]
        for i in range(STPART):
            HospitalSet[BelongTo[i]].append(i)
        for i in range(n):
            N[i] = len(HospitalSet[i])
    else :
        for i in range(NDPART):
            HospitalSet[BelongTo[i]].append(i+STPART)
        for i in range(n):
            N[i] = len(HospitalSet[i])
    #根据BelongTo生成HospitalSet成功
    totalCost = 0
    for i in range(n):
        cost = 0#单个医疗系统的代价
        for j in range(len(HospitalSet[i])):#
            cost += distancesFromHospitalToParkingLots[i][HospitalSet[i][j]]
        cost *= ComputeK(N[i])
        totalCost += cost
    return totalCost

def dfsForHealthArea(Number, BelongTo,Set):
    if(Number == 0):#若该组排列生成完毕,则返回该组的cost,并且返回该组的分配
        return ComputeCost(Set,BelongTo), BelongTo
    ReturnCost = 200000000000
    ReturnBelongTo = []
    for i in range(n):
        NewCost, NewBelongTo = dfsForHealthArea(Number-1, BelongTo + [i],Set)
        if(NewCost < ReturnCost):
            ReturnCost = NewCost
            ReturnBelongTo = NewBelongTo
    return ReturnCost, ReturnBelongTo
#POH完成
FinalCost, FinalBelongTo = dfsForHealthArea(STPART, [],[])
POH = [[]for i in range(n)]
for i in range(STPART):
    POH[FinalBelongTo[i]].append(i)
print(POH)
[[4], [7, 11], [8, 10], [0, 1, 2, 3, 5, 6, 9]]
for i in range(n):
    for j in range(NDPART):
        distancesFromHospitalToParkingLots[i][j+STPART] = nx.dijkstra_path_length(G, source = hospitals[i],target = parkinglots2[j] )
def ComputeK(x):
    if(x<=4):
        return 1
    else:
        return math.exp(x/12)
def copy1DList(x):
    ans = []
    for i in x:
        ans.append(int(i))
    return ans
def ComputeCost(Temp, BelongTo):
    HospitalSet = Temp
    N = [0 for i in range(n)]
    if(len(HospitalSet)==0):
        HospitalSet = [[] for i in range(n)] # HospitalSet[i] 表示第i个医院区域中拥有的停车场集合
        N = [0 for i in range(n)]
        for i in range(STPART):
            HospitalSet[BelongTo[i]].append(i)
        for i in range(n):
            N[i] = len(HospitalSet[i])
    else :
        for i in range(NDPART):
            HospitalSet[BelongTo[i]].append(i+STPART)
        for i in range(n):
            N[i] = len(HospitalSet[i])
    #根据BelongTo生成HospitalSet成功
    totalCost = 0
    for i in range(n):
        cost = 0#单个医疗系统的代价
        for j in range(len(HospitalSet[i])):#
            cost += distancesFromHospitalToParkingLots[i][HospitalSet[i][j]]
        cost *= ComputeK(N[i])
        totalCost += cost
    return totalCost

def dfsForHealthArea(Number, BelongTo,Set):
    Temp = copy2DList(Set)
    if(Number == 0):#若该组排列生成完毕,则返回该组的cost,并且返回该组的分配
        return ComputeCost(Temp,BelongTo), BelongTo
    ReturnCost = 200000000000
    ReturnBelongTo = []
    for i in range(n):
        NewCost, NewBelongTo = dfsForHealthArea(Number-1, BelongTo + [i],Temp)
        if(NewCost < ReturnCost):
            ReturnCost = NewCost
            ReturnBelongTo = NewBelongTo
    return ReturnCost, ReturnBelongTo
FinalCost, FinalBelongTo = dfsForHealthArea(NDPART, [],POH)
for i in range(NDPART):
    POH[FinalBelongTo[i]].append(i+STPART)
print(POH)
[[4, 12, 13, 14], [7, 11, 17, 18], [8, 10, 19, 20], [0, 1, 2, 3, 5, 6, 9, 15, 16, 21, 22]]
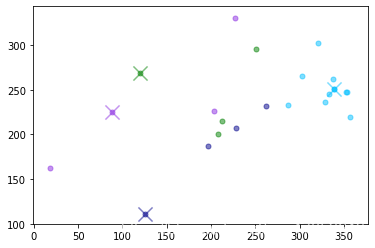
对分配进行大致的可视化
colors = ['#00008B','#8A2BE2', '#008000', '#00BFFF','#FF4500','#556B2F']
Nodes = []
print(hospitals)
for i in range(STPART):
    Nodes.append(parkinglots[i])
for i in range(NDPART):
    Nodes.append(parkinglots2[i])
for i in range(n):
    plt.scatter(hospitals[i][1],hospitals[i][0],marker='x',alpha = 0.5,c=colors[i],s = 200)
    for j in POH[i]:
        plt.scatter(Nodes[j][1],Nodes[j][0],marker='.',alpha = 0.5,c=colors[i],s=100)
plt.show()
for i in range(n):
    for j in range(m):
        print(distancesFromHospitalToParkingLots[i][j],end=' ')
    print('')
[(111, 126), (225, 88), (269, 120), (251, 339)]
149.35955227438083 117.81094561364668 158.121438082474 145.43668858802903 0.0 135.5273491815648 145.43668858802903 77.27851744945961 73.5622298959135 140.2557117862896 80.87087230525655 93.0030727442022 107.56237513616068 63.11877278262706 84.32545985631697 149.03579596284106 136.8491364779449 130.9921217207112 81.17543318126717 71.63745604030949 128.25226407643842 149.75333930120058 140.6812311025006
127.47766132213263 95.92905466139862 136.21148078877926 123.55479763578079 77.27851744945983 113.64545822931674 123.55479763578079 0.0 70.56879736122069 122.30986717543419 66.84280032781287 58.169921397773564 85.67546076692469 71.15997969068515 76.61487845259202 127.15390501059267 114.96724552569654 109.08216442701713 59.26547588757296 49.72749874661549 106.34230678274436 127.87144834895238 118.79934015025243
104.10482359706663 83.97442948549214 95.89012398812676 97.73920264661938 71.63745604030954 99.32920524857467 97.73920264661938 49.72749874661545 64.92773595207031 116.65291614575595 61.20173891866253 98.62842195931803 74.50786246661625 65.51891828153477 70.9602985277601 92.6099669100655 77.07719607589573 68.76080762636492 52.83622594679762 0.0 66.02094998209215 104.50361281783493 97.70918948292804
6.380627532293021 27.62574297438248 27.915245453782003 0.0 145.43668858802963 9.909704191825181 0.0 123.55479763578133 71.89012788074751 19.360592835499386 64.58898630748641 181.72229559795775 37.880613617619744 82.32928364813503 61.11296908045152 5.18425986998808 20.73703947995234 75.90226739291586 64.2898113798816 97.73920264662014 52.76884788896379 6.7794167530613345 4.785470649219766
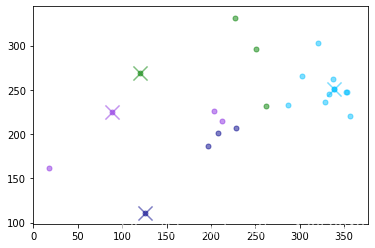
模拟退火进行进一步调整
根据我们观察,右上角的点附近的停车场过多,导致分配时为了防止被惩罚函数影响
import random
def ComputeK(x):
    if(x<=4):
        return 1
    else:
        return math.exp(x/12)
def ChangeSA1(Set):
    Temp = []
    cnt = 0
    for i in list(Set) :
        Temp.append([])
        for j in i:
            Temp[cnt].append(int(j))
        cnt += 1
    x = random.randint(0,n-1)
    x_To = random.randint(0,n-1)
    y = random.randint(0,n-1)
    y_To = random.randint(0,n-1)
    if(len(Temp[x])!=0):
        Target = random.randint(0,len(Temp[x])-1)
        Target = Temp[x][Target]
        Temp[x_To].append(Target)
        Temp[x].remove(Target)
    if(len(Temp[y])!=0):
        Target = random.randint(0,len(Temp[y])-1)
        Target = Temp[y][Target]
        Temp[y_To].append(Target)
        Temp[y].remove(Target)
    return Temp
def AimFunctionSA1(Set):
    totalCost = 0
    for i in range(n):
        cost = 0#单个医疗系统的代价
        for j in range(len(Set[i])):#
            cost += distancesFromHospitalToParkingLots[i][Set[i][j]]
        cost *= ComputeK(len(Set[i]))
        totalCost += cost
    return totalCost
Ans = AimFunctionSA1(POH)
OLDPOH = copy2DList(POH)
print(Ans,OLDPOH)

T=1000 #initiate temperature
Tmin=1 #minimum value of terperature
x=copy2DList(POH)
k=50 #times of internal circulation
t=0#time
y=0
while T>=Tmin:
    for i in range(k):
        #calculate y
        y=AimFunctionSA1(x)
        if(y<Ans):
            Ans = float(y)
            OLDPOH = copy2DList(x)
        #generate a new x in the neighboorhood of x by transform function
        xNew=ChangeSA1(x)
        yNew=AimFunctionSA1(xNew)
        if (yNew-y<0):
            x=xNew
        else:
            #metropolis principle
            p=math.exp(-(yNew-y)/T)
            r=np.random.uniform(low=0,high=1)
            if r<p:
                x=xNew
    t+=1
    T=1000/(1+t)

print (OLDPOH,AimFunctionSA1(OLDPOH))
POH = OLDPOH
995.4908028620748 [[4, 12, 13, 14], [7, 11, 17, 18], [8, 10, 19, 20], [0, 1, 2, 3, 5, 6, 9, 15, 16, 21, 22]]
[[8, 14, 4, 13], [11, 10, 18, 7], [19, 12, 17, 20], [5, 15, 2, 16, 6, 21, 22, 0, 3, 1, 9]] 936.3904887448715
colors = ['#00008B','#8A2BE2', '#008000', '#00BFFF','#FF4500','#556B2F']
print(hospitals)
for i in range(n):
    plt.scatter(hospitals[i][1],hospitals[i][0],marker='x',alpha = 0.5,c=colors[i],s = 200)
    for j in POH[i]:
        plt.scatter(Nodes[j][1],Nodes[j][0],marker='.',alpha = 0.5,c=colors[i],s=100)
plt.show()
[(111, 126), (225, 88), (269, 120), (251, 339)]
导入人口密度数据
def makeit():
    Peo = pd.read_excel('Peo.xlsx')
    temp = Peo
    Xs = list(temp['POS_X'])
    tmep = Peo
    Ys = list(temp['POS_Y'])
    Xs = transPOSNUMTONUM(Xs)
    Ys = transPOSNUMTONUM(Ys)
    Xs, Ys = transNWtoIthaca(Xs,X_START,Y_START,StepLenth), transNWtoIthaca(Ys,X_START,Y_START,StepLenth)
    Peos = [25,25,25,25,25,25,125,125,125,125,150,150,150,150,350,475,475,475,875,925,1050,1100,1500]
    NumOfAreas = len(Peos)
    print(Xs[0],Ys[0])
    ST = []
    ND = []
    for i in range(NumOfAreas):
        ST.append((Ys[i][0],Xs[i][1]))
        ND.append((Xs[i][0],Ys[i][1]))
    print(ST[0],ND[0])
开始进行覆盖,生成人口密度地图
def Cover(Matrix,S,T,P):
    """
    Matrix : 目标矩阵
    S:左下角
    T:右上角
    P:人口密度
    """
    for i in range(S[0],T[0]+1):
        for j in range(S[1],T[1]+1):
            Matrix[i][j] = P
def none():
    Peo = np.zeros((MAP_High,MAP_Width))
    for i in range(NumOfAreas):
        Cover(Peo,ST[i],ND[i],Peos[i])
    print(np.sum(Peo))
    np.save("Peo.npy",Peo)
Tra = np.load("tra.npy")
Peo = np.load("Peo.npy")
TruePeo =29287
Peo = Peo * (TruePeo/int(np.sum(np.sum(Peo))))
将交通流量转化成通行速度
从通行量:Tra 到道路速度: ARGV
再从ARGV 到相对车速 : Tim = 1/ARGV
现根据车流在24小时内分布关系,求出高峰期和平常期的车流量
①车速为v(单位:m/h),也就是每小时车队行 驶的距离;
②流量为q(单位:veh/h),即单车道每小时通 过观测点的车辆数;
③感觉一反应时间为T(单位:s),即后车驾驶 人从有情况到踩下刹车踏板或采取其他正确的处置 措施所需的间隔时间;
④单辆轿车的长度为a(单位:m)。
单位时间内车通过的路程l = v
得到80km/h 即 80000m/h ,T = 1.5s , a = 5m 下的车流密度,即道路通行能力 c = 2086 作为闲暇时段的通行能力
60km/h,即 60000m/h , T = 2.0s , a = 5m 下的车流密度,即道路通行能力 c = 1565 作为繁忙时段的通行能力
拟合数据
得到实际速度V(km/h)与道路最大车速 、道路通行能力c、当前流量p之间的关系:
使用通常取值[3]:
α = 0.15
β = 4.0
那么已知道路情况的条件下,即可求出任意一条道路的通行速度
棋盘上相邻两点距离为23.6米,那么,通行时间即为:23.6/v
根据已有数据合情推理,高峰期与非高峰期车流量比例约为14:4,根据此比重,算出高峰期时每小时内车流平均密度
参考文献:
[1]大型车比例对城市道路机动车速度-流量模型的影响分析 刘晓庆 全林花 东南大学
[2]速度、流量与道路通行能力分析 李排昌 韩风春 中国人民公安大学
[3]城市道路交通流速度流量实用关系模型研究 陈盛 东南大学
计算高峰期和平常期的交通流量
一般来说,城市的高峰期在早上的7点到9点以及下午的5点到8点,总计5个小时
高峰期的车流密度可达到非高峰期的比值为 7:2
据此即可计算出高峰期与非高峰期的车流量
def computeTim():
    #计算车流比例
    HotTimProportion = 7/(19*2+5*7)
    ColdTimProportion = 2/(19*2+5*7)
    #分别计算高峰期、非高峰期的车流密度
    HotTimeTra = Tra * HotTimProportion
    ColdTimTra = Tra * ColdTimProportion
    def computeV(p,c,Vmax,alpha,beta):
        return np.divide(Vmax,1+(np.power(p/c,beta)*alpha))
    HotTimeV = computeV(HotTimeTra,1565,60,0.15,4)
    ColdTimeV = computeV(ColdTimTra,2086,80,0.15,4)
    HotTimeTim = np.divide(23.6,HotTimeV)
    ColdTimeTim = np.divide(23.6,ColdTimeV)
    np.save("HotTimeTim.npy",HotTimeTim)
    np.save("ColdTimeTim.npy",ColdTimeTim)
人口密度可视化
import matplotlib.image as mpimg
lena = mpimg.imread('Peo.jpeg')
plt.figure(1)
plt.imshow(lena) # 显示图片
plt.axis('off') # 不显示坐标轴
plt.title('Population distribution in Ithaca')
plt.show()

lena = mpimg.imread('tra.jpeg')
plt.figure(1)
plt.imshow(lena) # 显示图片
plt.axis('off') # 不显示坐标轴
plt.title('Daily average traffic distribution in Ithaca')
plt.show()

上方是点的标号
对点分配医疗中心
假设现在已知各店到停车场的距离以及各点到医院的距离,分别为distancesFromHomeToParkingLots 和 distancesFromHomeToHospitals
先将每个住户分配到不同的医疗中心,分配的原则是定义住户到医疗系统的距离为1.5倍的到该医疗系统的最近停车场的距离和1倍的到该医疗系统的医院的距
离,对任意用户,选择距离该用户最近的医疗系统。
其中,变量:
nodeNum点的个数
**nodeID[i][j]**排列在(i,j)的点对应的id
parkinglots = Nodes
FromNodeToNum = {}
FromNumToNode = {}
cnt = 0
for i in range(MAP_High):
    for j in range(MAP_Width):
        FromNodeToNum[(i,j)]=cnt
        FromNumToNode[cnt]=(i,j)
        cnt=cnt+1
nodeNum = MAP_Width*MAP_High
distancesFromParkingLotsToHome = np.zeros((m,nodeNum))
distancesFromHospitalsToHome = np.zeros((n,nodeNum))
#计算医院到各点的距离
for i in range(n):
    DistanceDic = nx.shortest_path_length(G, source=hospitals[i])
    for row in range(MAP_High):
        for col in range(MAP_Width):
            distancesFromHospitalsToHome[i][FromNodeToNum[(row,col)]] = DistanceDic[(row,col)]
#计算停车场到各点的距离
print(len(parkinglots))
for i in range(m):
    DistanceDic = nx.shortest_path_length(G, source=parkinglots[i])
    for row in range(MAP_High):
        for col in range(MAP_Width):
            distancesFromParkingLotsToHome[i][FromNodeToNum[(row,col)]] = DistanceDic[(row,col)]

def ComputeW(Threshold, X):
    if(x < Threshold) :
        return 1
    else :
        return math.exp((x/(Threshold*4)))
23
def BelongToWitch(List):
    Goal = min(List)
    for i in range(len(List)):
        if(List[i] == Goal):
            return i
### 对每个点分配起始归属

#此处计算每个点到各个系统的距离
disFromHomeToCenter = np.zeros((nodeNum,n))
HomeBelongTo = []
for i in range(nodeNum):
    Temp = []
    for j in range(n):
        dises = []
        for ParkingLot in POH[j]:
            dises.append(distancesFromParkingLotsToHome
                         [ParkingLot][i])
        FromHomeToPar = min(dises)
        FromHomeToHos = distancesFromHospitalsToHome[j][i]
        CostFromHomeToCenter = 1.5*FromHomeToPar+FromHomeToHos
        Temp.append(CostFromHomeToCenter)
    HomeBelongTo.append(BelongToWitch(Temp))
HToC = [[],[],[],[]]
for i in range(len(HomeBelongTo)):
    HToC[HomeBelongTo[i]].append(i)
for i in range(4):
    print(len(HToC[i]))
45119
22728
52297
49129
print(FromNumToNode[1])
HomeAndCenterMap = np.zeros((MAP_High,MAP_Width))
for i in range(nodeNum):
    HomeAndCenterMap[(FromNumToNode[i])[0]][(FromNumToNode[i])[1]]=HomeBelongTo[i]
np.save("DevideMap.npy",HomeAndCenterMap)
(0, 1)
当前分区可视化
def DrawPic(Pic,PPeo,name,title):
    canvas = np.zeros((Pic.shape[0]*10+10, Pic.shape[1]*10+10,3), dtype="uint8") #3
    for i in range(Pic.shape[0]):
        for j in range(Pic.shape[1]):
            xx = Pic.shape[0]-i-1
            yy = j
            color = []
            if(Pic[xx][yy] == 0 ):
                color = (0,0,0)
            elif(Pic[xx][yy] ==1) :
                color = (255,0,0)
            elif(Pic[xx][yy] == 2):
                color = (0,255,0)
            else :
                color = (0,0,255)
            if(PPeo[xx][yy]==0):
                color = (255,255,255)
            for x in range(i*10,i*10+10):
                for y in range(j*10,j*10+10):
                    canvas[x][y] = (color[2],color[1],color[0])
    matplotlib.image.imsave(name, canvas)
    lena = mpimg.imread(name)
    plt.figure(1)
    plt.imshow(lena) # 显示图片
    plt.axis('off') # 不显示坐标轴
    plt.title(title)
    plt.show()
DrawPic(HomeAndCenterMap,Peo,'asd.png','haoshuai')

lena = mpimg.imread('DevideMap.jpg')
plt.figure(1)
plt.imshow(lena) # 显示图片
plt.axis('off') # 不显示坐标轴
plt.title('Home and Centers')
plt.show()

lena = mpimg.imread('DevideMapAfterTra.jpg')
plt.figure(1)
plt.imshow(lena) # 显示图片
plt.axis('off') # 不显示坐标轴
plt.title('Home and Centers ADD Traffic')
plt.show()

模拟退火优化贪心模型
import random
def ComputeW(x):
    if(x<=8000):
        return 1
    else:
        return math.exp(x/10000 - 0.5)
def ChangeSA1(Set):
    x = random.randint(0,n-1)
    x_To = random.randint(0,n-1)
    y = random.randint(0,n-1)
    y_To = random.randint(0,n-1)
    if(len(Set[x])!=0):
        Target = random.randint(0,len(Set[x])-1)
        Target = Set[x][Target]
        Set[x_To].append(Target)
        Set[x].remove(Target)
    if(len(Set[y])!=0):
        Target = random.randint(0,len(Set[y])-1)
        Target = Set[y][Target]
        Set[y_To].append(Target)
        Set[y].remove(Target)
    return Set
def ChangeSA2(Set):
    temp = copy2DList(Set)
    Tii = random.randint(0,300)
    for i in range(Tii):
        temp = ChangeSA1(temp)
    return temp

def AimFunctionSA2(Set):
    totalCost = 0
    for i in range(n):
        cost_h = 0
        cost_p = 0#单个医疗系统的代价
        TOTPEO = 0
        #distancesFromParkingLotsToHome -- [parkinglot_num][nodeNum]
        #distancesFromHospitalsToHome -- [hospitalNum ][nodeNum]
        #FromNumToNode -- [(index_X,index_Y)] --> nodeId

        for j in range(len(Set[i])):#
            dis = []
            for park in POH[i]:
                dis.append(distancesFromParkingLotsToHome[park][Set[i][j]])
            PARKTOHOME = min(dis)*1.5
            HOSTOHOME = distancesFromHospitalsToHome[i][Set[i][j]]
            cost_p += PARKTOHOME
            cost_h += HOSTOHOME
            TOTPEO += Peo[FromNumToNode[Set[i][j]][0]][FromNumToNode[Set[i][j]][1]]
        cost = ComputeW(TOTPEO)
        cost *= cost_h
        cost += cost_p/len(POH)
        totalCost += cost
    return totalCost
def AS2():
    Ans = AimFunctionSA2(HToC)
    OLDHToC = copy2DList(HToC)
    print(Ans)
    Js = []
    T=1000 #initiate temperature
    Tmin=10 #minimum value of terperature
    x=copy2DList(HToC)
    k=50 #times of internal circulation
    t=0#time
    y=0
    while T>=Tmin:
        for i in range(k):
            #calculate y
            y=AimFunctionSA2(x)
            Js.append(Ans)
            if(y<Ans):
                Ans = float(y)
                OLDHToC = copy2DList(x)
            #generate a new x in the neighboorhood of x by transform function
            xNew=ChangeSA2(x)
            yNew=AimFunctionSA2(xNew)
            if (yNew-y<0):
                x=xNew
            else:
                #metropolis principle
                p=math.exp(-(yNew-y)/T)
                r=np.random.uniform(low=0,high=1)
                if r<p:
                    x=xNew
        t+=1
        T=1000/(1+t)
        if(t%10==0):
            print(t)

    print (AimFunctionSA2(OLDHToC))
    HToC = OLDHToC
def SA2_End():
    np.save('SAHToC.npy',HToC)
    SAHToCMAP = np.zeros((MAP_High,MAP_Width))
    for i in range(4):
        for i in range(len(HToC[i])):
            SAHToCMAP[(FromNumToNode[i])[0]][(FromNumToNode[i])[1]]= i
    np.save("SAHToCMAP.npy",SAHToCMAP)
当前已知医疗系统,及其对应的用户集合,在本部分中我们将对用户分配救护车
首先,得到每个区域的人数
PeoOfEachCenter = []
for i in range(n):
    S = 0.0
    cnt = 0
    for j in HToC[i]:
        S = S+ Peo[FromNumToNode[j][0]][FromNumToNode[j][1]]
    PeoOfEachCenter.append(S)
print(PeoOfEachCenter)
[5920.529208865564, 9722.775413745185, 4241.251932326228, 9402.443445067056]
有趣的是,我们求出的医疗系统服务人数,基本与该医院的医疗水平成正比
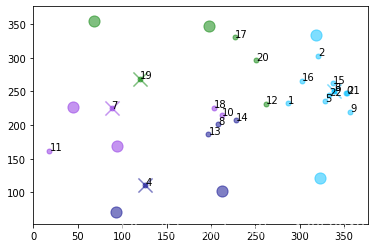
对于每个区域内的所有用户,我们使用聚类算法kmeans对他们的坐标求出3个聚类中心
对于每一个聚类中心,挑选一个距离他最近的停车场,进行停车
下面是我以前写的代码,我直接拿来用了
def compute_euclidean_distance(vec_1, vec_2):          # your code comes here
    '''
    input:
        vec_1 & vec_2 -- two vectors
    return:
        distace -- the distance between vector_1 and vector_2
    '''
    return np.linalg.norm(vec_1 - vec_2)
def initialise_centroids(dataset, k):
    '''
    input:
        dataset -  the data
        k       - the number of class you want
    return :
        randomly chose k datas from dataset and return
    '''
    centers = {}
    number = [i for i in range(dataset.shape[0])]

    number = random.sample(number,k)
    for i in range(k):
        centers[i]=dataset[number[i]]
    return centers
def kmeans(dataset, k):
    """
    kmeans code
    input :
    dataset and k
    return :
    the centers
    and result -- a dictionary of k elements, where result[i] represents all points in the i-th category

    way:
    1. First, we randomly select k points in the data points as the cluster center.
    2. For each sample, assign it to the cluster center closest to him.
    3. Recalculate the cluster center. The new center is the average of all points in the class and calculates the fitness J.
    4. If the fitness J converges (the change is less than 0.0001), the exit function returns the target value. If it does not converge, it returns 2 steps.
    """
    centers = initialise_centroids(dataset, k)
    result={}# the class
    Js = []
    while(1):
        clf = {}
        for i in range(k):
            clf[i] = []#init
        for feature in dataset:
            distances = []
            for center in centers:# center is the number
                distances.append(compute_euclidean_distance(feature,centers[center]))
            classification = distances.index(min(distances))#it is the class of this point
            clf[classification].append(feature)# add this point into the clf[class]
        prev_centers = dict(centers)
        for c in clf:# analyse the new center
            centers[c] = np.average(clf[c], axis=0)
        optimized = True
        result = clf
        total = 0
        for i in result:#analyse
            for node in result[i]:
                total += compute_euclidean_distance(centers[i],node)#analyse cost function J
        Js.append(total)
        for center in centers:# analyse new center
            org_centers = prev_centers[center]
            cur_centers = centers[center]
            if(np.sum((cur_centers - org_centers) / org_centers * 100.0) > 0.0001):
                optimized = False
        if (optimized):
            break
    return centers,result,Js
ClassTime = 2
Centers = []
for i in range(n):
    data = []
    for j in HToC[i]:
        data.append([FromNumToNode[j][0],FromNumToNode[j][1]])
    data = np.array(data,dtype='float32')
    cen , _ ,_ = kmeans(data,ClassTime)
    Centers.append([[cen[0][0],cen[0][1]],[cen[1][0],cen[1][1]]])
print(Centers)
[[[102.032074, 212.62692], [71.21777, 93.49014]], [[227.00014, 44.123886], [169.20589, 94.63201]], [[354.04984, 68.0029], [347.403, 198.29425]], [[333.39944, 318.73605], [121.730865, 323.29587]]]
colors = ['#00008B','#8A2BE2', '#008000', '#00BFFF','#FF4500','#556B2F']
for i in range(n):
    plt.scatter(hospitals[i][1],hospitals[i][0],marker='x',alpha = 0.5,c=colors[i],s = 200)
    cnt = 0
    for j in POH[i]:
        plt.scatter(Nodes[j][1],Nodes[j][0],marker='.',alpha = 0.5,c=colors[i],s=100)
        plt.annotate(POH[i][cnt], xy = (Nodes[j][1], Nodes[j][0]), xytext = (Nodes[j][1]+0.1, Nodes[j][0]+0.1))
        cnt += 1
    for j in Centers[i] :
        plt.scatter(j[1],j[0],marker='.',alpha = 0.5,c=colors[i],s=500)
plt.show()

随机取点法,从期望上来说也是比较分散的
NEWPOH = copy2DList(POH)
for i in range(n):
    random.shuffle(NEWPOH[i])
    NEWPOH[i] = NEWPOH[i][:2]
colors = ['#00008B','#8A2BE2', '#008000', '#00BFFF','#FF4500','#556B2F']
for i in range(n):
    plt.scatter(hospitals[i][1],hospitals[i][0],marker='x',alpha = 0.5,c=colors[i],s = 200)
    for j in NEWPOH[i]:
        plt.scatter(Nodes[j][1],Nodes[j][0],marker='.',alpha = 0.5,c=colors[i],s=100)
plt.show()
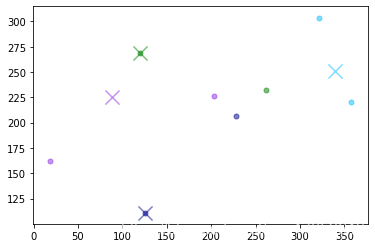
主要是对右方的停车场进行再分配,选择3~4个离散程度最高的点
dis = np.zeros((m,m))
for i in range(m):
    for j in range(m):
        dis[i][j] = nx.dijkstra_path_length(G, source = Nodes[i],target = Nodes[j] )
Size = len(POH[3])
def com(l,n,cur):
    if(n==1):
        ans = [];
        for i in l:
            ans.append(cur+[i])
        return ans;
    ans = [];
    for i in range(len(l)-n+1):
        temp = com(l[i+1:],n-1,cur+[l[i]])
        for j in temp :
            ans.append(j)
    return ans
def Select(List,k):
    temp = copy1DList(List)
    Permutations = com(temp,k,[])
    MAXANS = 0
    ANS = []
    for i in Permutations :
        cos  = 0
        for j in i:
            for k in i:
                cos += dis[j][k]
        if(cos > MAXANS):
            ANS = i
            MAXANS = cos
    return ANS
FinalPOH = [[],[],[],[]]
for i in range(n):
    FinalPOH[i] = Select(POH[i],2)
print(FinalPOH)
[[14, 4], [11, 18], [19, 12], [2, 9]]
NEWPOH = copy2DList(POH)
colors = ['#00008B','#8A2BE2', '#008000', '#00BFFF','#FF4500','#556B2F']
for i in range(n):
    plt.scatter(hospitals[i][1],hospitals[i][0],marker='x',alpha = 0.5,c=colors[i],s = 200)
    for j in FinalPOH[i]:
        plt.scatter(Nodes[j][1],Nodes[j][0],marker='.',alpha = 0.5,c=colors[i],s=100)
plt.show()
def GetBelongTo(ParkingLotSet,HomeSet):
    BelongTo = []
    for i in HomeSet:
        Min = 1e9
        ans = 0
        for j in ParkingLotSet:
            if(distancesFromParkingLotsToHome[j][i]<Min):
                ans = j
                Min = distancesFromParkingLotsToHome[j][i]
        BelongTo.append(ans)
    return BelongTo
def GetMap(POH_here,HToC_here):
    NodesBelongTo = [0 for  i in range(nodeNum)]
    for i in range(n):
        ThisBelongTo = GetBelongTo(POH_here[i],HToC_here[i])
        for j in range(len(ThisBelongTo)):
            NodesBelongTo[HToC_here[i][j]]=ThisBelongTo[j]
    MAP = np.zeros((MAP_High,MAP_Width))
    for i in range(nodeNum):
        MAP[FromNumToNode[i][0]][FromNumToNode[i][1]] = NodesBelongTo[i]
    return MAP
print(FinalPOH)
NodesBelongToParkingLotsMap = GetMap(FinalPOH,HToC)
np.save('NodesBelongToParkingLotsMap.npy',NodesBelongToParkingLotsMap)
[[14, 4], [11, 18], [19, 12], [2, 9]]
FinalResult =  pd.read_excel('parking lot.xlsx')
FinalResult = FinalResult['经纬度']
FinalResult = FinalResult[[14,4,11,18,19,12,2,9]]
FinalResult.head()
14    42°26'30.2"N 76°28'34.2"W
4     42°26'17.8"N 76°29'54.1"W
11    42°26'41.7"N 76°28'27.1"W
18    42°26'42.2"N 76°28'43.1"W
19    42°26'36.5"N 76°28'48.2"W
Name: 经纬度, dtype: object
