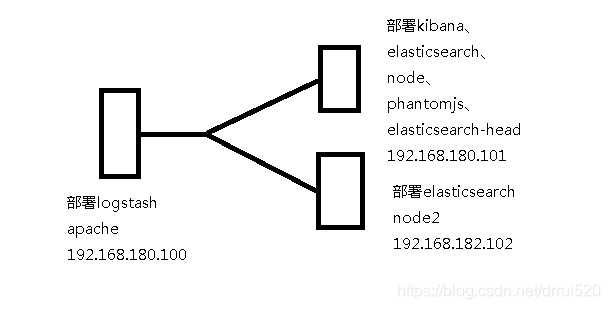
一、实验环境
所需软件见百度云盘linux-ELK
二、环境准备
1.分别在两个ELK节点上通过本地hosts文件配置域名解析
节点1配置
setenforce 0
systemctl stop firewalld
vim /etc/hostname
node1
hostname node1
bash
vim /etc/hosts
添加如下两行
192.168.180.101 node1
192.168.180.102 node2
节点2配置
setenforce 0
systemctl stop firewalld
vim /etc/hostname
node2
hostname node2
bash
vim /etc/hosts
添加如下两行
192.168.180.101 node1
192.168.180.102 node2
2.检查java环境
Java -version
3.配置静态IP、网关、DNS,保证节点能访问互联网
三、安装elasticsearch软件
1.分别在两个节点上安装elasticsearch软件
rpm -ivh elasticsearch-5.5.0.rpm
systemctl daemon-reload
systemctl enable elasticsearch
2.修改主配置文件
vim /etc/elasticsearch/elasticsearch.yml
cluster.name: my-elk-cluster
node.name: node1
path.data: /data/elk_data
path.logs: /var/log/elasticsearch/
bootstrap.memory_lock: false
network.host: 0.0.0.0
http.port: 9200
discovery.zen.ping.unicast.hosts: [“node1”,“node2”]
3.创建数据存放路径并授权
mkdir -p /data/elk_data
chown elasticsearch:elasticsearch /data/elk_data
4.启动elasticsearch并查看是否成功开启
systemctl start elasticsearch
netstat -antp | grep 9200
5.查看节点信息
http://node1:9200
http://node2:9200
http://node1:9200/_cluster/health?pretty
http://node1:9200/_cluster/state?pretty
6.节点2配置基本相同将步骤2中的node.name:node1替换为node2
三、在节点1上安装elasticsearch-head插件
1.编译安装node,安装耗时比较长
tar zvxf node-v8.2.1.tar.gz -C /usr/src
cd /usr/src/node-v8.2.1/
./configure && make && make install
2.安装phantomjs
tar xvjf phantomjs-2.1.1-linux-x86_64.tar.bz2 -C /usr/local/src
cd /usr/local/src/phantomjs-2.1.1-linux-x86_64/bin/
cp phantomjs /usr/local/bin
3.安装elasticsearch-head
tar zvxf elasticsearch-head.tar.gz -C /usr/local/src
cd /usr/local/src/elasticsearch-head
npm install
4.修改elasticsearch主配置文件
vim /etc/elasticsearch/elasticsearch.yml
最后添加
http.cors.enabled: true
http.cors.allow-origin: “*”
重启elasticsearch服务
systemctl restart elasticsearch
5.启动elasticsearch-head插件并测试
cd /usr/local/src/elasticsearch-head/
npm run start &
netstat -luntp | grep 9100
netstat -luntp | grep 9200
6.通过浏览器访问http://192.168.180.101:9100
7.插入索引
curl -XPUT ‘localhost:9200/index-demo/test/1?pretty&pretty’ -H ‘Content-Type: application/json’ -d ‘{“user”:“zhangsan”,“mesg”:“hello world”}’
8.再次访问http://192.168.180.101:9100——数据浏览——即可看到索引信息
四、在主节点node1上部署Kibana软件
1.安装kibana并设置开机自动启动
rpm -ivh kibana-5.5.1-x86_64.rpm
systemctl enable kibana
2.修改kibana主配置文件
vim /etc/kibana/kibana.yml
server.port: 5601
server.host: “0.0.0.0”
elasticsearch.url: “http://192.168.180.101:9200”
kibana.index: “.kibana”
3.启动kibana服务
systemctl start kibana
五、在apache服务器上部署logstash软件
1.安装apache软件并启动
yum install -y httpd
systemctl start httpd
systemctl enable httpd
setenforce 0
systemctl stop firewalld
systemctl disable firewalld
2.安装logstash
java -version
rpm -ivh logstash-5.5.1.rpm
systemctl daemon-reload
systemctl enable logstash
3.编写logstash配置文件apache_log.conf
vim /etc/logstash/conf.d/apache_log.conf
input {
file {
path => “/etc/httpd/logs/access_log”
type => “access”
start_position => “beginning”
}
file {
path => “/etc/httpd/logs/error_log”
type => “error”
start_position => “beginning”
}
}
output {
if [type] == “access” {
elasticsearch {
hosts => [“192.168.180.101:9200”]
index => “apache_access-%{+YYYY.MM.dd}”
}
}
if [type] == “error” {
elasticsearch {
hosts => [“192.168.180.101:9200”]
index => “apache_error-%{+YYYY.MM.dd}”
}
}
}
4.编写脚本
vim /elk.sh
#!/bin/bash
/usr/share/logstash/bin/logstash -f /etc/logstash/conf.d/apache_log.conf
chmod a+x /elk.sh
. /elk.sh &
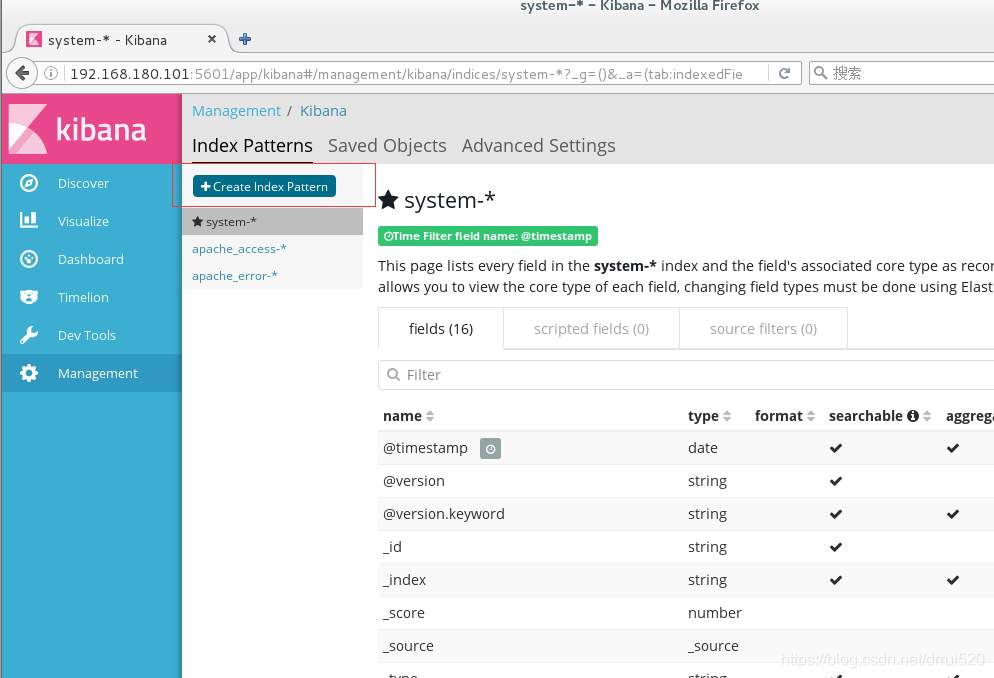
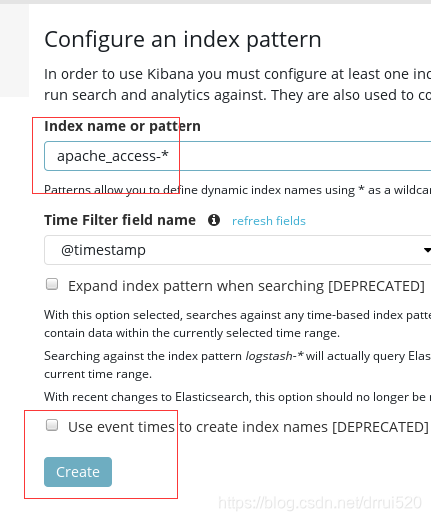
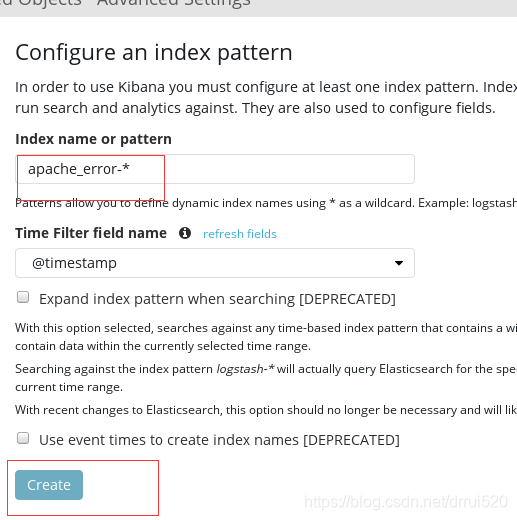
5.登录kibana,单击create index pattern

扩展部分
集中式日志分析平台 - ELK Stack - 安全解决方案 X-Pack:
http://www.jianshu.com/p/a49d93212eca
https://www.elastic.co/subscriptions
Elastic stack演进:
http://70data.net/1505.html
基于kafka和elasticsearch,linkedin构建实时日志分析系统:
http://t.cn/RYffDoE
elastic stack 使用redis作为日志缓冲:
http://blog.lishiming.net/?p=463
ELK+Filebeat+Kafka+ZooKeeper 构建海量日志分析平台:
https://www.cnblogs.com/delgyd/p/elk.html
关于elk+zookeeper+kafka 运维集中日志管理:
https://www.jianshu.com/p/d65aed756587
