一、函数
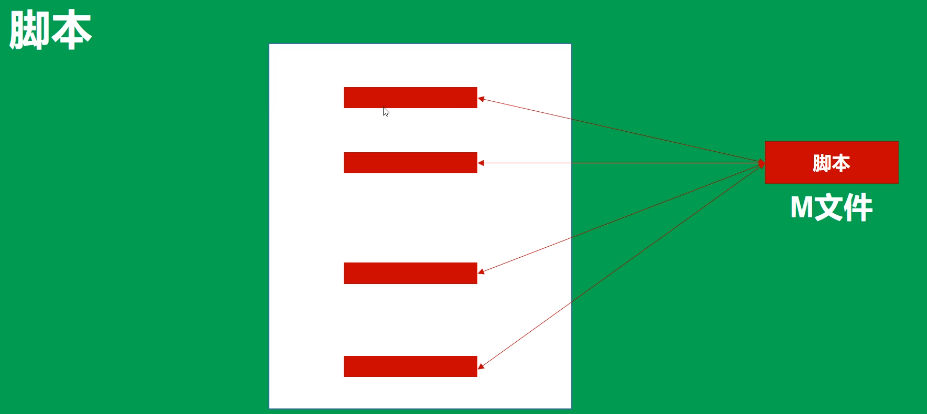
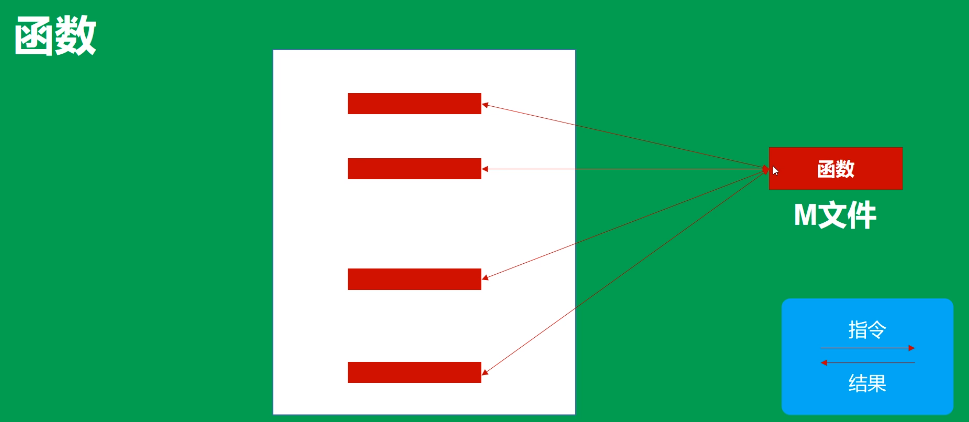
1、M文件
有脚本文件和函数两种。
2、脚本文件
3、函数文件
二、绘图基础
1、line函数
(1)line(x,y):用直线将点连接起来
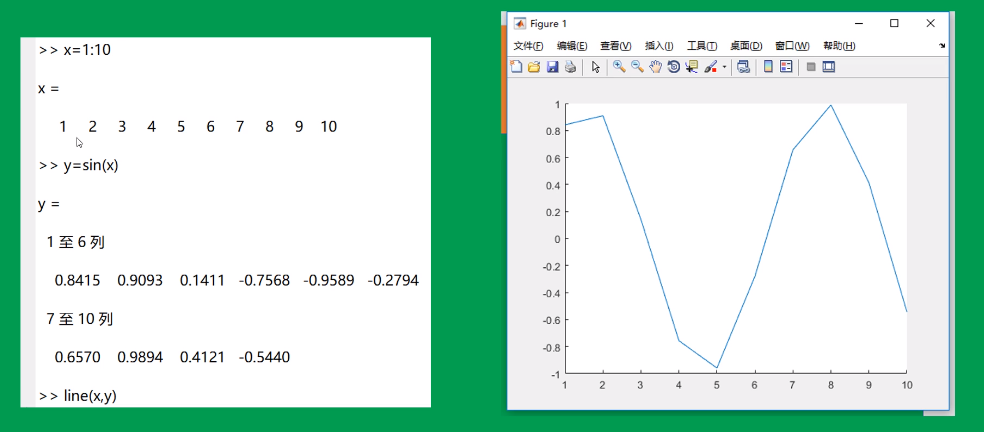
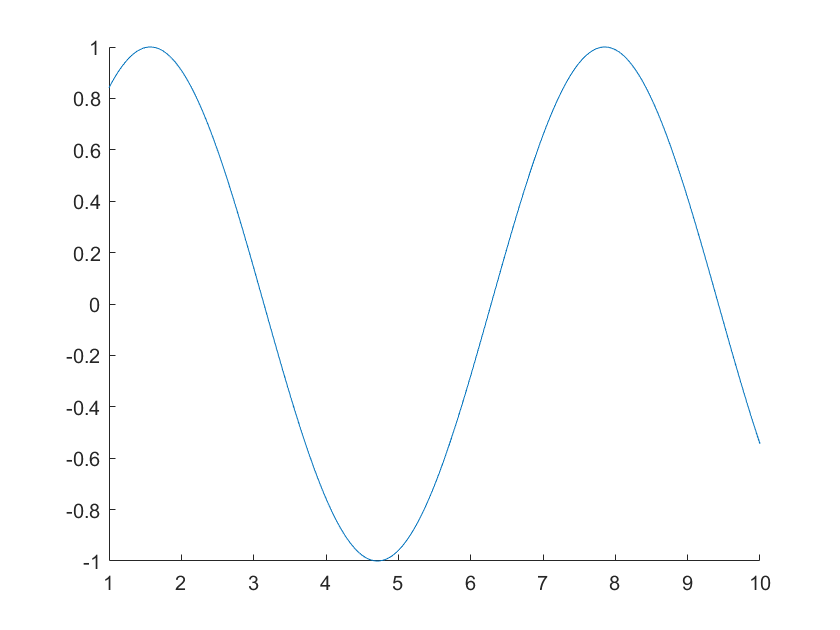
(2)函数图的绘制
% line
x = 1:0.01:10;
y = sin(x);
line(x,y)
2、plot函数
(1)语法结构
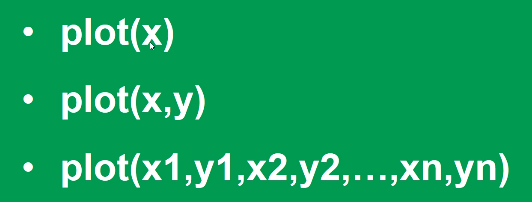
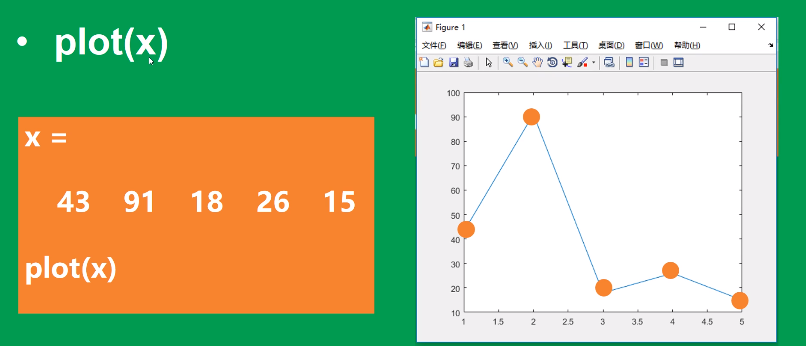
(2)plot(x)
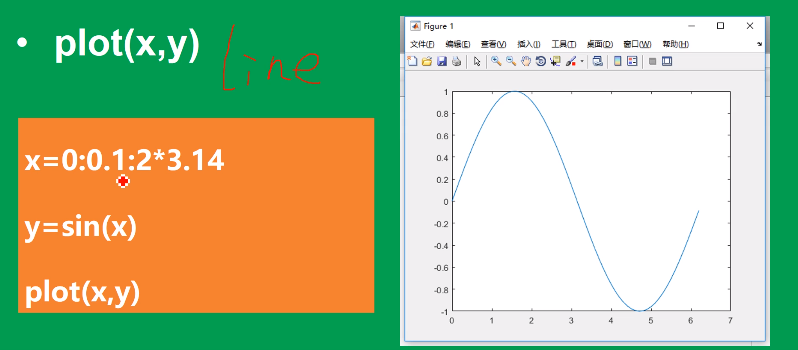
(3)plot(x,y)
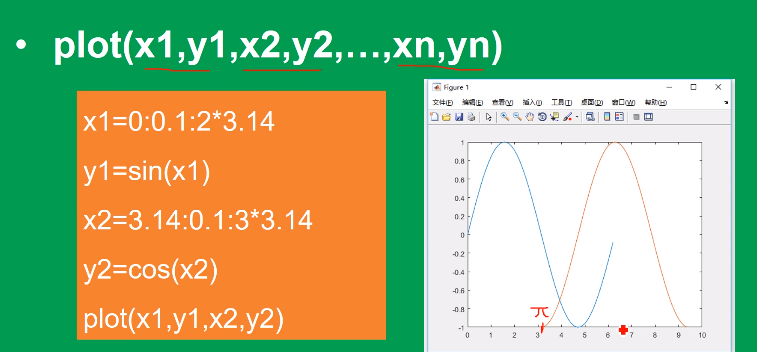
(4)plot(x1,y1,x2,y2,...xn,yn)
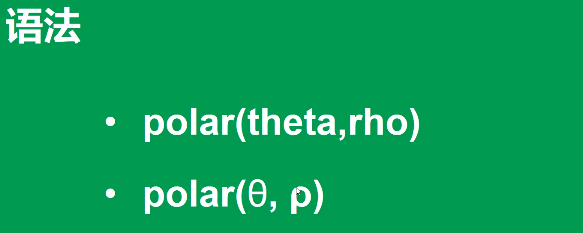
3、polar函数
极坐标下的绘图函数
(1)语法结构
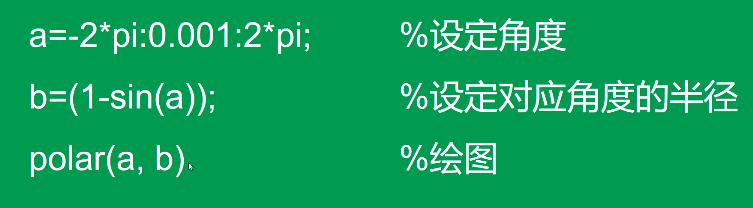
(2)绘图
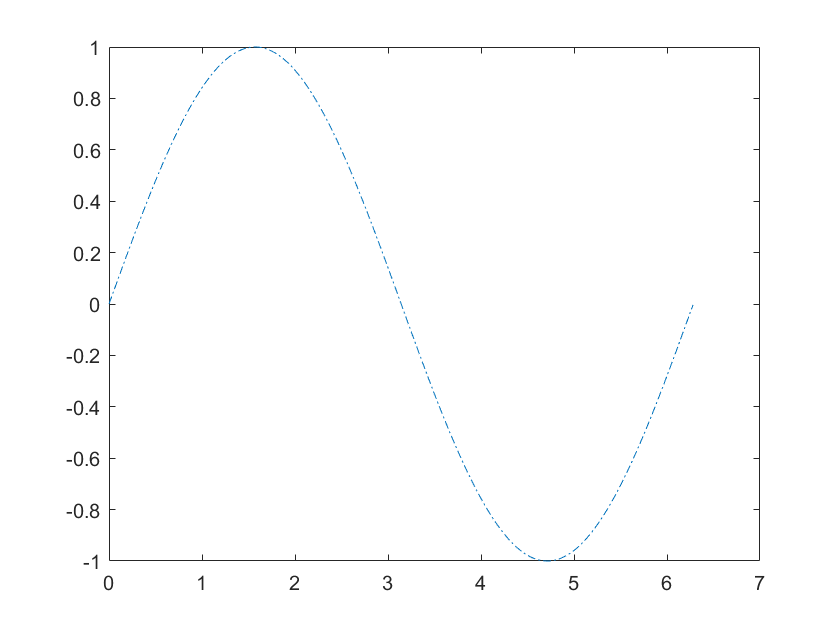
4、线型与线的颜色控制
(1)线的格式
plot(x,y,线的格式)
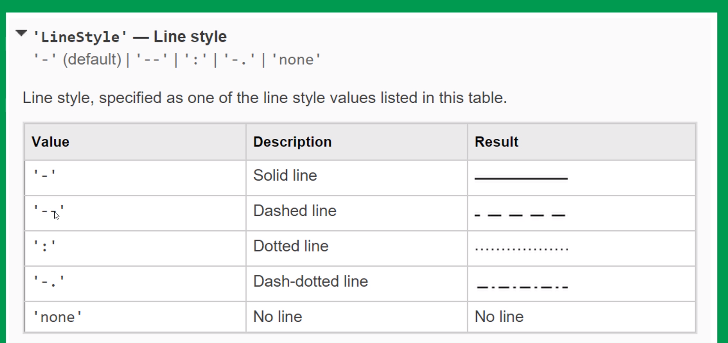
x = 0:0.01:2*3.14;
y = sin(x);
plot(x,y,'linestyle','-.');% 可以不需要‘linestyle’,除非用none时
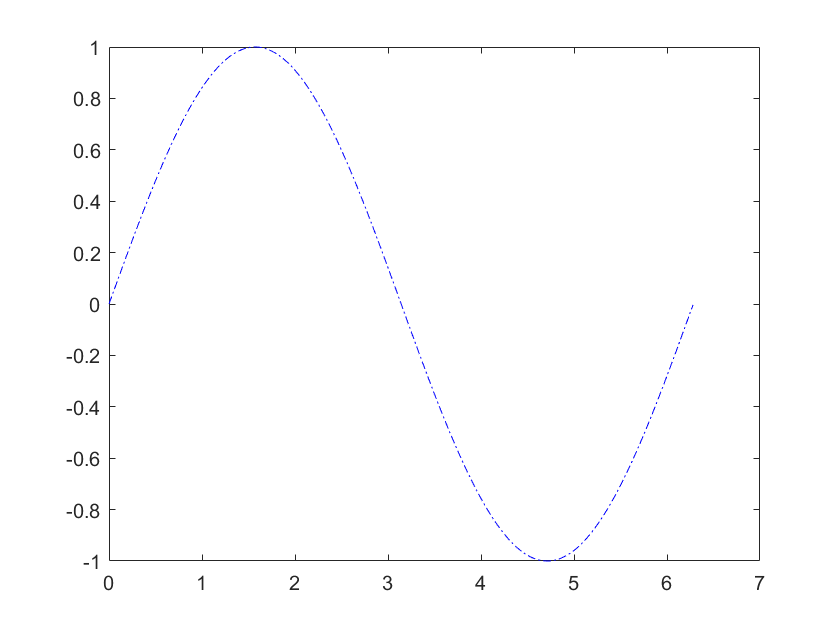
(2)线的颜色
plot(x,y,线的颜色)
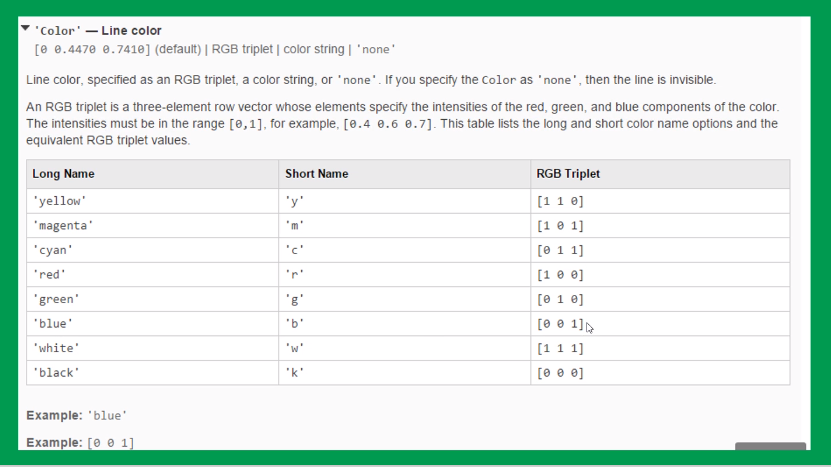
% 线的颜色
x = 0:0.01:2*3.14;
y = sin(x);
% plot(x,y,'color','y');
% plot(x,y,'color','blue');
% plot(x,y,'-.b');
plot(x,y,'b-.');
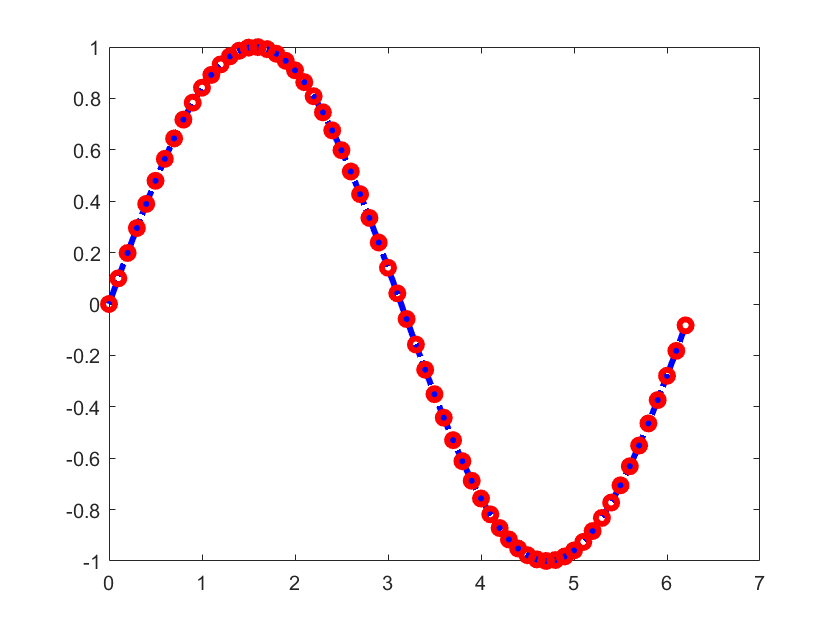
5、数据点的格式
plot(x,y,数据点的格式)
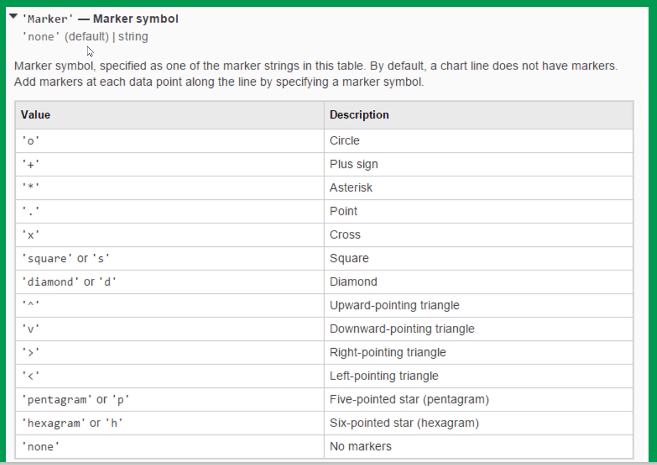
% 数据点的格式
x = 0:0.1:2*3.14;
y = sin(x);
% plot(x,y,'marker','+');
% plot(x,y,'marker','*');
% plot(x,y,'marker','v','color','r');
plot(x,y,'o-.r');
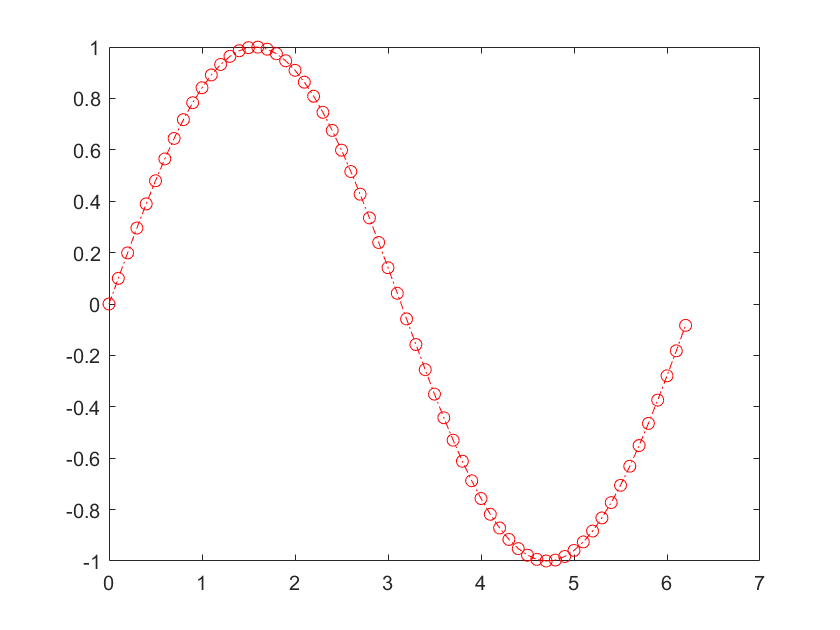
6、曲线其他格式
plot(x,y,格式)
plot(x,y,属性名称,属性值)——属性名称不能省略
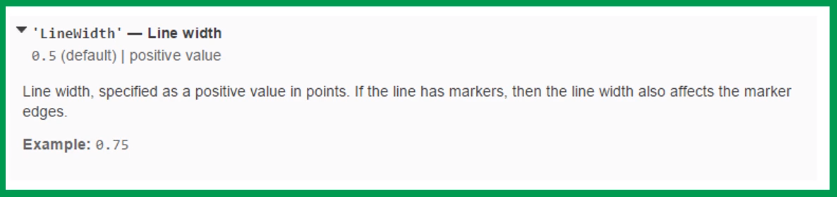
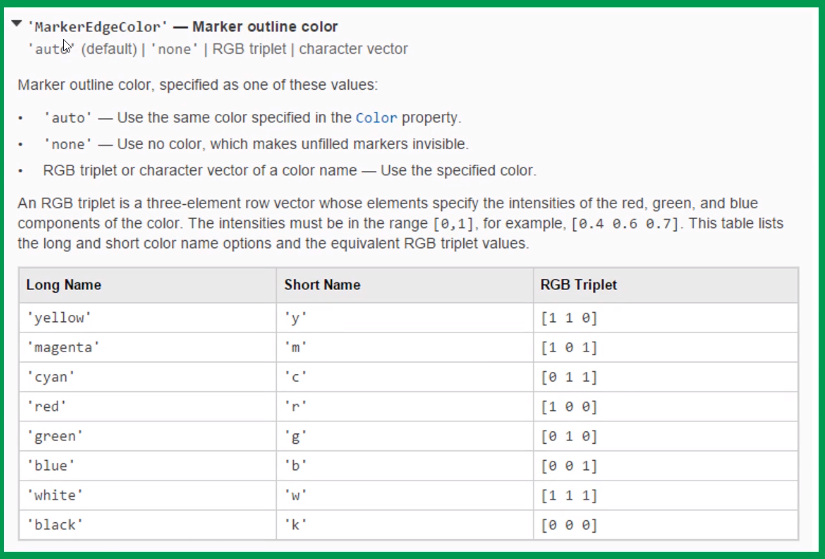
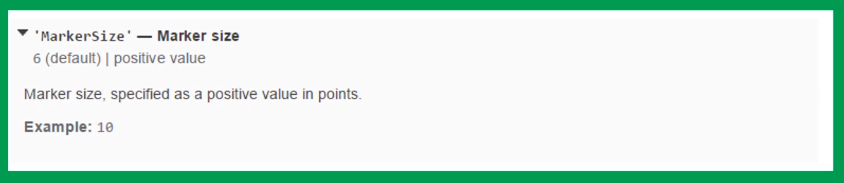
% 曲线其他格式
x = 0:0.1:2*pi;
y = sin(x);
% plot(x,y,'o','markeredgecolor','r');
plot(x,y,'o-.b','markeredgecolor','r','linewidth',3);
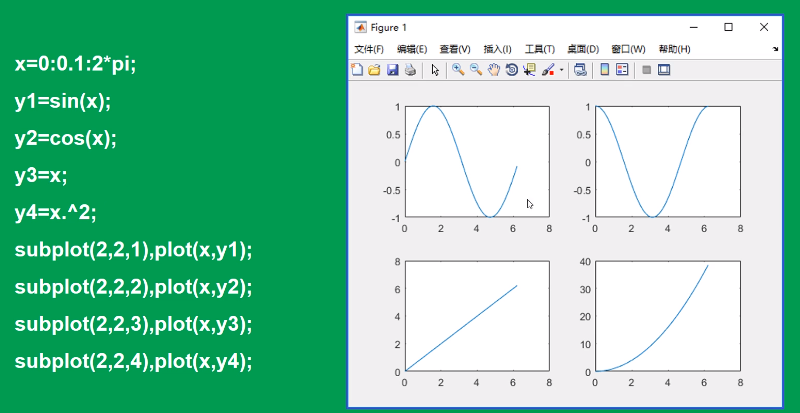
7、子图绘制subplot
subplot(x,y,i)——i表示绘制第几个图,x,y代表几行几列。
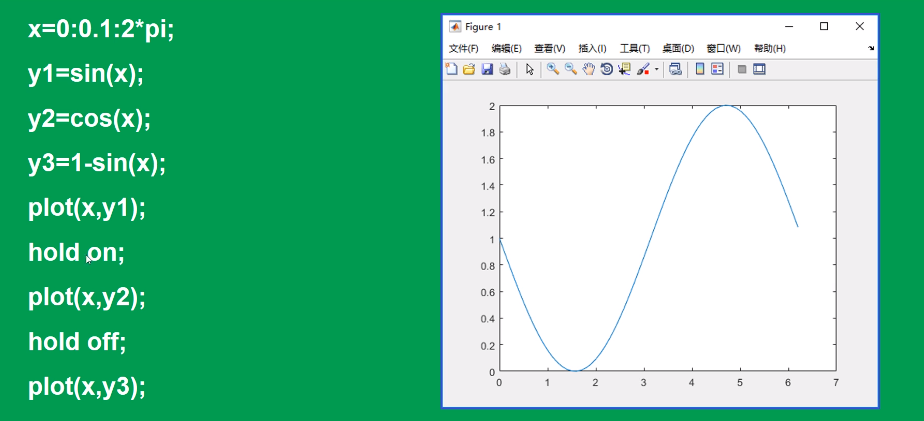
8、叠加绘图模式
hold on;
hold off;
9、设置坐标轴axis
(1)坐标轴范围
axis([X轴范围,Y轴范围]):axis([-100 100,-100,100])
axis auto:自动调整
axis manual:在叠加绘图中使用较多
axis tight:紧凑
x = 0:0.1:4*pi;
y = sin(x);
x2 = -100:100;
y2 = cos(x2);
plot(x,y);axis manual;
hold on;
plot(x2,y2);
(2)坐标轴比例
axis equal :横坐标与纵坐标单位长度一致。
axis square:正方形比例
axis normal:自动调整,默认
x = 0:0.1:4*pi;
y = sin(x);
plot(x,y);axis tight equal;
(3)坐标轴关闭
axis off
10、坐标轴刻度
set(gca,'xTick',刻度); ——gca当前坐标
set(gca,'xTickLable',刻度标签);

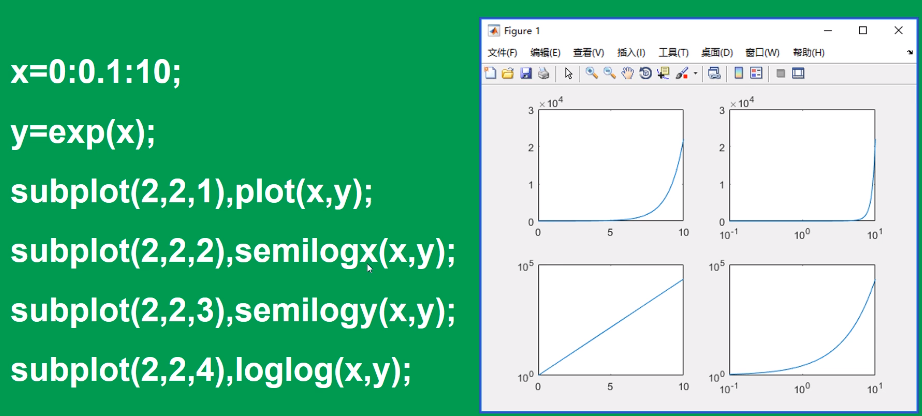
11、对数坐标
semilogx——X轴使用对数;
semilogy——Y轴使用对数;
loglog——XY轴均使用对数;
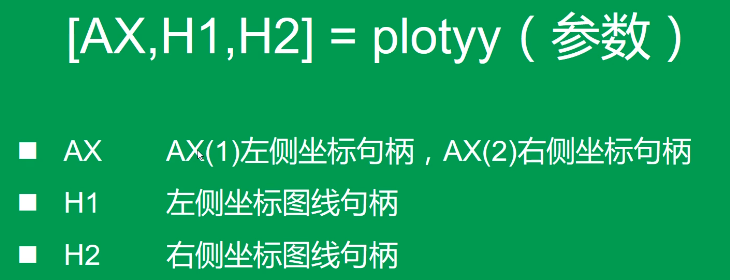
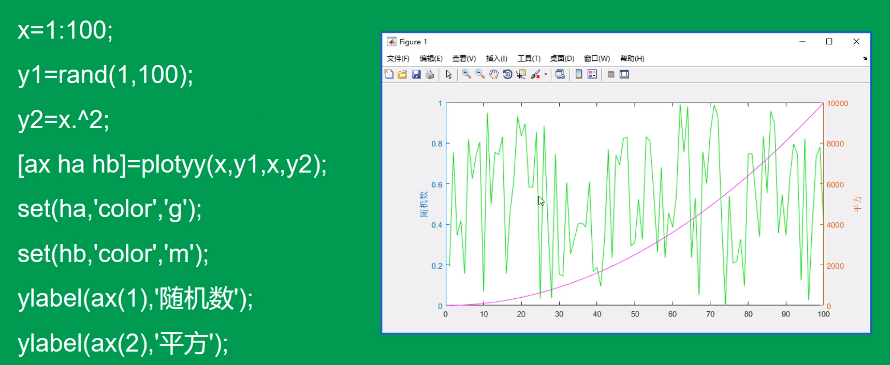
12、双坐标
(1)plotyy(X1,Y1,X2,Y2)
(2)
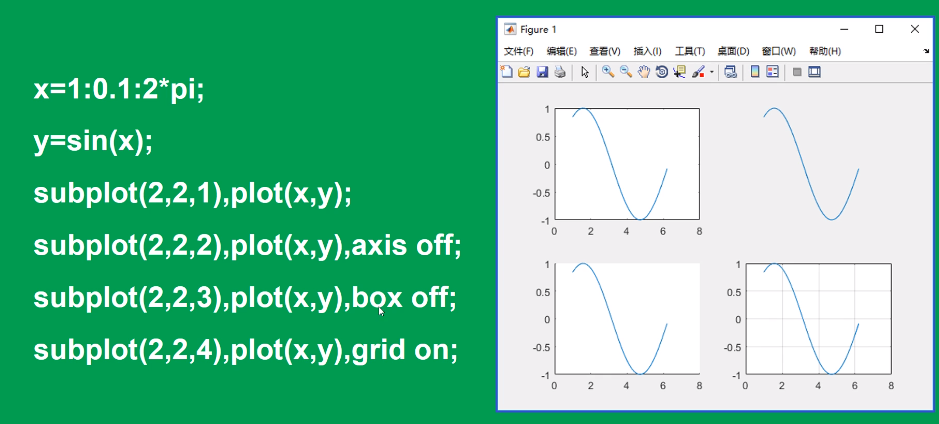
13、绘图开关
axis on / axis off;
box on / box off;
grid on /grid off;