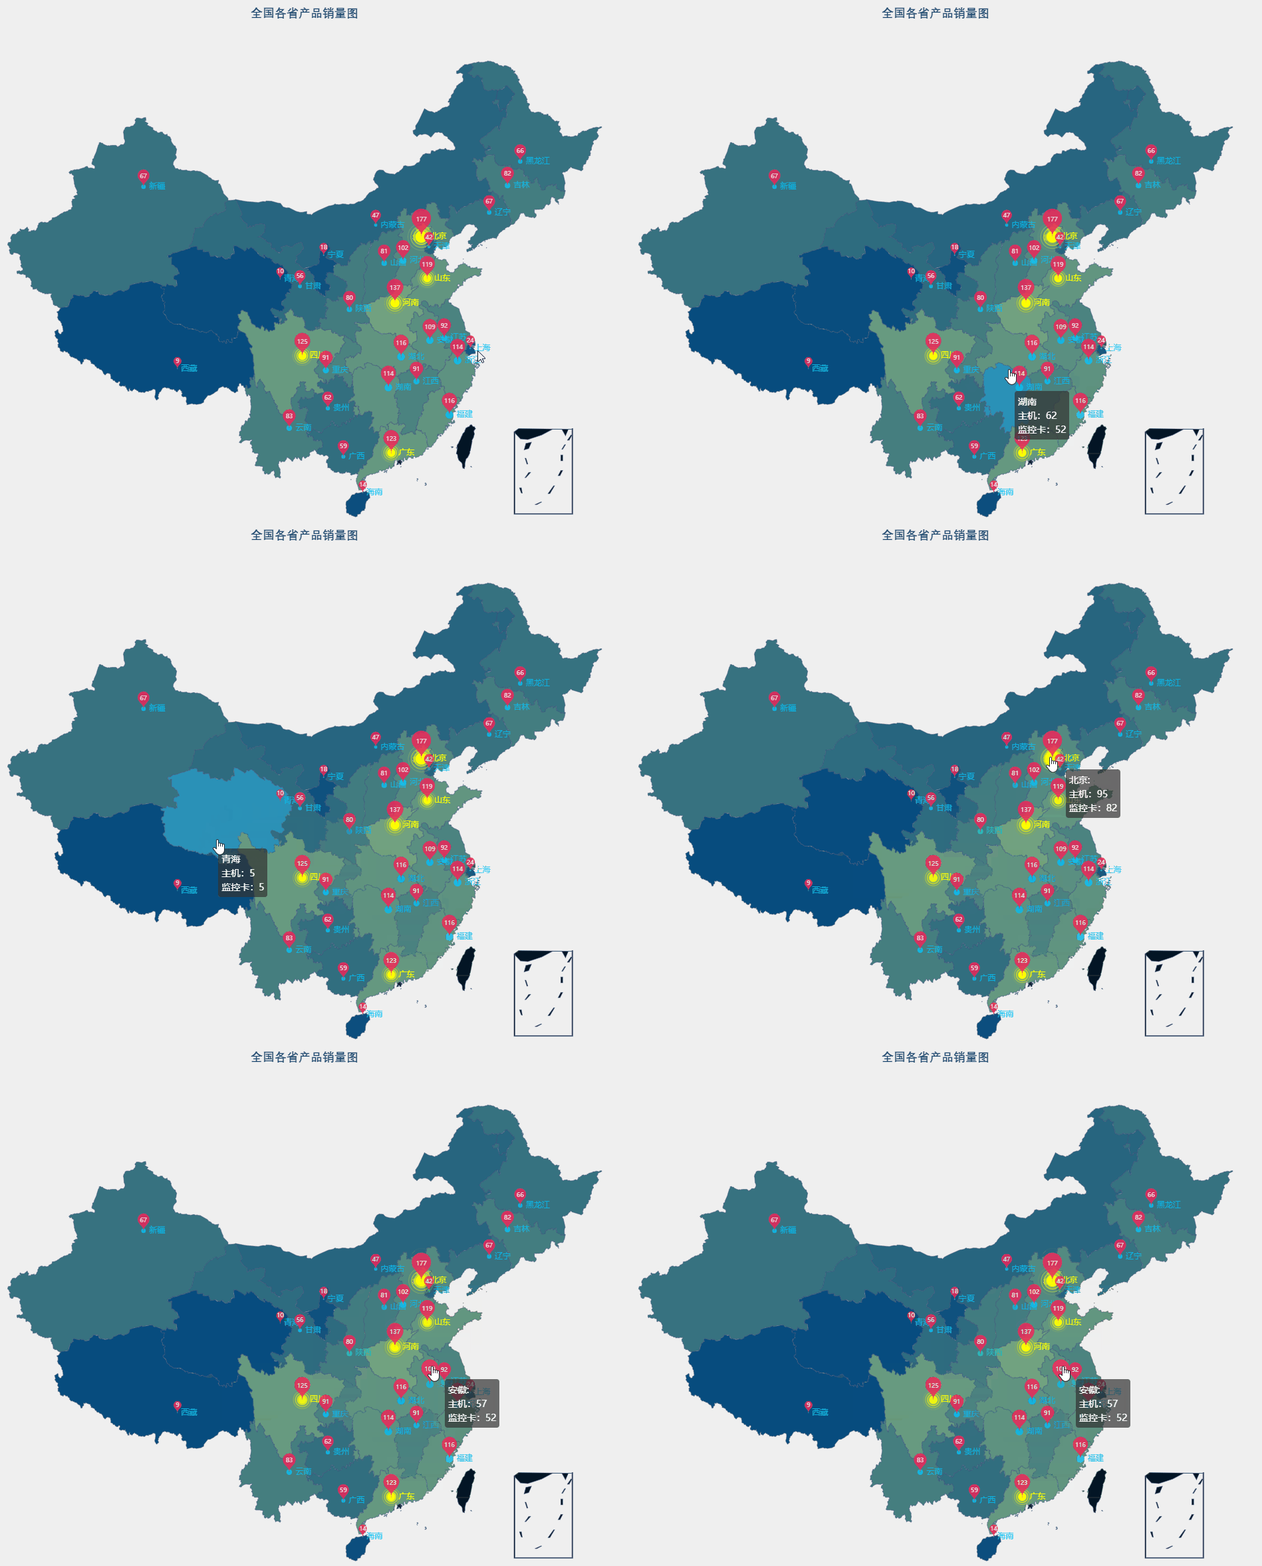
1、使用特效散点图实现产品出货TOP5显示;
2、实现自定义悬浮提示框;
如下图所示:

实现步骤
一、在vue中安装echarts
npm install echarts
二、在vue组件中使用echarts
1、在组件中先引入echarts;
import echarts from 'echarts' // 引入echarts中国地图数据
2、在组件中引入中国地图数据;
require('echarts/map/js/china');
提示:地图类的echarts实现是需要额外引入地图数据。
见官网:https://echarts.baidu.com/option.html#geo.map
3、在组件页面内定一个标签来渲染地图;
<div id="productMap" style='width:600px;height:500px;'></div>
4、初始化 echarts 实例和指定配置参数;
var vm = new Vue({
  el: '#productMap',
  data: {
    name_title: "全国各省产品销量图",
	subname: '',
	nameColor: "rgb(33, 75, 113)",
	name_fontFamily: '等线',
	subname_fontSize: 15,
	name_fontSize = 18,
	max: 480,
    min: 9; // todo
	maxSize4Pin: 100,//散点图最大尺寸
    minSize4Pin: 20;//散点图最小尺寸
	mapName: 'china',
	geoCoordMap: {},
	chinaChart: echarts.init(document.getElementById('productMap'));// 初始化echarts实例
  },
  methods: {
    getGeoCoordMap: function () {
      /*获取地图数据*/
		let mapFeatures = echarts.getMap(this.mapName).geoJson.features;
		this.chinaChart.hideLoading();
		mapFeatures.forEach(function(v) {
		    // 地区名称
		    let name = v.properties.name;
		    // 地区经纬度
		    geoCoordMap[name] = v.properties.cp;
		});
	    return this.geoCoordMap;
    },
    convertData: function(data) {
	    let res = [];
	    for (let i = 0; i < data.length; i++) {
	        var geoCoord = this.geoCoordMap[data[i].name];
	        if (geoCoord) {
	            res.push({
	                name: data[i].name,
	                value: geoCoord.concat(data[i].value),
	            });
	        }
	    }
	    return res;
	},
	getData: function(){
		//数据从接口中获取,格式:
		/*
		data = [
			{
		        name: "北京",
		        value: 177
		    },
		    ...
	    ]
		*/
		return data;
	},
	getToolTipData: function(){
		//数据从接口中获取
		let data = this.getData();
		let toolTipData = {};
		//通过解析data,返回toolTipData数据
		//格式:
		/*
		data = [[{
	        name: "北京",
	        value: [
		        {
		            name: "主机",
		            value: 95
		        }, {
		            name: "监控卡",
		            value: 82
		        }]
		    },
		    ...
		 ];
		*/
		return toolTipData;
	}
 },
 mounted () {挂载完毕后进行初始化地图数据
  this.chinaChart.showLoading();
  // 进行相关配置
  this.chartOption = {
  title: {
        text: this.name_title,
        subtext: this.subname,
        x: 'center',
        textStyle: {
            color: this.nameColor,
            fontFamily: this.name_fontFamily,
            fontSize: this.name_fontSize
        },
        subtextStyle: {
            fontSize: this.subname_fontSize,
            fontFamily: this.name_fontFamily
        }
    },
    tooltip: {
        trigger: 'item',
        formatter: function(params) {
            if (typeof(params.value)[2] == "undefined") {
                let toolTiphtml = '';
                let toolTipData = this.getToolTipData();
                for (var i = 0; i < toolTipData.length; i++) {
                    if (params.name == toolTipData[i].name) {
                        toolTiphtml += toolTipData[i].name + '<br>'
                        for (var j = 0; j < toolTipData[i].value.length; j++) {
                            toolTiphtml += toolTipData[i].value[j].name + ':' + toolTipData[i].value[j].value + "<br>"
                        }
                    }
                }
                return toolTiphtml;
            } else {
                let toolTiphtml = '';
                for (var i = 0; i < toolTipData.length; i++) {
                    if (params.name == toolTipData[i].name) {
                        toolTiphtml += toolTipData[i].name + ':<br>'
                        for (var j = 0; j < toolTipData[i].value.length; j++) {
                            toolTiphtml += toolTipData[i].value[j].name + ':' + toolTipData[i].value[j].value + "<br>"
                        }
                    }
                }
                return toolTiphtml;
            }
        }
    },
    visualMap: {
        show: true,
        min: 0,
        max: 200,
        left: 'left',
        top: 'bottom',
        text: ['高', '低'], // 文本,默认为数值文本
        calculable: true,
        seriesIndex: [1],
        inRange: {
            color: ['#00467F', '#A5CC82'] // 蓝绿
        }
    },
    geo: {
        show: true,
        map: this.mapName,
        label: {
            normal: {
                show: false
            },
            emphasis: {
                show: false,
            }
        },
        roam: true,
        itemStyle: {
            normal: {
                areaColor: '#031525',
                borderColor: '#3B5077',
            },
            emphasis: {
                areaColor: '#2B91B7',
            }
        }
    },
    series: [{
            name: '散点',
            type: 'scatter',
            coordinateSystem: 'geo',
            data: this.convertData(this.getData()),
            symbolSize: function(val) {
                return val[2] / 10;
            },
            label: {
                normal: {
                    formatter: '{b}',
                    position: 'right',
                    show: true
                },
                emphasis: {
                    show: true
                }
            },
            itemStyle: {
                normal: {
                    color: '#05C3F9'
                }
            }
        },
        {
            type: 'map',
            map: this.mapName,
            geoIndex: 0,
            aspectScale: 0.75, //长宽比
            showLegendSymbol: false, // 存在legend时显示
            label: {
                normal: {
                    show: true
                },
                emphasis: {
                    show: false,
                    textStyle: {
                        color: '#fff'
                    }
                }
            },
            roam: true,
            itemStyle: {
                normal: {
                    areaColor: '#031525',
                    borderColor: '#3B5077',
                },
                emphasis: {
                    areaColor: '#2B91B7'
                }
            },
            animation: false,
            data: data
        },
        {
            name: '点',
            type: 'scatter',
            coordinateSystem: 'geo',
            symbol: 'pin', //气泡
            symbolSize: function(val) {
                var a = (this.maxSize4Pin - this.minSize4Pin) / (this.max - this.min);
                var b = this.minSize4Pin - a * this.min;
                b = this.maxSize4Pin - a * this.max;
                return a * val[2] + b;
            },
            label: {
                normal: {
                    show: true,
                    textStyle: {
                        color: '#fff',
                        fontSize: 9,
                    }
                }
            },
            itemStyle: {
                normal: {
                    color: '#F62157', //标志颜色
                }
            },
            zlevel: 6,
            data: this.convertData(data),
        },
        {
            name: 'Top 5',
            type: 'effectScatter',
            coordinateSystem: 'geo',
            data: this.convertData(this.getData().sort(function(a, b) {
                return b.value - a.value;
            }).slice(0, 5)),
            symbolSize: function(val) {
                return val[2] / 10;
            },
            showEffectOn: 'render',
            rippleEffect: {
                brushType: 'stroke'
            },
            hoverAnimation: true,
            label: {
                normal: {
                    formatter: '{b}',
                    position: 'right',
                    show: true
                }
            },
            itemStyle: {
                normal: {
                    color: 'yellow',
                    shadowBlur: 10,
                    shadowColor: 'yellow'
                }
            },
            zlevel: 1
        },
    ]
  };

  // 使用刚指定的配置项和数据显示地图数据
  this.chinachart.setOption(this.chartOption)
