最简单词云图
from pyecharts.charts import WordCloud
from pyecharts.globals import SymbolType
words = [    ("能天使", 10000),    ("拉普兰德", 6181),    ("艾雅法拉", 4386),    ("银灰", 4055),
    ("德克萨斯", 2467),    ("麦哲伦", 2244),    ("伊芙利特", 1868),    ("推进之王", 1484),
    ("煌", 1112),    ("黑", 865),    ("赫拉格", 847),    ("风笛", 582),    ("莫斯提玛", 555),
    ("空", 550),    ("豆子龙", 462),    ("斯卡蒂", 366),    ("陨星", 360),    ("白金之星", 282),
    ("天火", 273),    ("塞雷亚", 265),    ("星熊", 569),    ("闪灵", 3598),    ("夜莺", 1889),
]
(
    WordCloud()
    .add("", words, word_size_range=[20, 100], shape=SymbolType.DIAMOND)
    .render()
)

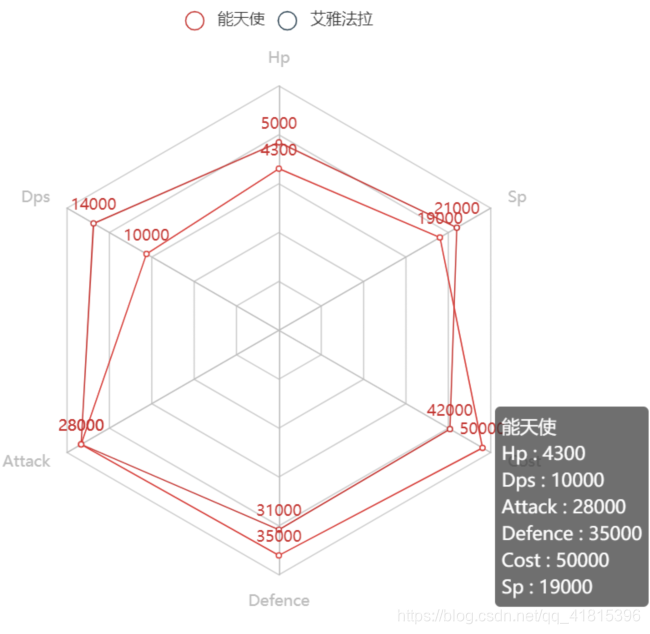
最简单雷达图
from pyecharts import options as opts
from pyecharts.charts import Radar

v1 = [[4300, 10000, 28000, 35000, 50000, 19000]]
v2 = [[5000, 14000, 28000, 31000, 42000, 21000]]
c = (
    Radar()
    .add_schema(
        schema=[
            opts.RadarIndicatorItem(name="Hp", max_=6500),
            opts.RadarIndicatorItem(name="Dps", max_=16000),
            opts.RadarIndicatorItem(name="Attack", max_=30000),
            opts.RadarIndicatorItem(name="Defence", max_=38000),
            opts.RadarIndicatorItem(name="Cost", max_=52000),
            opts.RadarIndicatorItem(name="Sp", max_=25000),
        ]
    )
    .add("能天使", v1)
    .add("艾雅法拉", v2)
    .render()
)
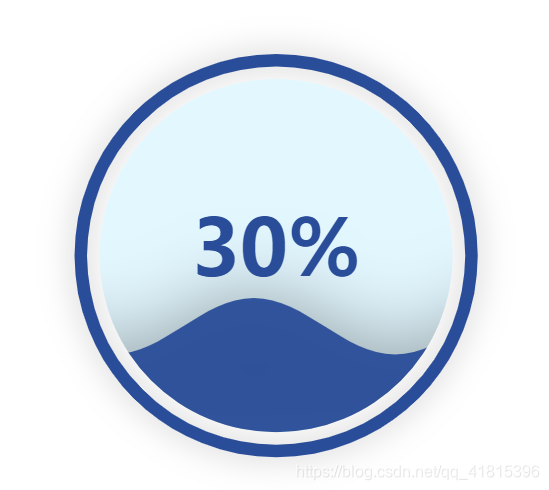
水滴球
from pyecharts.charts import Liquid

c = (
    Liquid()
    .add("",
         [0.3],# 数值
         is_outline_show = True, # 是否显示外框
         shape = "circle" )# 选择形状
    .render()
)