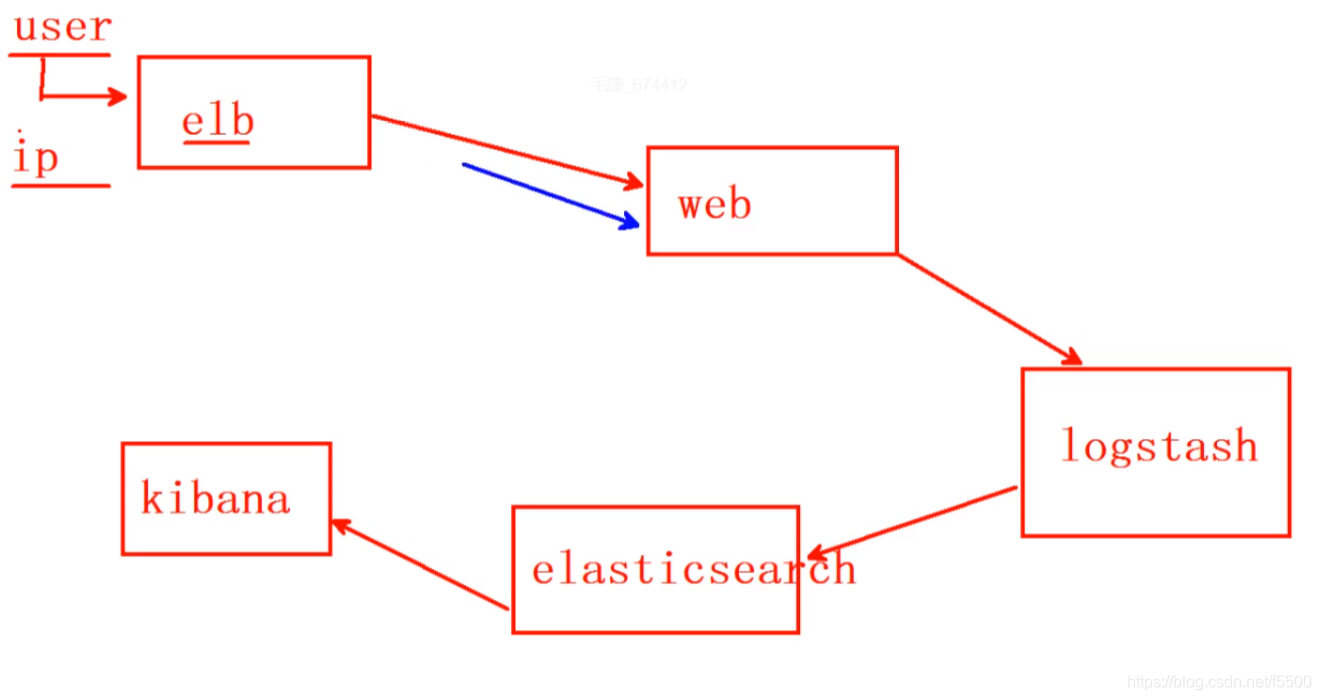
ELK整体工作流程
ELK是一套解决方案,是三个软件产品的首字母的缩写
ELK分别代表
Elasticsearch:负责日志检索和储存
Logstash:负责日志的收集和分析、处理
Kibana:负责日志的可视化
ELK组件在海量日志系统的运维中,可用于解决:
分布式日志数据集中式查询和管理
系统监控,包含系统硬件和应用各个组件的监控
故障排查
安全信息和事件管理
报表功能
搭建ELK如下:
一、安装ES集群(跳板机上操作)
操作环境,一台跳板机和五台elasticsearch集群机器
前提是已经有ansible、有elasticsearch.yml文件,否则只能手动安装
1.修改/etc/hosts文件,使其能够ping主机名
2.编写ansible剧本
[root@ecs-mao1 ~]# cat eess.yml
---
- hosts: eess   //节点
  tasks:
    - name: copy
      copy:
        src: /etc/hosts
        dest: /etc/hosts
        owner: root
        group: root
        mode: 0644
    - name: install
      yum:
        name: java-1.8.0-openjdk.x86_64,elasticsearch
        state: latest
    - name: es版本
      template:
        src: elasticsearch.yml
        dest: /etc/elasticsearch/elasticsearch.yml
        owner: bin
        group: wheel
        mode: 0644
      notify:
        - re
  handlers:
    - name: re
      service:
        name: elasticsearch
        state: started
        enabled: yes
template模块能够复制带有变量的文本
[root@ecs-mao1 ~]# cat elasticsearch.yml  | grep hostname
node.name: {{ ansible_hostname  }}
ansible_hostname是setup模块里面的,显示主机名
[root@ecs-mao1 ~]# ansible eess -m setup | grep hostname
        "ansible_hostname": "eess-0001",
        "ansible_hostname": "eess-0002",
3.运行剧本
[root@ecs-mao1 ~]# ansible-playbook eess.yml
其结果显示成功
4.测试结果(es集群操作)
[root@eess-0001 ~]# curl http://192.168.1.111:9200/_cluster/health?pretty //任意节点都可以
”status”: ”green“ 集群状态:绿色为正常、黄色表示有问题但不是很严重、红色表示严重故障
”number_of_nodes”: 5, 表示集群中节点的数量
二、安装HEAD等插件
所有的插件都在跳板机的ftp文件里面
插件装在哪一台机器上,只能在哪台机器上使用
安装插件
[root@ecs-mao1 ~]# cat es1.yml
---
- hosts: eess   //节点
  tasks:
   - name: XX
     shell: /usr/share/elasticsearch/bin/plugin install ftp://192.168.1.252/public/elasticsearch-head-master.zip
   - name: xx1
     shell: /usr/share/elasticsearch/bin/plugin install ftp://192.168.1.252/public/elasticsearch-kopf-master.zip
   - name: xx2
     shell: /usr/share/elasticsearch/bin/plugin install ftp://192.168.1.252/public/bigdesk-master.zip
[root@ecs-mao1 ~]# ansible-playbook es1.yml  //运行剧本
验证操作
[root@eess-0001 bin]# ./plugin  list    //查看安装的插件
Installed plugins in /usr/share/elasticsearch/plugins:
    - head
    - kopf
    - bigdesk
访问三个插件网页
[root@eess-0001 bin]$ firefox http://192.168.1.55:9200/_plugin/head
[root@eess-0001 bin]$ firefox   http://192.168.1.55:9200/_plugin/kopf
[root@eess-0001 bin]$ firefox  http://192.168.1.55:9200/_plugin/bigdesk
用命令建立索引
1.建立索引文件
[root@eess-0001 ~]# curl -X PUT "http://192.168.1.55:9200/index" -d '
> {
>     "settings":{
>     "index":{
>     "number_of_shards":5,
>     "number_of_replicas":1
>    }
>   }
> }'

[root@eess-0001 bin]$ firefox http://192.168.1.55:9200/_plugin/head  去该网页上查看是否有索引
2.增加数据
[root@eess-0001 ~]# curl -X PUT "http://192.168.1.111:9200/tedu/teacher/1" -d '{
> "职业":"诗人",
> "名字":"李白",
> "年代":"唐"
> }'
3.修改数据
[root@eess-0001 ~]# curl -X PUT "http://192.168.1.111:9200/tedu/teacher/1" -d '{
"doc":{
"年代": "唐代"
}
}'
4.查询数据
[root@eess-0001 ~]# curl -X GET "http://192.168.1.111:9200/tedu/teacher/3?pretty"
{
  "_index" : "tedu",
  "_type" : "teacher",
  "_id" : "3",
  "found" : false
}
5.删除数据
[root@eess-0001 ~]# curl -X DELETE "http://192.168.1.111:9200/tedu/teacher/3?pretty"
{
  "found" : false,
  "_index" : "tedu",
  "_type" : "teacher",
  "_id" : "3",
  "_version" : 1,
  "_shards" : {
    "total" : 2,
    "successful" : 2,
    "failed" : 0
  }
}
6.删除索引
删(DELETE)
curl -XDELETE http://集群任意节点:9200/索引名称/类型/id
curl -XDELETE http://192.168.1.111:9200/tedu/teacher/1
curl -XDELETE http://集群任意节点:9200/索引名称
curl -XDELETE http://192.168.1.111:9200/tedu
curl -XDELETE http://集群任意节点:9200/*
curl -XDELETE http://192.168.1.111:9200/
验证方法,都与上同
三、导入数据 (用于测试,可以忽略)
使用POST方式批量导入数据,数据格式为json,url 编码使用data-binary导入含有index配置的json文件
1、必须使用POST方式
2、数据格式必须是json
3、编码格式data-binary
4、使用关键字_bulk导入数据
[root@ecs-mao1 ~]# scp  /var/ftp/public/logs.jsonl.gz [email protected]:/root  //把导入传给es节点
[root@eess-0001 ~]# gzip -d logs.jsonl.gz
[root@eess-0001 ~]# ls
logs.jsonl
[root@eess-0001 ~]# curl -X POST "http://192.168.1.111:9200/_bulk"  \
> --data-binary @logs.jsonl
验证查看Elasticsearch网页
四、安装kibana
数据可视化平台工具
1、安装
yum install kibana
2、修改配置文件 /etc/hosts
192.168.1.51 es-0001
192.168.1.52 es-0002
192.168.1.53 es-0003
192.168.1.54 es-0004
192.168.1.55 es-0005
192.168.1.56 kibana
3、修改配置文件 /opt/kibana/config/kibana.yml
server.port: 5601
server.host: “0.0.0.0”
elasticsearch.url: “http://192.168.1.111:9200” //指定elasticsearch的地址
kibana.index: “.kibana”
kibana.defaultAppId: “discover”
elasticsearch.pingTimeout: 1500
elasticsearch.requestTimeout: 30000
elasticsearch.startupTimeout: 5000
4、启动服务
systemctl start kibana
systemctl enable kibana
5、查看验证 5601 端口
ss -ltun
五、 安装并配置Logstash
Logstash比较消耗资源,选择2CPU和4G的服务器
Logstash的配置文件需要自己配置
Logstash的工作结构

使用插件需要查看官方文档
https://www.elastic.co/guide/en/logstash/current/index.html
1.安装Logstash
[root@logstash ~]#  yum -y install java-1.8.0-openjdk
[root@logstash ~]# yum -y install logstash
[root@logstash ~]# touch /etc/logstash/logstash.conf     //创建配置文件
[root@logstash ~]#  /opt/logstash/bin/logstash  --version
logstash 2.3.4
[root@logstash ~]# /opt/logstash/bin/logstash-plugin  list   //查看插件
...
logstash-input-stdin    //标准输入插件
logstash-output-stdout    //标准输出插件
2.配置文件格式书写
[root@logstash ~]# cat /etc/logstash/logstash.conf
input{
  stdin{codec => "json"}
  file {
    path => ["/tmp/apache.log"]         //指定日志文件路径,这个是在本地
    sincedb_path => "/root/.sincedb"     //指定指针文件的保存路径(记录已读取文件的位置)
    start_position => "beginning"        //当没有指针文件时,默认从头开始读取
    type => "httplog"                    //标签
  }
  beats{                                 //监听5044端口,接收从5044发送过来的日志数据和标签,客户端会安装filebeat
    port => 5044                         //这属于远程接受日志信息,上面的属于本地

}
filter{
if [type] == "hlog" {                   //当收到标签apache_log时,就会如下操作
  grok {                                 //grok插件:解析各种非结构化的日志数据插件;
                                         //grok使用正则表达式把飞结构化的数据结构化
    match => { "message" => "%{COMBINEDAPACHELOG}" }  //使用作者写的正则
#/opt/logstash/vendor/bundle/jruby/1.9/gems/logstash-pattern-core-2.0.5/patterns/grok-patterns      //作者写的正则
  }}
}
output{
  stdout{ codec => "rubydebug" }         //输出设置为rubydebug
  if [type] == "hlog"{                  //当收到标签apache_log时,就会如下操作
  elasticsearch {                        //指定elasticsearch的地址;建立索引
                                         //当数据超过2000或者10秒时,发送给elasticsearch
    hosts => ["es-0001:9200", "es-0002:9200", "es-0003:9200"]
    index => "web-%{+YYYY.MM.dd}"
    flush_size => 2000                   //每当写2000字节的时候就写刷新一次
    idle_flush_time => 10                //空闲10秒就刷新一次
  }}

}
[root@logstash ~]# /opt/logstash/bin/logstash -f /etc/logstash/logstash.conf
//启动并测试
Settings: Default pipeline workers: 2
Pipeline main started
aa        //logstash 配置从标准输入读取输入源,然后从标准输出输出到屏幕
2018-09-15T06:19:28.724Z logstash aa
3.在web端安装
[root@ecs-ff35 ~]# yum -y install filebeat
[root@ecs-ff35 ~]# vim /etc/filebeat/filebeat.yml
 ..........
      paths:         //指定日志路径
        - /var/log/httpd/access_log
...........
 # elasticsearch:
 #  hosts: ["localhost:9200"]
............
  logstash:          //指定logstash服务器地址
    # The Logstash hosts
    hosts: ["192.168.1.117:5044"]
.........
document_type: hlog  //打标签

[root@ecs-ff35 ~]# systemctl start filebeat
验证:
在logstash服务器上开始logstash服务,用其他机器访问web,查看是否有显示,并查看是否上传到Elasticsearch服务器
[root@ecs-b486 ~]# /opt/logstash/bin/logstash -f /etc/logstash/logstash.conf
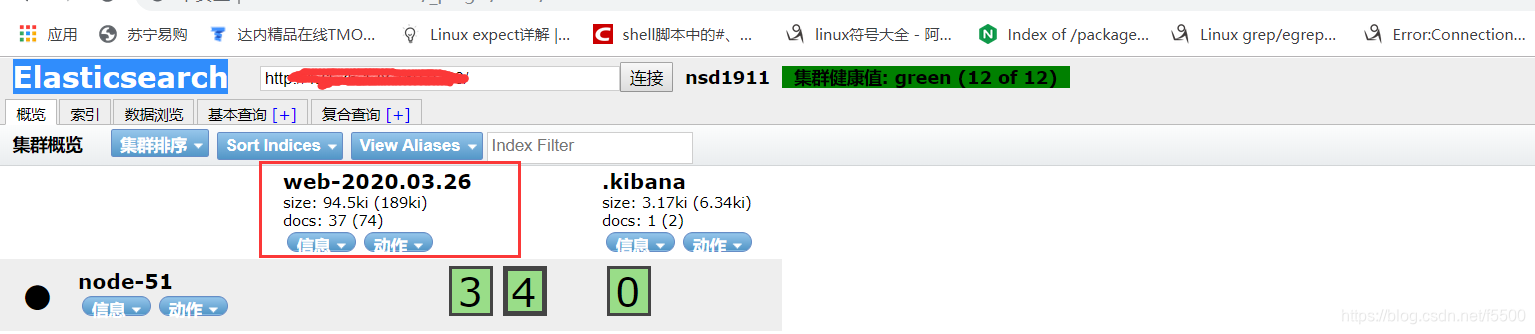
成功后再用kibana制作图表(IP地址+5601)
六、获取真实源IP
在华为云上使用负载均衡,看到的时转换后的IP,现需要查看真实IP
文档
https://support.huaweicloud.com/test-usermanual-elb/zh-cn_topic_0172675020.html
HTTP服务:
7层获取真实IP
1、在elb的监听器中设置使用 HTTP 协议
2、在后端apache中增加配置
[root@ecs-web ~]# cat /etc/httpd/conf.modules.d/00-remoteip.conf
LoadModule remote
ip_module modules/mod_remoteip.so
RemoteIPHeader X-Forwarded-For
RemoteIPInternalProxy 100.125.0.0/16
3、注释掉 00-base.conf 中的
#LoadModule remoteip_module modules/mod_remoteip.so
4、修改 httpd.conf 配置文件
LogFormat “%a %h %l %u %t “%r” %>s %b “%{Referer}i” “%{User-Agent}i”” combined
由于多出了一个IP,需要在logstash服务器上,修改grok的正则
5、测试配置文件语法没有问题的时候重启服务
apachectl -t
systemctl restart httpd
tail -f /var/log/httpd/access_log 查看日志
############################################################
nginx服务
:
重新编译添加 realip 参数
./configure --prefix=/usr/local/nginx --user=nginx --group=nginx --with-http_ssl_module --with-http_realip_module
编辑 nginx.conf 添加
set_real_ip_from 100.125.0.0/16;
real_ip_header X-Forwarded-For;
重启服务
/usr/local/nginx/sbin/nginx -s reload
############################################################
四层负载均衡
mkdir -p mkdir -p /lib/modules/
(uname -r)/extra/net/toa/
depmod -a
lsmod
modinfo toa
重启服务
/usr/local/nginx/sbin/nginx -s reload
