1. 配置基础环境
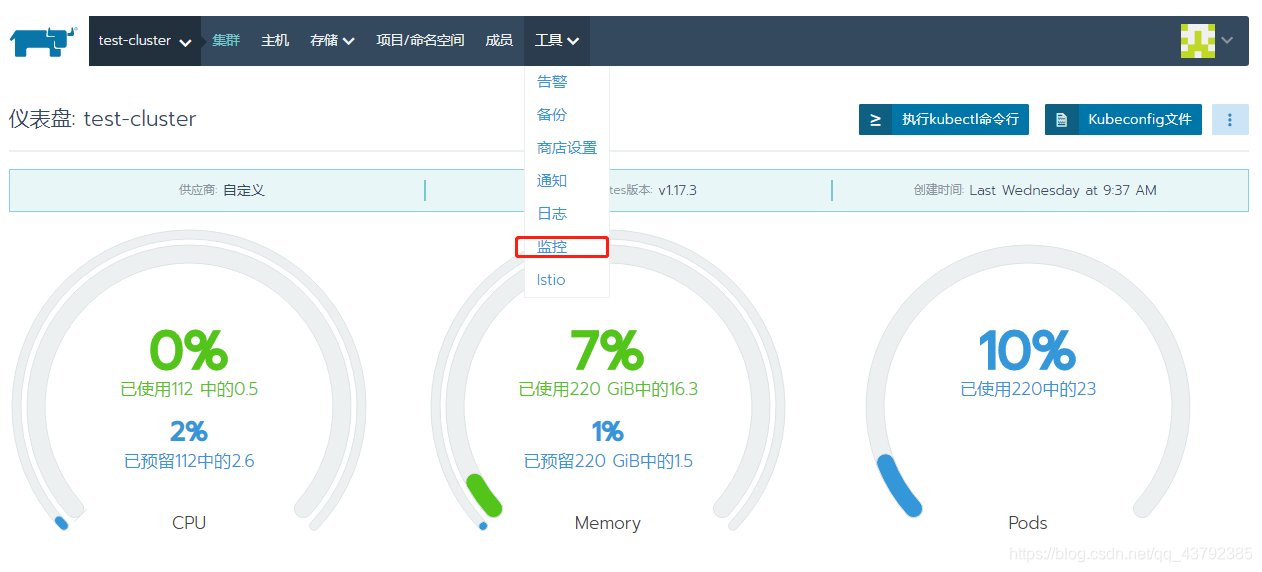
参考上篇博文Rancher2.x入门教程搭建环境,创建K8S集群并配置主机,点击集群进入集群界面,选择工具下的监控菜单
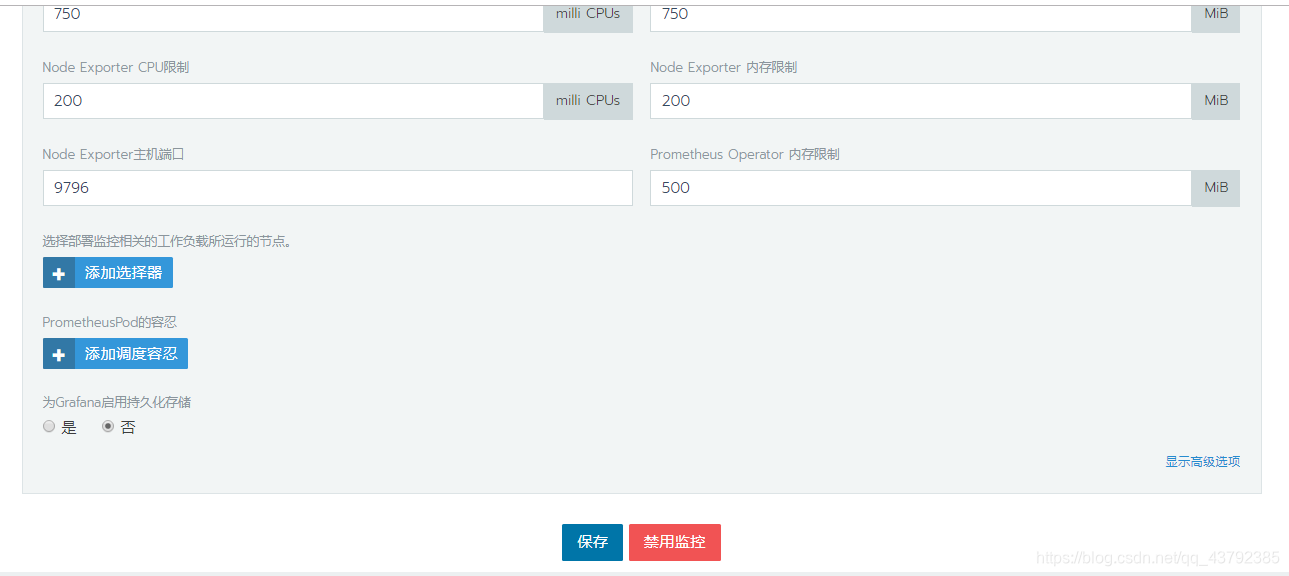
配置之后点击保存打开集群监控
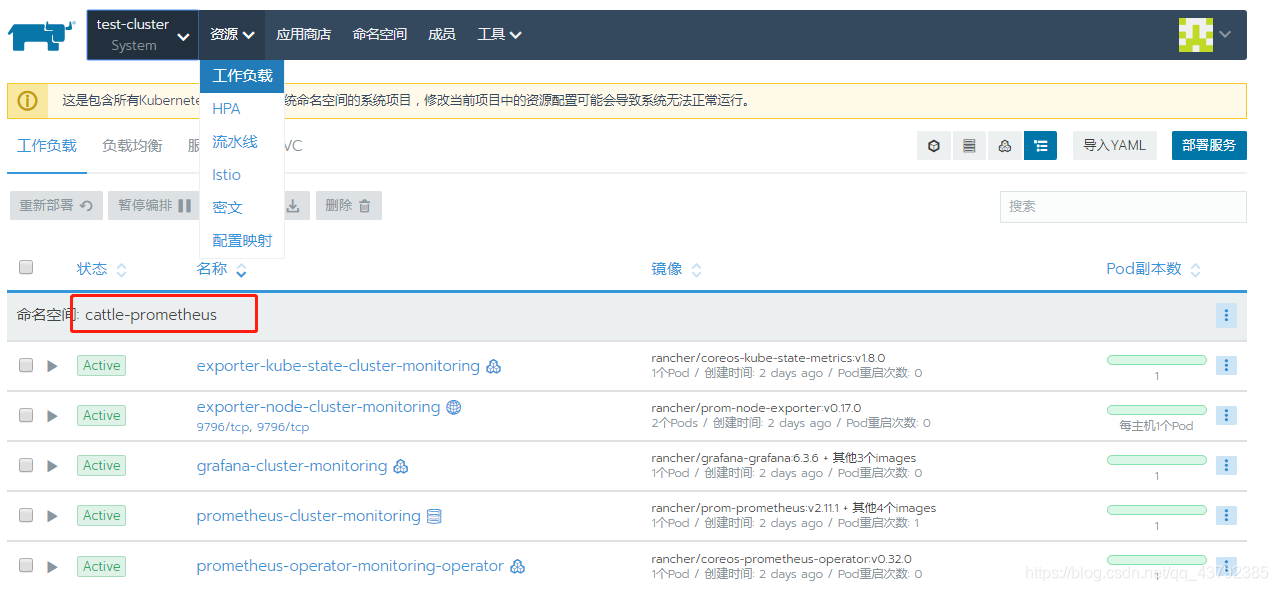
然后选择资源下的工作负载菜单,Rancher会自动添加cattle-prometheus命令空间,自动创建grafana、promethus、prometheus-operator等集群监控应用。
再次回到集群主界面,就能看到监控都多了Grafana的图标,点击即可进入Grafana界面
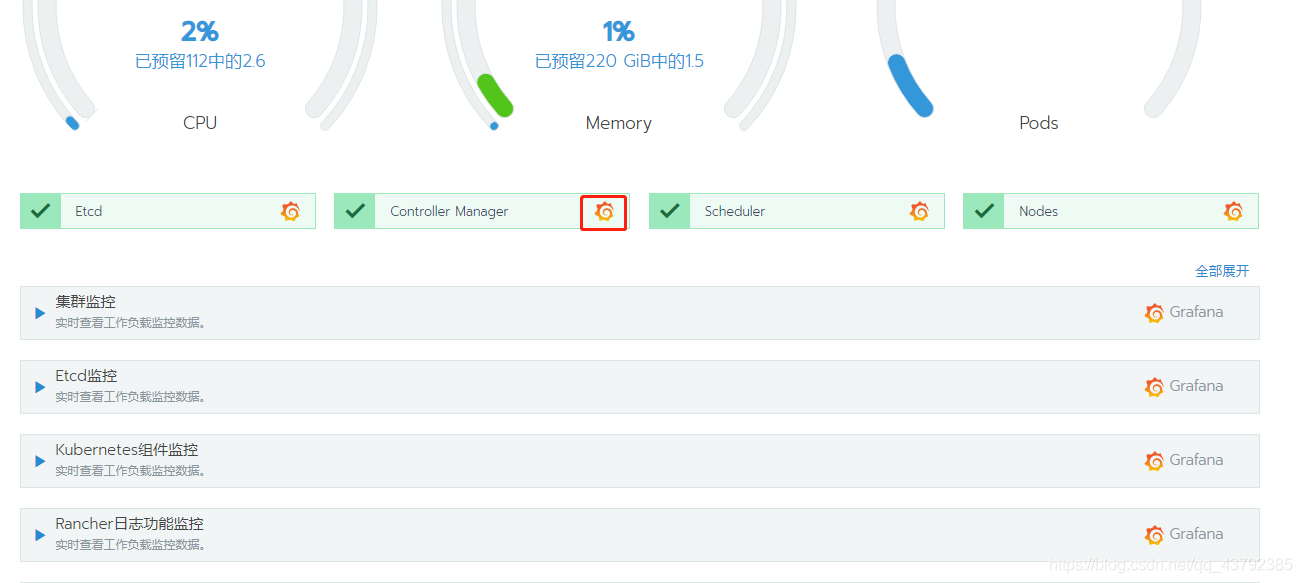
默认会创建pod、cluster、node、etcd、component等监控仪表盘

2. 添加NVIDIA插件
添加NVIDIA device plugin for Kubernetes,命令如下
kubectl create -f https://raw.githubusercontent.com/NVIDIA/k8s-device-plugin/1.0.0-beta4/nvidia-device-plugin.yml
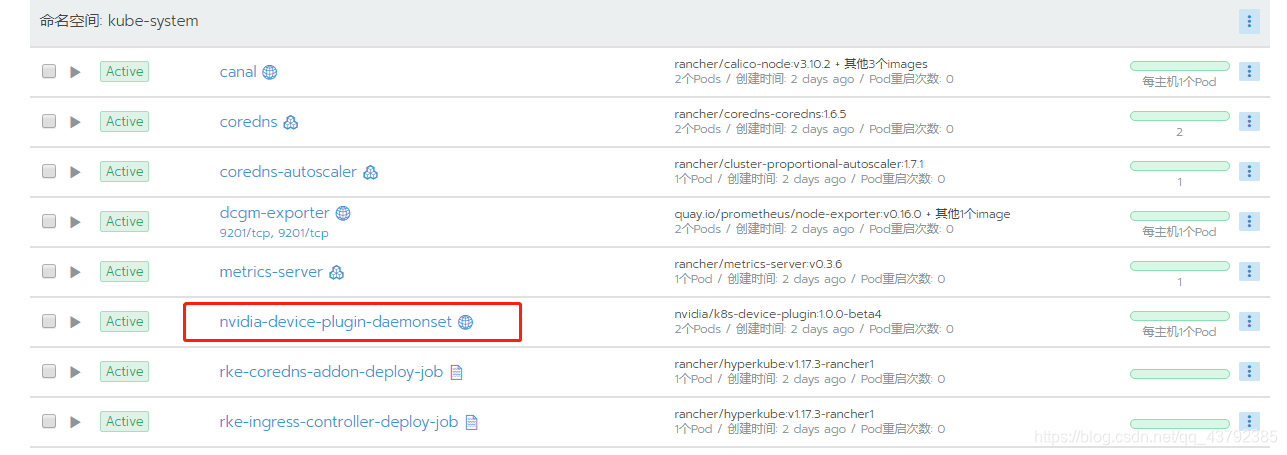
执行之后会在集群的system项目下的kube-system命名空间部署nvidia-device-plugin应用
3. 部署监控
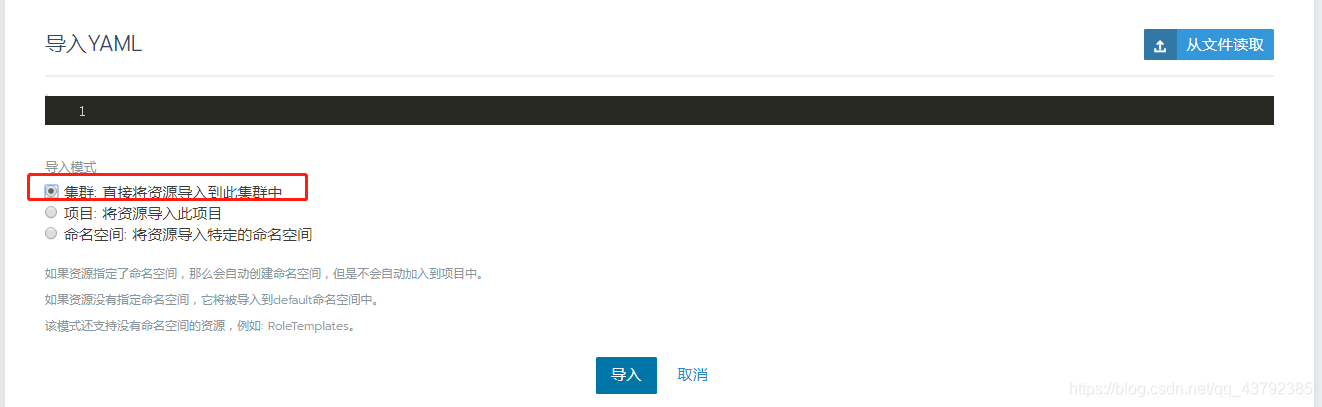
切换到集群system项目下,选择导入yaml,选择导入到集权,点击导入即可,具体配置在后面
3.1 dcgm-exporter配置
apiVersion: apps/v1
kind: DaemonSet
metadata:
  namespace: kube-system
  name: dcgm-exporter
spec:
  selector:
    matchLabels:
      app: dcgm-exporter
  template:
    metadata:
      labels:
        app: dcgm-exporter
      name: dcgm-exporter
    spec:
      nodeSelector:
        hardware-type: NVIDIAGPU
      containers:
      - image: quay.io/prometheus/node-exporter:v0.16.0
        name: node-exporter
        args:
        - "--web.listen-address=0.0.0.0:9201"
        - "--path.procfs=/host/proc"
        - "--path.sysfs=/host/sys"
        - "--collector.textfile.directory=/run/prometheus"
        - "--no-collector.arp"
        - "--no-collector.bcache"
        - "--no-collector.bonding"
        - "--no-collector.conntrack"
        - "--no-collector.cpu"
        - "--no-collector.diskstats"
        - "--no-collector.edac"
        - "--no-collector.entropy"
        - "--no-collector.filefd"
        - "--no-collector.filesystem"
        - "--no-collector.hwmon"
        - "--no-collector.infiniband"
        - "--no-collector.ipvs"
        - "--no-collector.loadavg"
        - "--no-collector.mdadm"
        - "--no-collector.meminfo"
        - "--no-collector.netdev"
        - "--no-collector.netstat"
        - "--no-collector.nfs"
        - "--no-collector.nfsd"
        - "--no-collector.sockstat"
        - "--no-collector.stat"
        - "--no-collector.time"
        - "--no-collector.timex"
        - "--no-collector.uname"
        - "--no-collector.vmstat"
        - "--no-collector.wifi"
        - "--no-collector.xfs"
        - "--no-collector.zfs"
        ports:
        - name: metrics
          containerPort: 9201
          hostPort: 9201
        resources:
          requests:
            memory: 30Mi
            cpu: 100m
          limits:
            memory: 50Mi
            cpu: 200m
        volumeMounts:
        - name: proc
          readOnly:  true
          mountPath: /host/proc
        - name: sys
          readOnly: true
          mountPath: /host/sys
        - name: collector-textfiles
          readOnly: true
          mountPath: /run/prometheus
      - image: nvidia/dcgm-exporter:1.4.6
        name: nvidia-dcgm-exporter
        securityContext:
          runAsNonRoot: false
          runAsUser: 0
        volumeMounts:
        - name: collector-textfiles
          mountPath: /run/prometheus

      hostNetwork: false
      hostPID: true

      volumes:
      - name: proc
        hostPath:
          path: /proc
      - name: sys
        hostPath:
          path: /sys
      - name: collector-textfiles
        emptyDir:
          medium: Memory
3.2 prometheus 配置
apiVersion: v1
kind: Service
metadata:
  name: node-gpu-svc
  namespace: kube-system
  labels:
    app: node-gpu-svc
spec:
  type: ClusterIP
  ports:
  - name: http-metrics
    port: 9201
  selector:
    app: dcgm-exporter

---
apiVersion: monitoring.coreos.com/v1
kind: ServiceMonitor
metadata:
  name: node-gpu-svc-monitor
  namespace: kube-system
  labels:
    app: node-gpu-svc-monitor
spec:
  selector:
    matchLabels:
      app: node-gpu-svc
  jobLabel: node-gpu-svc-monitor
  endpoints:
  - port: http-metrics
    path: /metrics
    scheme: http
成功以后,在kube-system下看到应用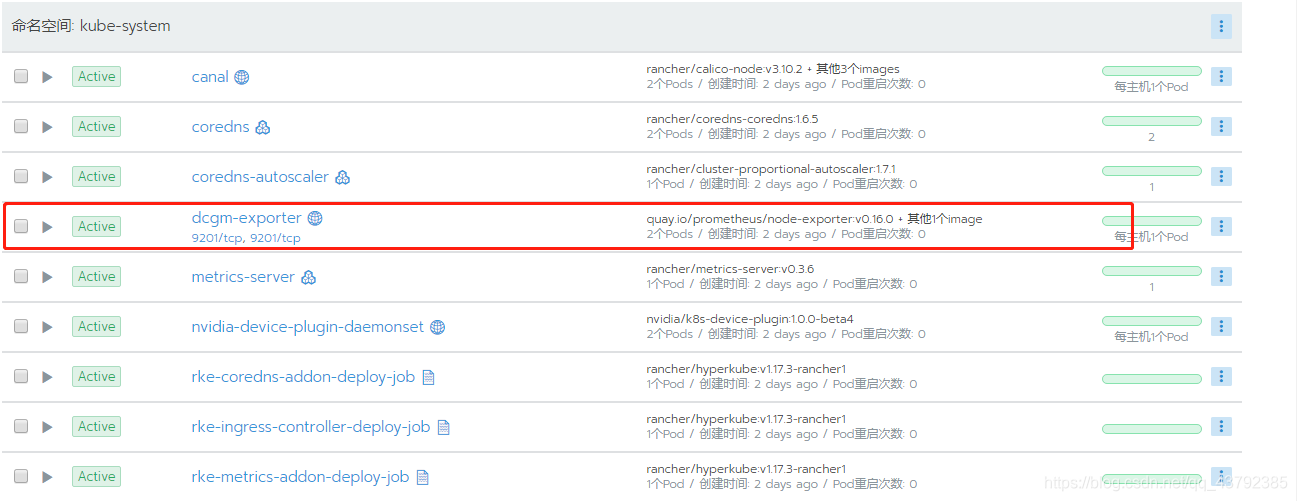
4. 配置Grafana
4.1 查看采集数据
首先可以通过如下指令查看promethus监控的数据,ip是你任意一台部署在集群中的主机ip。
curl http://ip:9201/metrics
采集的数据大概是下面这样
o_memstats_gc_sys_bytes 471040
# HELP go_memstats_heap_alloc_bytes Number of heap bytes allocated and still in use.

# HELP go_memstats_heap_idle_bytes Number of heap bytes waiting to be used.

# HELP go_memstats_heap_inuse_bytes Number of heap bytes that are in use.
# TYPE go_memstats_heap_inuse_bytes gauge
go_memstats_heap_inuse_bytes 3.063808e+06
# HELP go_memstats_heap_objects Number of allocated objects.
# TYPE go_memstats_heap_objects gauge
go_memstats_heap_objects 8662
# HELP go_memstats_heap_released_bytes Number of heap bytes released to OS.
# TYPE go_memstats_heap_released_bytes gauge
go_memstats_heap_released_bytes 524288
# HELP go_memstats_heap_sys_bytes Number of heap bytes obtained from system.
# TYPE go_memstats_heap_sys_bytes gauge
go_memstats_heap_sys_bytes 5.865472e+06
# HELP go_memstats_last_gc_time_seconds Number of seconds since 1970 of last garbage collection.
# TYPE go_memstats_last_gc_time_seconds gauge
go_memstats_last_gc_time_seconds 1.5833111923386707e+09
# HELP go_memstats_lookups_total Total number of pointer lookups.
# TYPE go_memstats_lookups_total counter
go_memstats_lookups_total 196
4.2 配置Grafana数据源
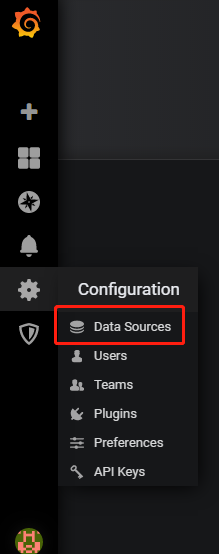
在集权的任一监控界面点击Grafana的图标进入,默认登录账号密码是admin/admin,不要设置新密码,登录之后才有权限操作数据源和图表,默认进入智能查看。
选择setting——>DataSource
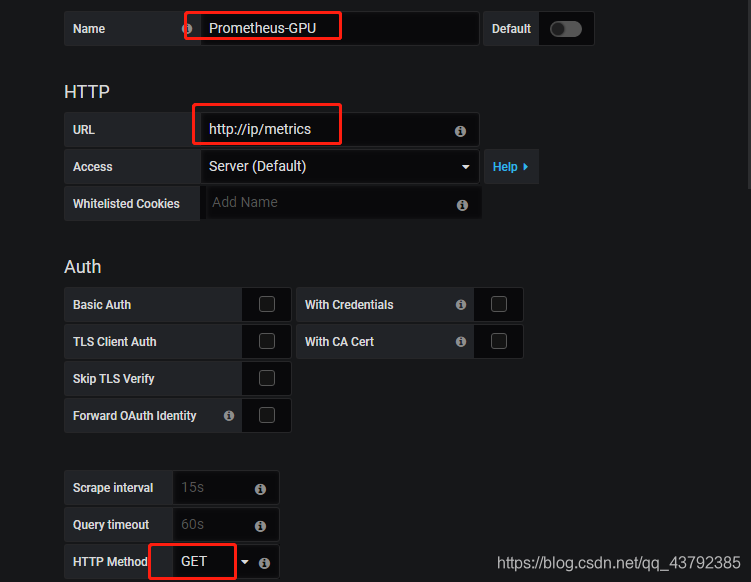
选择Prometheus数据源,输入数据源名称,URL地址以及请求方法,其他可以默认,点击save&test
4.3 配置Grafana仪表盘
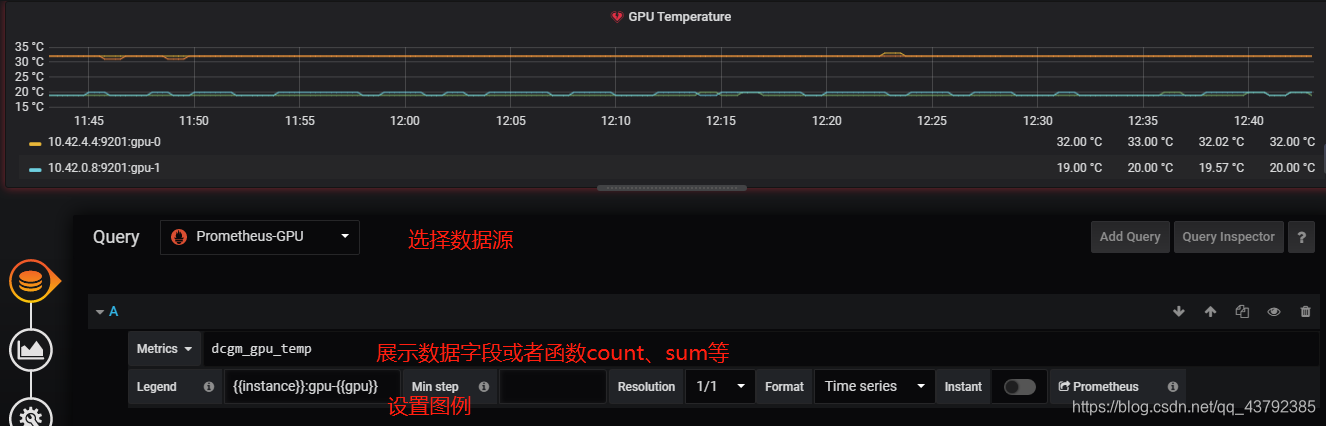
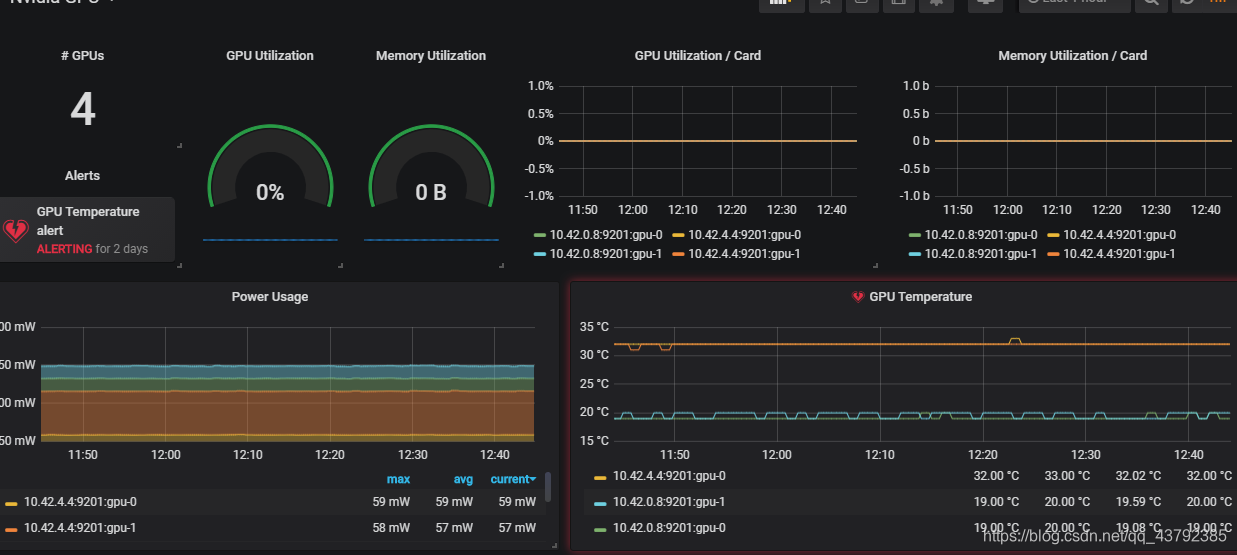
点击右侧加号,选择dashboard,配置数据源、图表类型、图表名称等,一下是GPU的温度图表。
4.4 部分指标说明
| 参数 | 说明 |
|---|---|
| dcgm_sm_clock | GPU sm 时钟(MHz) |
| dcgm_memory_clock | GPU 内存时钟(MHz) |
| dcgm_gpu_temp | GPU 运行的温度(℃) |
| dcgm_power_usage | GPU 的功率(w) |
| dcgm_pcie_tx_throughput | GPU PCIe TX传输的字节总数 (kb) |
| dcgm_pcie_rx_throughput | GPU PCIe RX接收的字节总数(kb) |
| dcgm_pcie_replay_counter | GPU PCIe重试的总数 |
| dcgm_gpu_utilization | GPU 利用率(%) |
| dcgm_mem_copy_utilization | GPU 内存利用率(%) |
| dcgm_enc_utilization | GPU 编码器利用率 (%) |
| dcgm_dec_utilization | GPU 解码器利用率 (%) |
| dcgm_xid_errors | GPU 上一个xid错误的值 |
| dcgm_power_violation | GPU 功率限制导致的节流持续时间(us) |
| dcgm_thermal_violation | GPU 热约束节流持续时间(us) |
| dcgm_sync_boost_violation | GPU 同步增强限制,限制持续时间(us) |
| dcgm_fb_free | GPU fb(帧缓存)的剩余(MiB) |
| dcgm_fb_used | GPU fb (帧缓存)的使用 (MiB) |
