1. Instalação do Prometheus
tar -zxvf prometheus-2.44.0.linux-amd64.tar.gz -C /opt/module/
sudo chown -R bigdata:bigdata /opt/module/prometheus-2.44.0.linux-amd64
mv /opt/module/prometheus-2.44.0.linux-amd64 /opt/module/prometheus-2.44.0
ln -s /opt/module/prometheus-2.44.0 /usr/local/prometheus
1.1 Modificar arquivo de configuração
vim /opt/module/prometheus-2.44.0/prometheus.yml
# my global config
global:
scrape_interval: 15s # Set the scrape interval to every 15 seconds. Default is every 1 minute.
evaluation_interval: 15s # Evaluate rules every 15 seconds. The default is every 1 minute.
# scrape_timeout is set to the global default (10s).
# Alertmanager configuration
alerting:
alertmanagers:
- static_configs:
- targets:
# - alertmanager:9093
# Load rules once and periodically evaluate them according to the global 'evaluation_interval'.
rule_files:
# - "first_rules.yml"
# - "second_rules.yml"
# A scrape configuration containing exactly one endpoint to scrape:
# Here it's Prometheus itself.
scrape_configs:
# The job name is added as a label `job=<job_name>` to any timeseries scraped from this config.
- job_name: "prometheus"
# metrics_path defaults to '/metrics'
# scheme defaults to 'http'.
static_configs:
- targets: ["node1:9090"]
- job_name: 'pushgateway'
static_configs:
- targets: ["node1:9091"]
labels:
instance: pushgateway
- job_name: 'node exporter'
static_configs:
- targets: ['node1:9100', 'node2:9100', 'node3:9100', 'node4:9100']
- job_name: 'kafka_exporter'
static_configs:
- targets: ["node1:9308"]
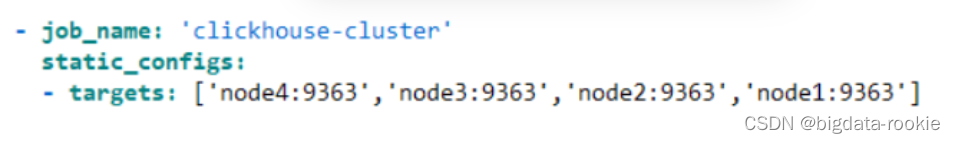
- job_name: 'clickhouse-cluster'
static_configs:
- targets: ['node4:9363','node3:9363','node2:9363','node1:9363']
1.2 Criar diretório de dados
mkdir -p /data/prometheus/data
chown -R bigdata:bigdata /data/prometheus
1.3 Use systemctl para gerenciar o Prometheus
sudo vim /usr/lib/systemd/system/prometheus.service
[Unit]
Description=prometheus
Documentation=https://prometheus.io/docs/introduction/overview/After=network.target
After=network.target

[Service]
Type=simple
User=bigdata
Group=bigdata
Restart=on-failure
WorkingDirectory=/usr/local/prometheus/
ExecStart=/usr/local/prometheus/prometheus --web.enable-admin-api --web.enable-lifecycle --config.file=/usr/local/prometheus/prometheus.yml --storage.tsdb.path=/data/prometheus/data
[Install]
WantedBy=multi-user.target
Ordem
systemctl start prometheus
systemctl enable prometheus
systemctl status prometheus
1.4 implantação de pushgateway
tar -zxvf /opt/software/pushgateway-1.6.0.linux-amd64.tar.gz -C /opt/module/
sudo chown -R bigdata:bigdata /opt/module/pushgateway-1.6.0.linux-amd64
sudo mv /opt/module/pushgateway-1.6.0.linux-amd64 /opt/module/pushgateway-1.6.0
Modifique o arquivo de configuração
sudo vim /usr/lib/systemd/system/pushgateway.service
[Unit]
Description=pushgateway
Wants=prometheus.service
After=prometheus.service

[Service]
Type=simple
User=bigdata
Group=bigdata
Restart=on-failure
WorkingDirectory=/opt/module/pushgateway-1.6.0/
ExecStart=/opt/module/pushgateway-1.6.0/pushgateway --web.listen-address :9091
[Install]
WantedBy=multi-user.target
Ordem
sudo systemctl start pushgateway
sudo systemctl enable pushgateway
sudo systemctl status pushgateway
1.5 implantação do node_exporter
sudo tar -zxvf /opt/software/node_exporter-1.6.0.linux-amd64.tar.gz -C /opt/module/
sudo chown -R bigdata:bigdata /opt/module/node_exporter-1.6.0.linux-amd64
sudo /opt/module/node_exporter-1.6.0.linux-amd64 /opt/module/node_exporter-1.6.0
sudo sh /opt/bash/xsync_bigdata.sh /opt/module/node_exporter-1.6.0
Distribua o diretório /opt/module/node_exporter-1.6.0 para os nós que precisam ser monitorados
Use systemctl para gerenciar o serviço node_exporter
sudo vim /usr/lib/systemd/system/node_exporter.service
[Unit]
Description=node_export
Documentation=https://github.com/prometheus/node_exporter
After=network.target
[Service]
Type=simple
User=bigdata
Group=bigdata
ExecStart= /opt/module/node_exporter-1.6.0/node_exporter
Restart=on-failure
[Install]
WantedBy=multi-user.target
Distribua para cada nó e inicie o serviço
sudo systemctl start node_exporter.service
sudo systemctl status node_exporter.service
sudo systemctl enable node_exporter.service
1.6 departamento kafka_exportador
sudo tar -zxvf /opt/software/kafka_exporter-1.7.0.linux-amd64.tar.gz -C /opt/module/
sudo chown -R bigdata:bigdata /opt/module/kafka_exporter-1.7.0.linux-amd64
mv /opt/module/kafka_exporter-1.7.0.linux-amd64 /opt/module/kafka_exporter-1.7.0
Use systemctl para gerenciar o serviço kafka_exporter
sudo vim /usr/lib/systemd/system/kafka_exporter.service
[Unit]
Description=kafka_exporter
Wants=prometheus.service
After=network.target prometheus.service

[Service]
Type=simple
User=bigdata
Group=bigdata
Restart=on-failure
WorkingDirectory=/opt/module/kafka_exporter-1.7.0
ExecStart=/opt/module/kafka_exporter-1.7.0/kafka_exporter --kafka.server=node2:9092 --web.listen-address=:9308 --zookeeper.server=node2:2181
[Install]
WantedBy=multi-user.target
Ordem
sudo systemctl start kafka_exporter
sudo systemctl enable kafka_exporter
sudo systemctl status kafka_exporter
1.7 instalação de grafana
sudo tar -zxvf /opt/software/grafana-enterprise-10.0.0.linux-amd64.tar.gz -C /opt/module/
sudo chown -R bigdata:bigdata /opt/module/grafana-10.0.0
sudo vim /usr/lib/systemd/system/grafana.service
Use systemctl para gerenciar o serviço grafana
[Unit]
Description=grafana
Wants=prometheus.service
After=network.target prometheus.service

[Service]
Type=simple
User=bigdata
Group=bigdata
Restart=on-failure
WorkingDirectory=/opt/module/grafana-10.0.0/bin/
ExecStart=/opt/module/grafana-10.0.0/bin/grafana-server --homepath /opt/module/grafana-10.0.0 web
[Install]
WantedBy=multi-user.target
Ordem
sudo systemctl start grafana
sudo systemctl enable grafana
sudo systemctl status grafana
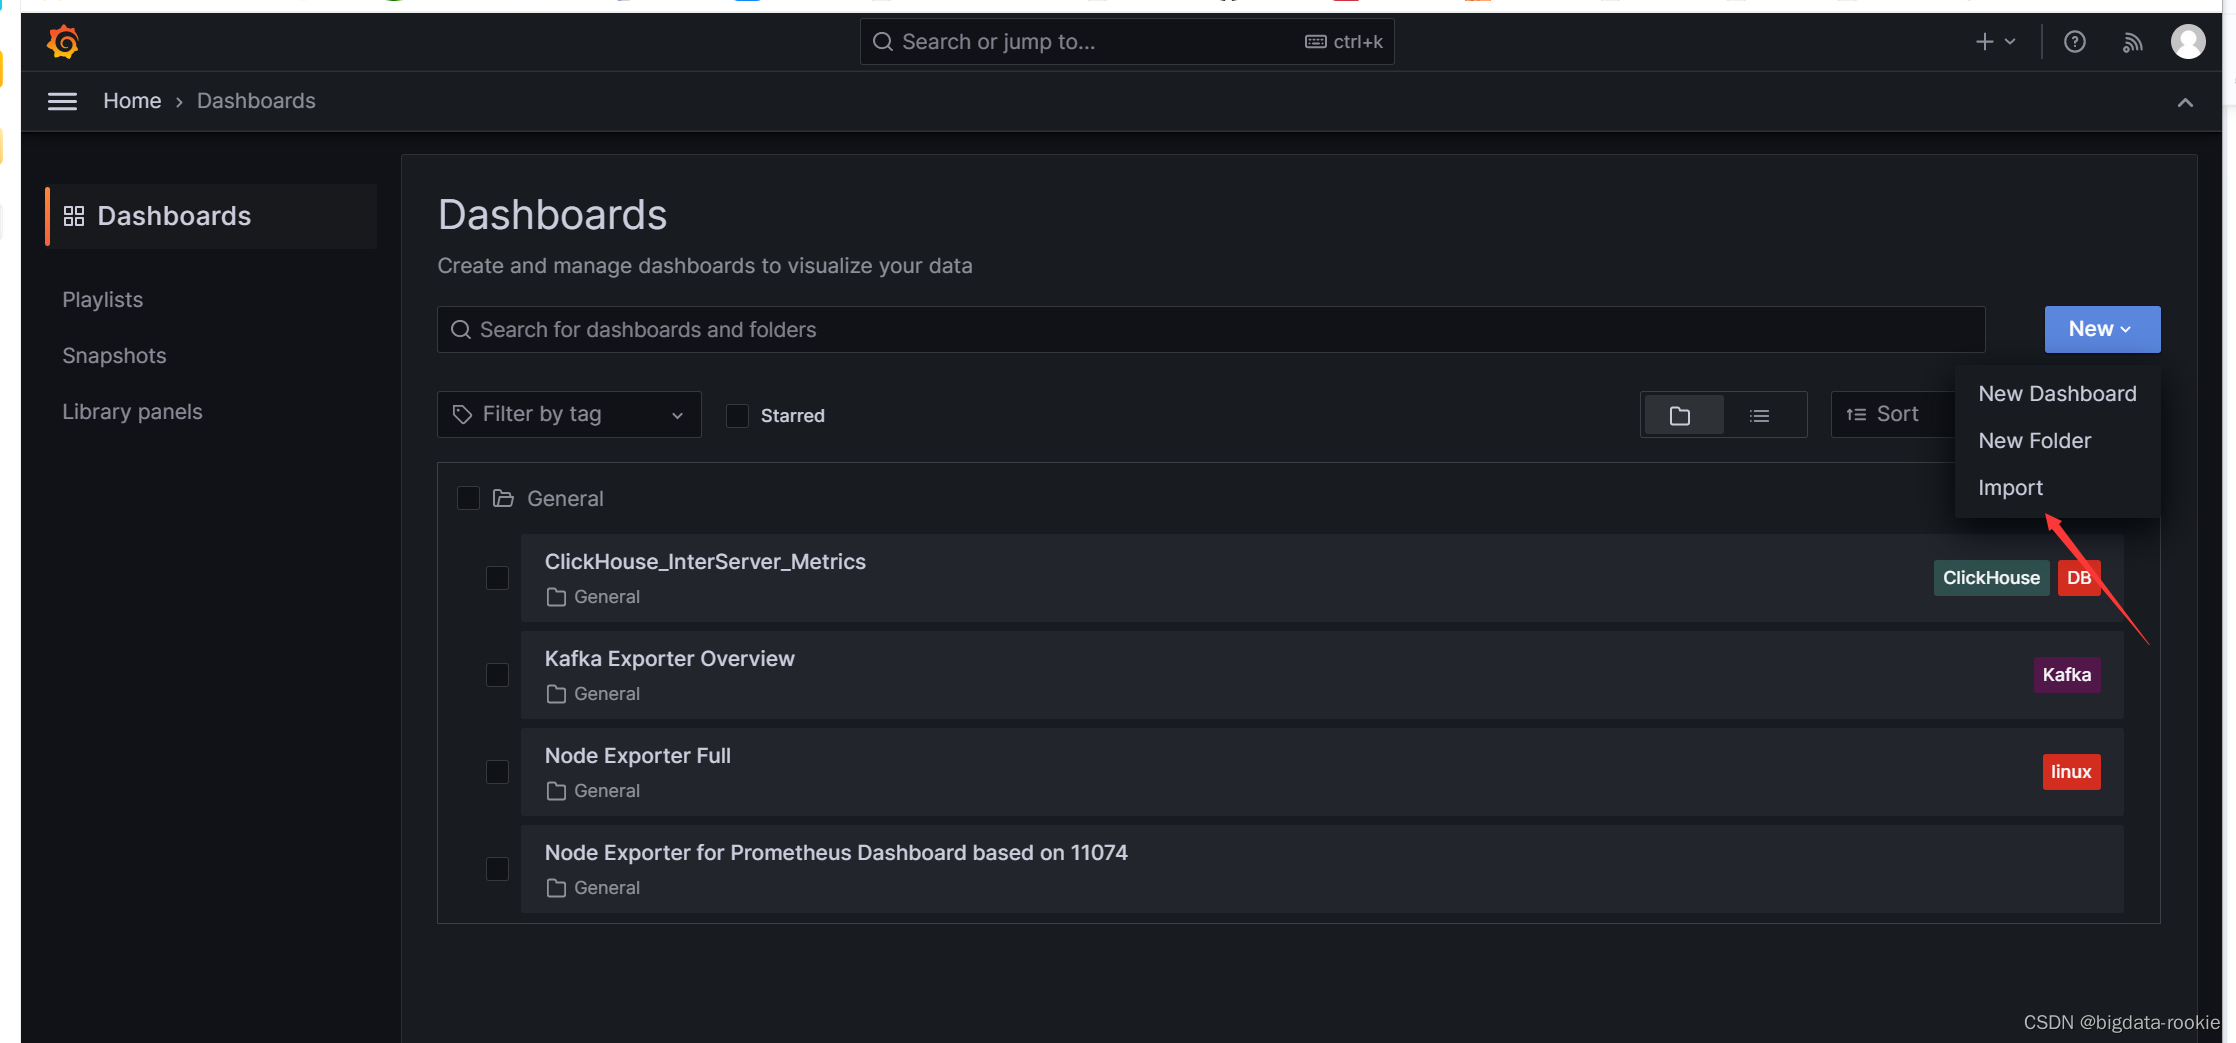
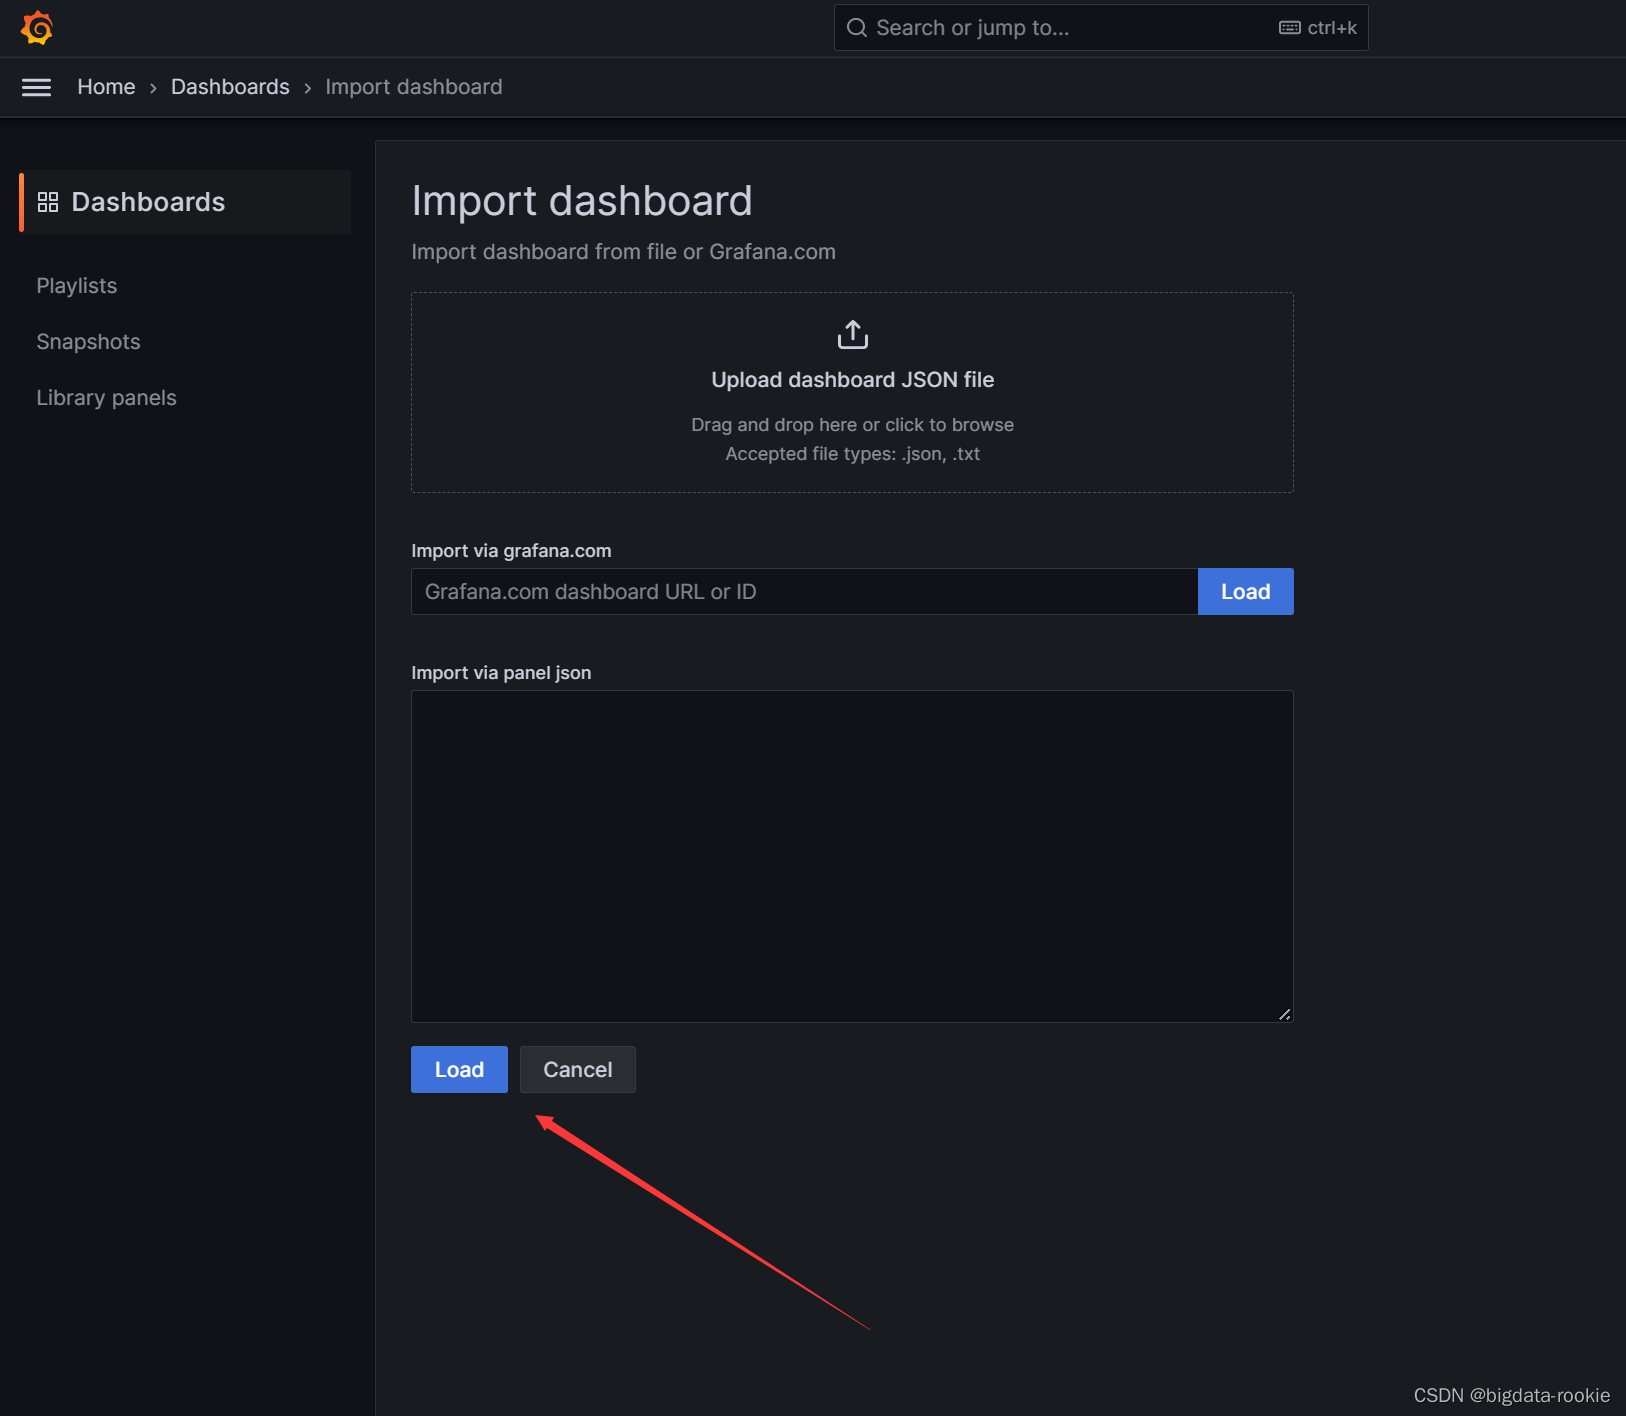
1.7.1 Importar painel grafana
node-exportador-full_rev31.json
kafka-exportador-overview_rev5.json
1.7.2 Grafana monitora cluster clickhouse
1. Configure o arquivo prometheus.yml e adicione o seguinte conteúdo, reinicie o prometheus
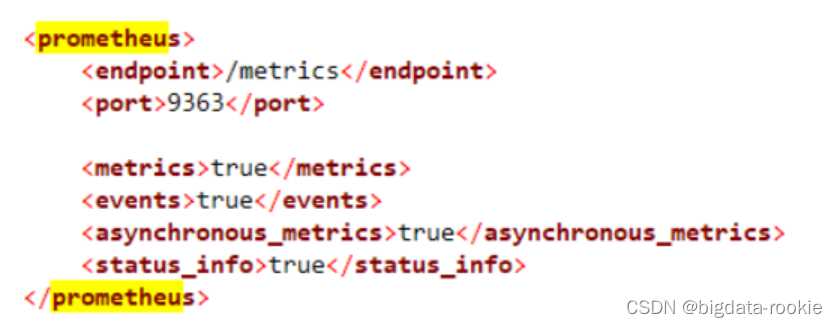
2. Configure o campo prometheus do arquivo conf.xml do clickhouse e, em seguida, reinicie o clickhouse
- grafana configurar monitoramento de clickhouse
monitoramento de importação arquivo de configuração json do cluster
clickhouse clickhouse-metrics-on-settings_rev1.jsion
Os três arquivos json da granfana podem ser obtidos no site oficial