1. Introducción a valgrind
valgrindLinuxEs un conjunto de herramientas de análisis y depuración de programas basadas en tecnología de simulación que se ejecuta en .Se utiliza para construir un marco de equipo para herramientas de análisis dinámico. Incluye un conjunto de herramientas, cada una de las cuales realiza algún tipo de depuración, creación de perfiles o tareas similares para ayudar a mejorar sus programas. ValgrindLa arquitectura es modular, por lo que se pueden crear fácilmente nuevas herramientas sin alterar la estructura existente.
valgrindIncluye principalmente las siguientes herramientas:
1
2
3
4
5
6
7
8
9
10Copiar |
1、memcheck:检查程序中的内存问题,如泄漏、越界、非法指针等。

2、callgrind:检测程序代码的运行时间和调用过程,以及分析程序性能。

3、cachegrind:分析CPU的cache命中率、丢失率,用于进行代码优化。

4、helgrind:用于检查多线程程序的竞态条件。

5、massif:堆栈分析器,指示程序中使用了多少堆内存等信息。

Copiar
|
Además, hay algunas herramientas pequeñas que la mayoría de los usuarios no usarán: Lackeyes una herramienta de muestra que se usa para demostrar el contenido básico de algunos equipos; Nulgrindes una Valgrindherramienta minimizada que no realiza análisis ni operación y solo se usa con fines de prueba.
2. Instalación y uso de valgrind
Instalar
Se recomienda descargarlo e instalarlo desde el sitio web oficial de valgrind . El paquete más reciente del sitio web oficial es3.16.1
1
2
3
4
5
6Copiar |
$ mkdir valgrind-inst
$ cd valgrind-inst/
$ wget https://sourceware.org/pub/valgrind/valgrind-3.16.1.tar.bz2

$ ls
valgrind-3.16.1.tar.bz2
Copiar
|
Después de descomprimirlo, puede instalarlo especificando el directorio de instalación, en este caso recuerde configurar las variables de entorno.
1
2
3
4
5Copiar |
$ tar -xvf valgrind-3.16.1.tar.bz2
$ cd valgrind-3.16.1
$ ./configure --prefix=/usr/local/valgrind
$ make
$ make install
Copiar
|
Compruebe si la instalación es exitosa
1
2 Copiar |
$ valgrind --version
valgrind-3.16.1
Copiar
|
Usando el conjunto de herramientas
El formato de uso básico es el siguiente:
1Copia |
usage: valgrind [options] prog-and-args
Copiar
|
Admite muchas opciones, que podemos valgrind --helpver.
Aquí sólo presentamos algunas de las opciones más utilizadas.
1
2
3
4
5
6
7
8
9
10
11
12
13
14
15
16
17
18
19
20
21
22
23
24
25
26Copiar |
--tool: 是最常用的选项,用于选择使用valgrind工具集中的哪一个工具。默认值为memcheck。

--version: 用于打印valgrind的版本号

-q/--quiet: 安静的运行,只打印错误消息;

-v/--verbose: 打印更详细的信息;

--trace-children: 是否跟踪子进程,默认值为no;

--track-fds: 是否追踪打开的文件描述符,默认为no

--time-stamp=no|yes: 是否在打印出的每条消息之前加上时间戳信息。默认值为no

--log-file=<file>: 指定将消息打印到某个文件

--default-suppressions: 加载默认的抑制参数。

--alignment: 指定malloc分配内存时的最小对齐字节数;

如下的一些选项用于Memcheck工具:

--leak-check=no|summary|full: 在退出时是否查找内存泄露。默认值为summary

--show-leak-kinds=kind1,kind2,..: 显示哪一种类型的内存泄露。默认显示definite和possible这两种;
Copiar
|
3. Explicación detallada de las herramientas Valgrind
1) verificación de memoria
La herramienta más utilizada se utiliza para detectar problemas de memoria en los programas. Se detectarán todas las lecturas y escrituras en la memoria y se capturarán todas las llamadas a malloc, y . Por lo tanto, puede detectar los siguientes problemas:freenewdelete
1
2
3
4
5
6
7
8
9
10
11
12
13
14Copiar |
1、使用未初始化的内存。如果在定义一个变量时没有赋初始值,后边即使赋值了,使用这个变量的时候Memcheck也会报"uninitialised value"错误。使用中会发现,valgrind提示很多这个错误,由于关注的是内存泄漏问题,所以可以用--undef-value-errors=选项把这个错误提示屏蔽掉,具体可以看后面的选项解释。

2、读/写释放后的内存块;

3、内存读写越界(数组访问越界/访问已经释放的内存),读/写超出malloc分配的内存块;

4、读/写不适当的栈中内存块;

5、内存泄漏,指向一块内存的指针永远丢失;

6、不正确的malloc/free或new/delete匹配(重复释放/使用不匹配的分配和释放函数);

7、内存覆盖,memcpy()相关函数中的dst和src指针重叠。

Copiar
|
uso:
Compile el programa para generar un archivo ejecutable y ejecute:valgrind –leak-check=full ./程序名
NOTA: Todo el código de prueba que se analiza a continuación se compila mejor con -gla opción de memcheckgenerar números de línea en la salida.
Verificación del programa de prueba:
Escribir programa de prueba
1
2
3
4
5
6
7
8
9
10
11
12Copy |
#include <stdlib.h>

void func() {
    char *p = new char[10];
}

int main() {
    func();

    return 0;
}

Copy
|
编译后,用valgrind检测程序。
如果设置了--leak-check=full,Memcheck会给出详细的每个块是在哪里分配,并且给出分配时函数调用堆栈(编译的时候使用-g选项和去掉-o优化选项,就可以得到更详细的函数信息,可以精确到代码的某一行)。可以通过--show-leak-kinds选项来选择要详细报告哪几种类型的错误。Memcheck会把函数调用堆栈相同或相似的内存块信息,放到同一个条目来显示,可以通过--leak-resolution来控制这个”相似”判断的力度。
1
2Copy |
$ g++ -g -o test leak.cpp
$ valgrind --tool=memcheck --leak-check=full ./test
Copy
|
检测结果如下:
1
2
3
4
5
6
7
8
9
10
11
12
13
14
15
16
17
18
19
20
21
22
23
24Copy |
==6018== Memcheck, a memory error detector
==6018== Copyright (C) 2002-2017, and GNU GPL'd, by Julian Seward et al.
==6018== Using Valgrind-3.16.1 and LibVEX; rerun with -h for copyright info
==6018== Command: ./test
==6018==
==6018==
==6018== HEAP SUMMARY:
==6018==     in use at exit: 10 bytes in 1 blocks
==6018==   total heap usage: 1 allocs, 0 frees, 10 bytes allocated
==6018==
==6018== 10 bytes in 1 blocks are definitely lost in loss record 1 of 1
==6018==    at 0x4C2AC58: operator new[](unsigned long) (vg_replace_malloc.c:431)
==6018==    by 0x40062E: func() (leak.cpp:4)
==6018==    by 0x40063D: main (leak.cpp:8)
==6018==
==6018== LEAK SUMMARY:
==6018==    definitely lost: 10 bytes in 1 blocks
==6018==    indirectly lost: 0 bytes in 0 blocks
==6018==      possibly lost: 0 bytes in 0 blocks
==6018==    still reachable: 0 bytes in 0 blocks
==6018==         suppressed: 0 bytes in 0 blocks
==6018==
==6018== For lists of detected and suppressed errors, rerun with: -s
==6018== ERROR SUMMARY: 1 errors from 1 contexts (suppressed: 0 from 0)
Copy
|
结果说明:
先看看输出信息中的HEAP SUMMARY,它表示程序在堆上分配内存的情况,其中的1 allocs
表示程序分配了 1 次内存,0 frees表示程序释放了 0 次内存,10 bytes allocated表示分配了 10 个字节的内存。
另外,Valgrind 也会报告程序是在哪个位置发生内存泄漏。
上面LEAK SUMMARY会打印5种不同的类型,这里我们简单介绍一下:
1
2
3
4
5
6
7
8Copy |
definitely lost: 明确丢失的内存。程序中存在内存泄露,应尽快修复。当程序结束时如果一块动态分配的内存没有被释放并且通过程序内的指针变量均无法访问这块内存则会报这个错误;

indirectly lost: 间接丢失。当使用了含有指针成员的类或结构体时可能会报这个错误。这类错误无需直接修复,它们总是与definitely lost一起出现,只要修复definitely lost即可。

possibly lost: 可能丢失。大多数情况下应视为与definitely lost一样需要尽快修复,除非你的程序让一个指针指向一块动态分配的内存(但不是这块内存的起始地址),然后通过运算得到这块内存的起始地址,再释放它。当程序结束时如果一块动态分配的内存没有被释放并且通过程序内的指针变量均无法访问这块内存的起始地址,但可以访问其中的某一部分数据,则会报这个错误。

stil reachable: 可以访问,未丢失但也未释放。如果程序是正常结束的,那么它可能不会造成程序崩溃,但长时间运行有可能耗尽系统资源。

Copy
|
其他几种情况,写一个综合的测试程序进行验证。
1
2
3
4
5
6
7
8
9
10
11
12
13
14
15
16
17
18
19
20Copy |
// mixed.cpp

void func() {
    char *ptr = new char[10];
    ptr[10] = 'a';   // 内存越界

    memcpy(ptr + 1, ptr, 5);   // 踩内存

    delete []ptr;
    delete []ptr; // 重复释放

    char *p;
    *p = 1;   // 非法指针
}

int main() {
    func();

    return 0;
}
Copy
|
编译后,用valgrind检测程序。
1
2Copy |
$ g++ -g -o test mixed.cpp
$ valgrind --tool=memcheck --leak-check=full ./test
Copy
|
检测结果
1
2
3
4
5
6
7
8
9
10
11
12
13
14
15
16
17
18
19
20
21
22
23
24
25
26
27
28
29
30
31
32
33
34
35
36
37
38
39
40
41
42
43
44
45
46
47
48
49
50
51Copy |
==22786== Memcheck, a memory error detector
==22786== Copyright (C) 2002-2017, and GNU GPL'd, by Julian Seward et al.
==22786== Using Valgrind-3.16.1 and LibVEX; rerun with -h for copyright info
==22786== Command: ./test
==22786==
==22786== Invalid write of size 1      // 内存越界
==22786==    at 0x4007FB: func() (mixed.cpp:6)
==22786==    by 0x400851: main (mixed.cpp:18)
==22786==  Address 0x5a2404a is 0 bytes after a block of size 10 alloc'd
==22786==    at 0x4C2AC58: operator new[](unsigned long) (vg_replace_malloc.c:431)
==22786==    by 0x4007EE: func() (mixed.cpp:5)
==22786==    by 0x400851: main (mixed.cpp:18)
==22786==
==22786== Source and destination overlap in memcpy(0x5a24041, 0x5a24040, 5)  // 踩内存
==22786==    at 0x4C2E83D: memcpy@@GLIBC_2.14 (vg_replace_strmem.c:1033)
==22786==    by 0x400819: func() (mixed.cpp:8)
==22786==    by 0x400851: main (mixed.cpp:18)
==22786==
==22786== Invalid free() / delete / delete[] / realloc()    // 重复释放
==22786==    at 0x4C2BBAF: operator delete[](void*) (vg_replace_malloc.c:649)
==22786==    by 0x40083F: func() (mixed.cpp:11)
==22786==    by 0x400851: main (mixed.cpp:18)
==22786==  Address 0x5a24040 is 0 bytes inside a block of size 10 free'd
==22786==    at 0x4C2BBAF: operator delete[](void*) (vg_replace_malloc.c:649)
==22786==    by 0x40082C: func() (mixed.cpp:10)
==22786==    by 0x400851: main (mixed.cpp:18)
==22786==  Block was alloc'd at
==22786==    at 0x4C2AC58: operator new[](unsigned long) (vg_replace_malloc.c:431)
==22786==    by 0x4007EE: func() (mixed.cpp:5)
==22786==    by 0x400851: main (mixed.cpp:18)
==22786==
==22786== Use of uninitialised value of size 8    // 非法指针
==22786==    at 0x400844: func() (mixed.cpp:14)
==22786==    by 0x400851: main (mixed.cpp:18)
==22786==
==22786==
==22786== Process terminating with default action of signal 11 (SIGSEGV): dumping core
==22786==  Bad permissions for mapped region at address 0x4008B0
==22786==    at 0x400844: func() (mixed.cpp:14)
==22786==    by 0x400851: main (mixed.cpp:18)
==22786==
==22786== HEAP SUMMARY:
==22786==     in use at exit: 0 bytes in 0 blocks
==22786==   total heap usage: 1 allocs, 2 frees, 10 bytes allocated
==22786==
==22786== All heap blocks were freed -- no leaks are possible
==22786==
==22786== Use --track-origins=yes to see where uninitialised values come from
==22786== For lists of detected and suppressed errors, rerun with: -s
==22786== ERROR SUMMARY: 4 errors from 4 contexts (suppressed: 0 from 0)
Segmentation fault (core dumped)
Copy
|
可见valgrind将上述几种情况都检测出来了。
2) Callgrind
和gprof类似的分析工具,但它对程序的运行观察更为入微,能给我们提供更多的信息。和gprof不同的是,它不需要在编译源代码时附加特殊选项,但还是推荐加上调试选项。Callgrind收集程序运行时的一些数据,建立函数调用关系图,还可以有选择地进行cache模拟。在运行结束时,它会把分析数据写入一个文件。callgrind_annotate可以把这个文件的内容转化成可读的形式。
测试程序
1
2
3
4
5
6
7
8
9
10
11
12
13
14
15
16
17
18Copy |
#include <stdio.h>
#include <unistd.h>

void test() {
    sleep(1);
}
void func() {
    for(int i = 0; i < 10; i++) {
        test();
    }
}

int main() {
    func();
    printf("process is over!\n");

    return 0;
}
Copy
|
编译后,用valgrind检测程序。
1
2
3
4Copy |
$ g++ -g -o test callgrind.cpp
$ valgrind --tool=callgrind ./test
$ ls
callgrind.cpp  callgrind.out.3490  test
Copy
|
callgrind.out.3490就是callgrind生成的文件。
这里介绍一个图形化性能分析工具Kcachegrind
Kcachegrind官网地址
下载安装后可以用来分析callgrind生成的文件。
用Kcachegrind打开callgrind.out.3490这个文件,如下图:
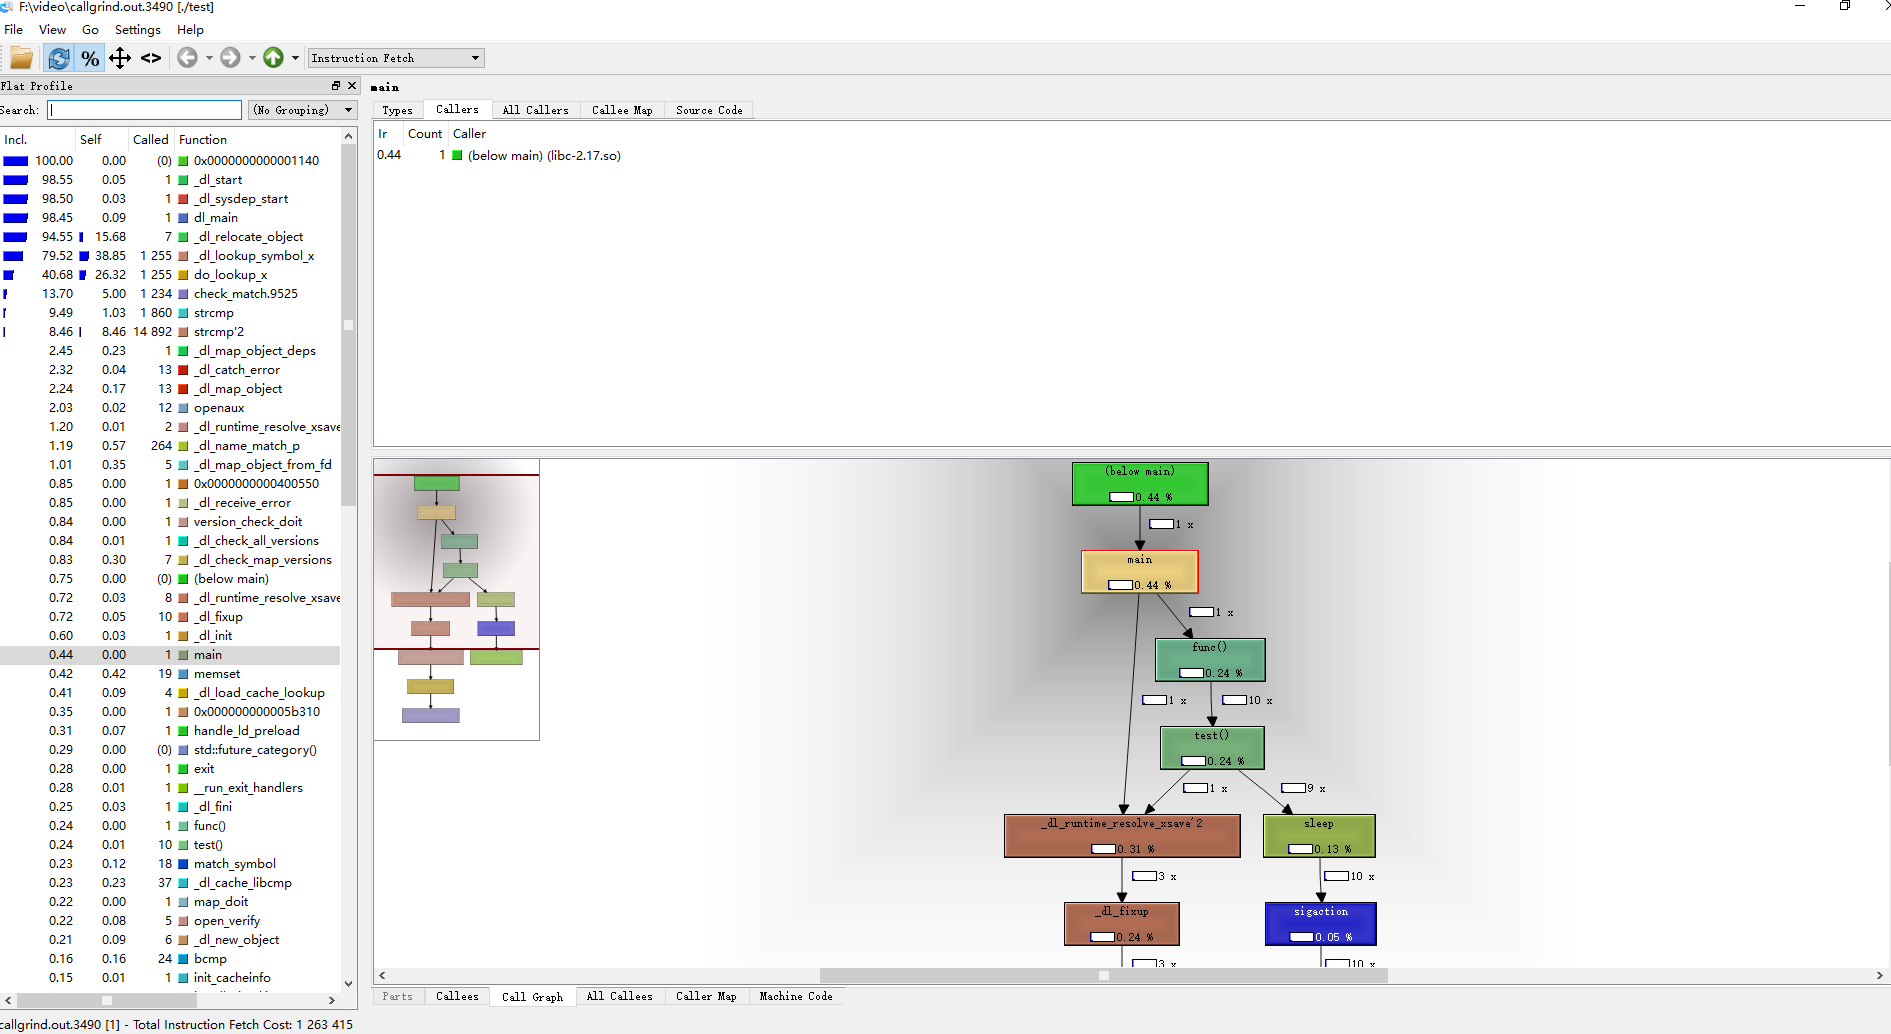
callgrind
通过图形化,我们可以很直观的知道哪段程序执行慢,并且了解相关调用关系。
3) Cachegrind
Cache分析器,它模拟CPU中的一级缓存和二级缓存,能够精确地指出程序中cache的丢失和命中。如果需要,它还能够为我们提供cache丢失次数,内存引用次数,以及每行代码,每个函数,每个模块,整个程序产生的指令数。这对优化程序有很大的帮助。
它的使用方法也是:valgrind –tool=cachegrind ./程序名
4) Helgrind
它主要用来检查多线程程序中出现的竞争问题。Helgrind寻找内存中被多个线程访问,而又没有一贯加锁的区域,这些区域往往是线程之间失去同步的地方,而且会导致难以发觉的错误。Helgrind实现了名为Eraser的竞争检测算法,并做了进一步改进,减少了报告错误的次数。不过,Helgrind仍然处于实验状态。
测试代码:
1
2
3
4
5
6
7
8
9
10
11
12
13
14
15
16
17
18
19
20
21
22
23
24
25
26Copy |
#include <stdio.h>
#include <pthread.h>

#define NUM 10
int counter = 0;

void *threadfunc(void*) {
    for (int i = 0; i < NUM; i++) {
        counter += i;
    }
}

int main() {
    pthread_t tid1, tid2;

    pthread_create(&tid1, NULL, &threadfunc, NULL);
    pthread_create(&tid2, NULL, &threadfunc, NULL);

    // wait for thread to terminate
    pthread_join(tid1, NULL);
    pthread_join(tid2, NULL);

    printf("counter = %d\n", counter);

    return 0;
}
Copy
|
编译后,用valgrind检测程序。
1
2Copy |
$ g++ -g -o test helgrind.cpp -lpthread
$ valgrind --tool=helgrind ./test
Copy
|
检测结果:
1
2
3
4
5
6
7
8
9
10
11
12
13
14
15
16
17
18
19
20
21
22
23
24
25
26
27
28
29
30
31
32
33
34
35
36
37
38
39
40
41
42
43
44
45
46
47
48
49
50
51
52
53
54
55
56
57
58
59
60
61
62
63
64
65Copiar |
==27722== Helgrind, a thread error detector
==27722== Copyright (C) 2007-2017, and GNU GPL'd, by OpenWorks LLP et al.
==27722== Using Valgrind-3.16.1 and LibVEX; rerun with -h for copyright info
==27722== Command: ./test
==27722==
==27722== ---Thread-Announcement------------------------------------------
==27722==
==27722== Thread #3 was created
==27722==    at 0x597589E: clone (in /usr/lib64/libc-2.17.so)
==27722==    by 0x4E43059: do_clone.constprop.4 (in /usr/lib64/libpthread-2.17.so)
==27722==    by 0x4E44569: pthread_create@@GLIBC_2.2.5 (in /usr/lib64/libpthread-2.17.so)
==27722==    by 0x4C30CFA: pthread_create_WRK (hg_intercepts.c:425)
==27722==    by 0x4C31DD8: pthread_create@* (hg_intercepts.c:458)
==27722==    by 0x400728: main (helgrind.cpp:17)
==27722==
==27722== ---Thread-Announcement------------------------------------------
==27722==
==27722== Thread #2 was created
==27722==    at 0x597589E: clone (in /usr/lib64/libc-2.17.so)
==27722==    by 0x4E43059: do_clone.constprop.4 (in /usr/lib64/libpthread-2.17.so)
==27722==    by 0x4E44569: pthread_create@@GLIBC_2.2.5 (in /usr/lib64/libpthread-2.17.so)
==27722==    by 0x4C30CFA: pthread_create_WRK (hg_intercepts.c:425)
==27722==    by 0x4C31DD8: pthread_create@* (hg_intercepts.c:458)
==27722==    by 0x40070D: main (helgrind.cpp:16)
==27722==
==27722== ----------------------------------------------------------------
==27722==
==27722== Possible data race during read of size 4 at 0x601048 by thread #3
==27722== Locks held: none
==27722==    at 0x4006CE: threadfunc(void*) (helgrind.cpp:9)
==27722==    by 0x4C30EEE: mythread_wrapper (hg_intercepts.c:387)
==27722==    by 0x4E43EA4: start_thread (in /usr/lib64/libpthread-2.17.so)
==27722==    by 0x59758DC: clone (in /usr/lib64/libc-2.17.so)
==27722==
==27722== This conflicts with a previous write of size 4 by thread #2
==27722== Locks held: none
==27722==    at 0x4006D9: threadfunc(void*) (helgrind.cpp:9)
==27722==    by 0x4C30EEE: mythread_wrapper (hg_intercepts.c:387)
==27722==    by 0x4E43EA4: start_thread (in /usr/lib64/libpthread-2.17.so)
==27722==    by 0x59758DC: clone (in /usr/lib64/libc-2.17.so)
==27722==  Address 0x601048 is 0 bytes inside data symbol "counter"
==27722==
==27722== ----------------------------------------------------------------
==27722==
==27722== Possible data race during write of size 4 at 0x601048 by thread #3
==27722== Locks held: none
==27722==    at 0x4006D9: threadfunc(void*) (helgrind.cpp:9)
==27722==    by 0x4C30EEE: mythread_wrapper (hg_intercepts.c:387)
==27722==    by 0x4E43EA4: start_thread (in /usr/lib64/libpthread-2.17.so)
==27722==    by 0x59758DC: clone (in /usr/lib64/libc-2.17.so)
==27722==
==27722== This conflicts with a previous write of size 4 by thread #2
==27722== Locks held: none
==27722==    at 0x4006D9: threadfunc(void*) (helgrind.cpp:9)
==27722==    by 0x4C30EEE: mythread_wrapper (hg_intercepts.c:387)
==27722==    by 0x4E43EA4: start_thread (in /usr/lib64/libpthread-2.17.so)
==27722==    by 0x59758DC: clone (in /usr/lib64/libc-2.17.so)
==27722==  Address 0x601048 is 0 bytes inside data symbol "counter"
==27722==
counter = 90
==27722==
==27722== Use --history-level=approx or =none to gain increased speed, at
==27722== the cost of reduced accuracy of conflicting-access information
==27722== For lists of detected and suppressed errors, rerun with: -s
==27722== ERROR SUMMARY: 2 errors from 2 contexts (suppressed: 0 from 0)
Copiar
|
De los resultados anteriores, sabemos valgrindque se ha analizado la situación competitiva.
5) Macizo
El analizador de pila, que mide cuánta memoria usa un programa en la pila, nos dice el tamaño de los bloques del montón, los bloques de administración del montón y la pila. MassifPuede ayudarnos a reducir el uso de memoria, en sistemas modernos con memoria virtual también puede acelerar la ejecución de nuestros programas y reducir la posibilidad de que el programa permanezca en el área de intercambio.
MassifRealice la asignación y desasignación de memoria profile. Los desarrolladores de programas pueden utilizarlo para comprender en profundidad el comportamiento de uso de la memoria del programa y optimizar el uso de la memoria. Esta característica es C++especialmente útil porque C++hay muchas asignaciones y desasignaciones de memoria ocultas.
Además, lackey y nulgrind también se proporcionará. Lackey Es una pequeña herramienta que rara vez se utiliza; Nulgrind simplemente muestra a los desarrolladores cómo crear una herramienta. No se hará ninguna introducción aquí.