Brief introduction
There are many common components corresponding index of lib, has been widely used applications can be converted into Prometheus specified index format (plain text) to help users take advantage of Prometheus to monitor these components, such as Kafka, mysql, HAProxy Wait. These lib, the application is known as exporter. This section of our (indicators used to monitor the Linux systems) through node-exporter Prometheus official maintained to further study Prometheus
node-exporter installation
node-exporter uses go language development, designed to collect * NIX system hardware, system metrics. Either binary installation deployment, can also be deployed through the vessel in the form of
Binary installation
Enter the download page to get the appropriate version of the download link
To 0.18.1 version, for example
$ mkdir /opt/k8s/prometheus & cd /opt/k8s/prometheus $ wget https://github.com/prometheus/node_exporter/releases/download/v0.18.1/node_exporter-0.18.1.linux-amd64.tar.gz $ tar -xzvf node_exporter-0.18.1.linux-amd64.tar.gz $ cd node_exporter-0.18.1.linux-amd64 $ls -al 总用量 16508 drwxr-xr-x 2 3434 3434 4096 6月 5 2019 . drwxr-xr-x 4 root root 4096 3月 19 09:18 .. -rw-r--r-- 1 3434 3434 11357 6月 5 2019 LICENSE -rwxr-xr-x 1 3434 3434 16878582 6月 5 2019 node_exporter -rw-r--r-- 1 3434 3434 463 6月 5 2019 NOTICE- node_exporter installation package is extremely simple, only a binary file starts
Start node_exporter
$ cd /opt/k8s/prometheus/node_exporter-0.18.1.linux-amd64 $ ./node_exporter- ./Node_exporter -h command to view the execution node_exporter configuration items, such as listening port, collects metrics type
- node_exporter listening port 9100, modified by --web.listen-address parameter
node_exporter default to the http protocol, if the need to start with https form, = "web-config.yml" is specified by ./node_exporter --web.config, web-config.yml file format is as follows:
tlsConfig :
  # Certificate and key files for server to use to authenticate to client
  tlsCertPath : <filename>
  tlsKeyPath : <filename>
The node_exporter system configured to service, start with the system
Edit the startup file
$ cat > /etc/systemd/system/node_exporter.service<< EOF

[Unit]
Description=Prometheus Server
Documentation=https://prometheus.io/docs/introduction/overview/
After=network.target

[Service]
Restart=on-failure
WorkingDirectory=/opt/k8s/prometheus/node_exporter-0.18.1.linux-amd64
ExecStart=/opt/k8s/prometheus/node_exporter-0.18.1.linux-amd64/node_exporter \

[Install]
WantedBy=multi-user.target
EOF
Start node_exporter by systemctl
$ systemctl daemon-reload
$ systemctl start node_exporter
$ systemctl enable node_exporter
docker container in the form of start
Because node_exporter is used to monitor a host of indicators, under normal circumstances it is not recommended way to start the vessel, but in k8s, swarm such as environment, in order to maintain consistency component deployment we can expect to start in the form of container. In addition to daemonset, in the service provided to all the swarm replicate in k8s, the system that we have when the new node has come, node_exporter container automatically start on a new node, without human intervention.
Due to the need to monitor the host index, so it is necessary to use the host's process, file system, network and other information, because the information needed to mount into the host
docker run -d \
  --net="host" \
  --pid="host" \
  -v "/:/host:ro,rslave" \
  quay.io/prometheus/node-exporter \
  --path.rootfs=/host
Configuring Prometheus, to obtain information from the index in node_exporter
Prometheus is added in node_exporter corresponding profile information scrape_config
...
scrape_configs:
  - job_name: 'node'
    static_configs:
    - targets: ['localhost:9100']
Prometheus reload the configuration file by kill -HUP
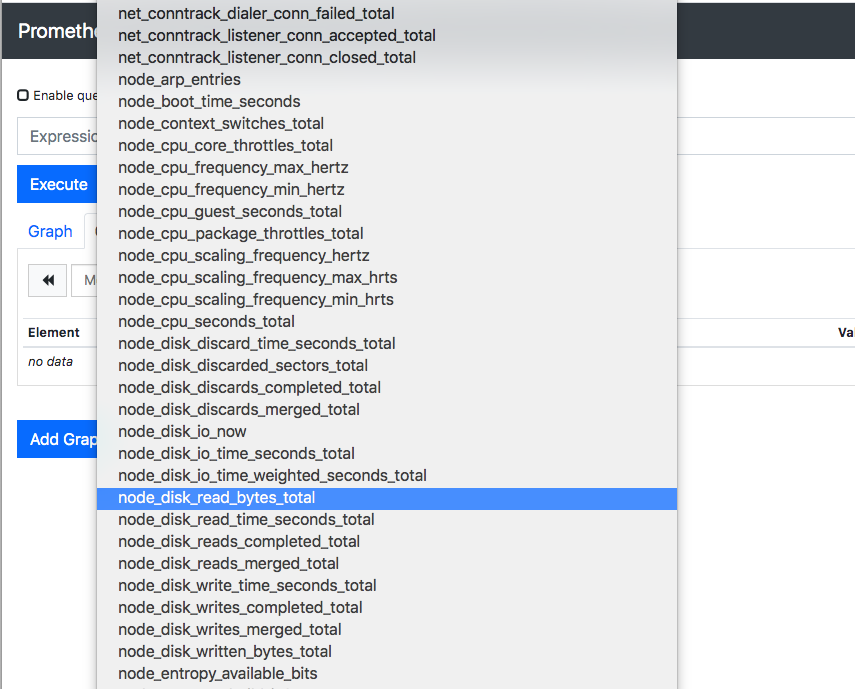
$ systemctl reload prometheusPrometheus access interface, in metric drop-down box you can see many of the indicators associated with the node name appears