Last article talked about how Prometheus JVM information and Grafana monitoring SpringBoot applications, take a look at how to monitor the
Server is running, use the tools listed first:
- Prometheus
- node_exporter 0.17
- Grafana
- Grafana Dashboard (8919)
Prometheus and Grafana the installation and configuration of an article already mentioned, this is mainly a look at the remaining steps
First, install and run on the target server Node Exporter
- Download and unzip
2. Run (Node Exporter in 9100 to run the port, remember to open the corresponding port Ali cloud firewall)
nohup ./node_exporter &
3. Test Access
curl http://localhost:9100/metrics
Second, the configuration data Prometheus gripping Node Exporter
scrape_configs:
- job_name: 'node'
  static_configs:
  - targets: ['localhost:9100']
Modify remember to restart prometheus
Third, in the console Grafana import Dashboard 8919, data source selecting Prometheus
After this simple three-step operation, you can see the following information in Grafana interface:
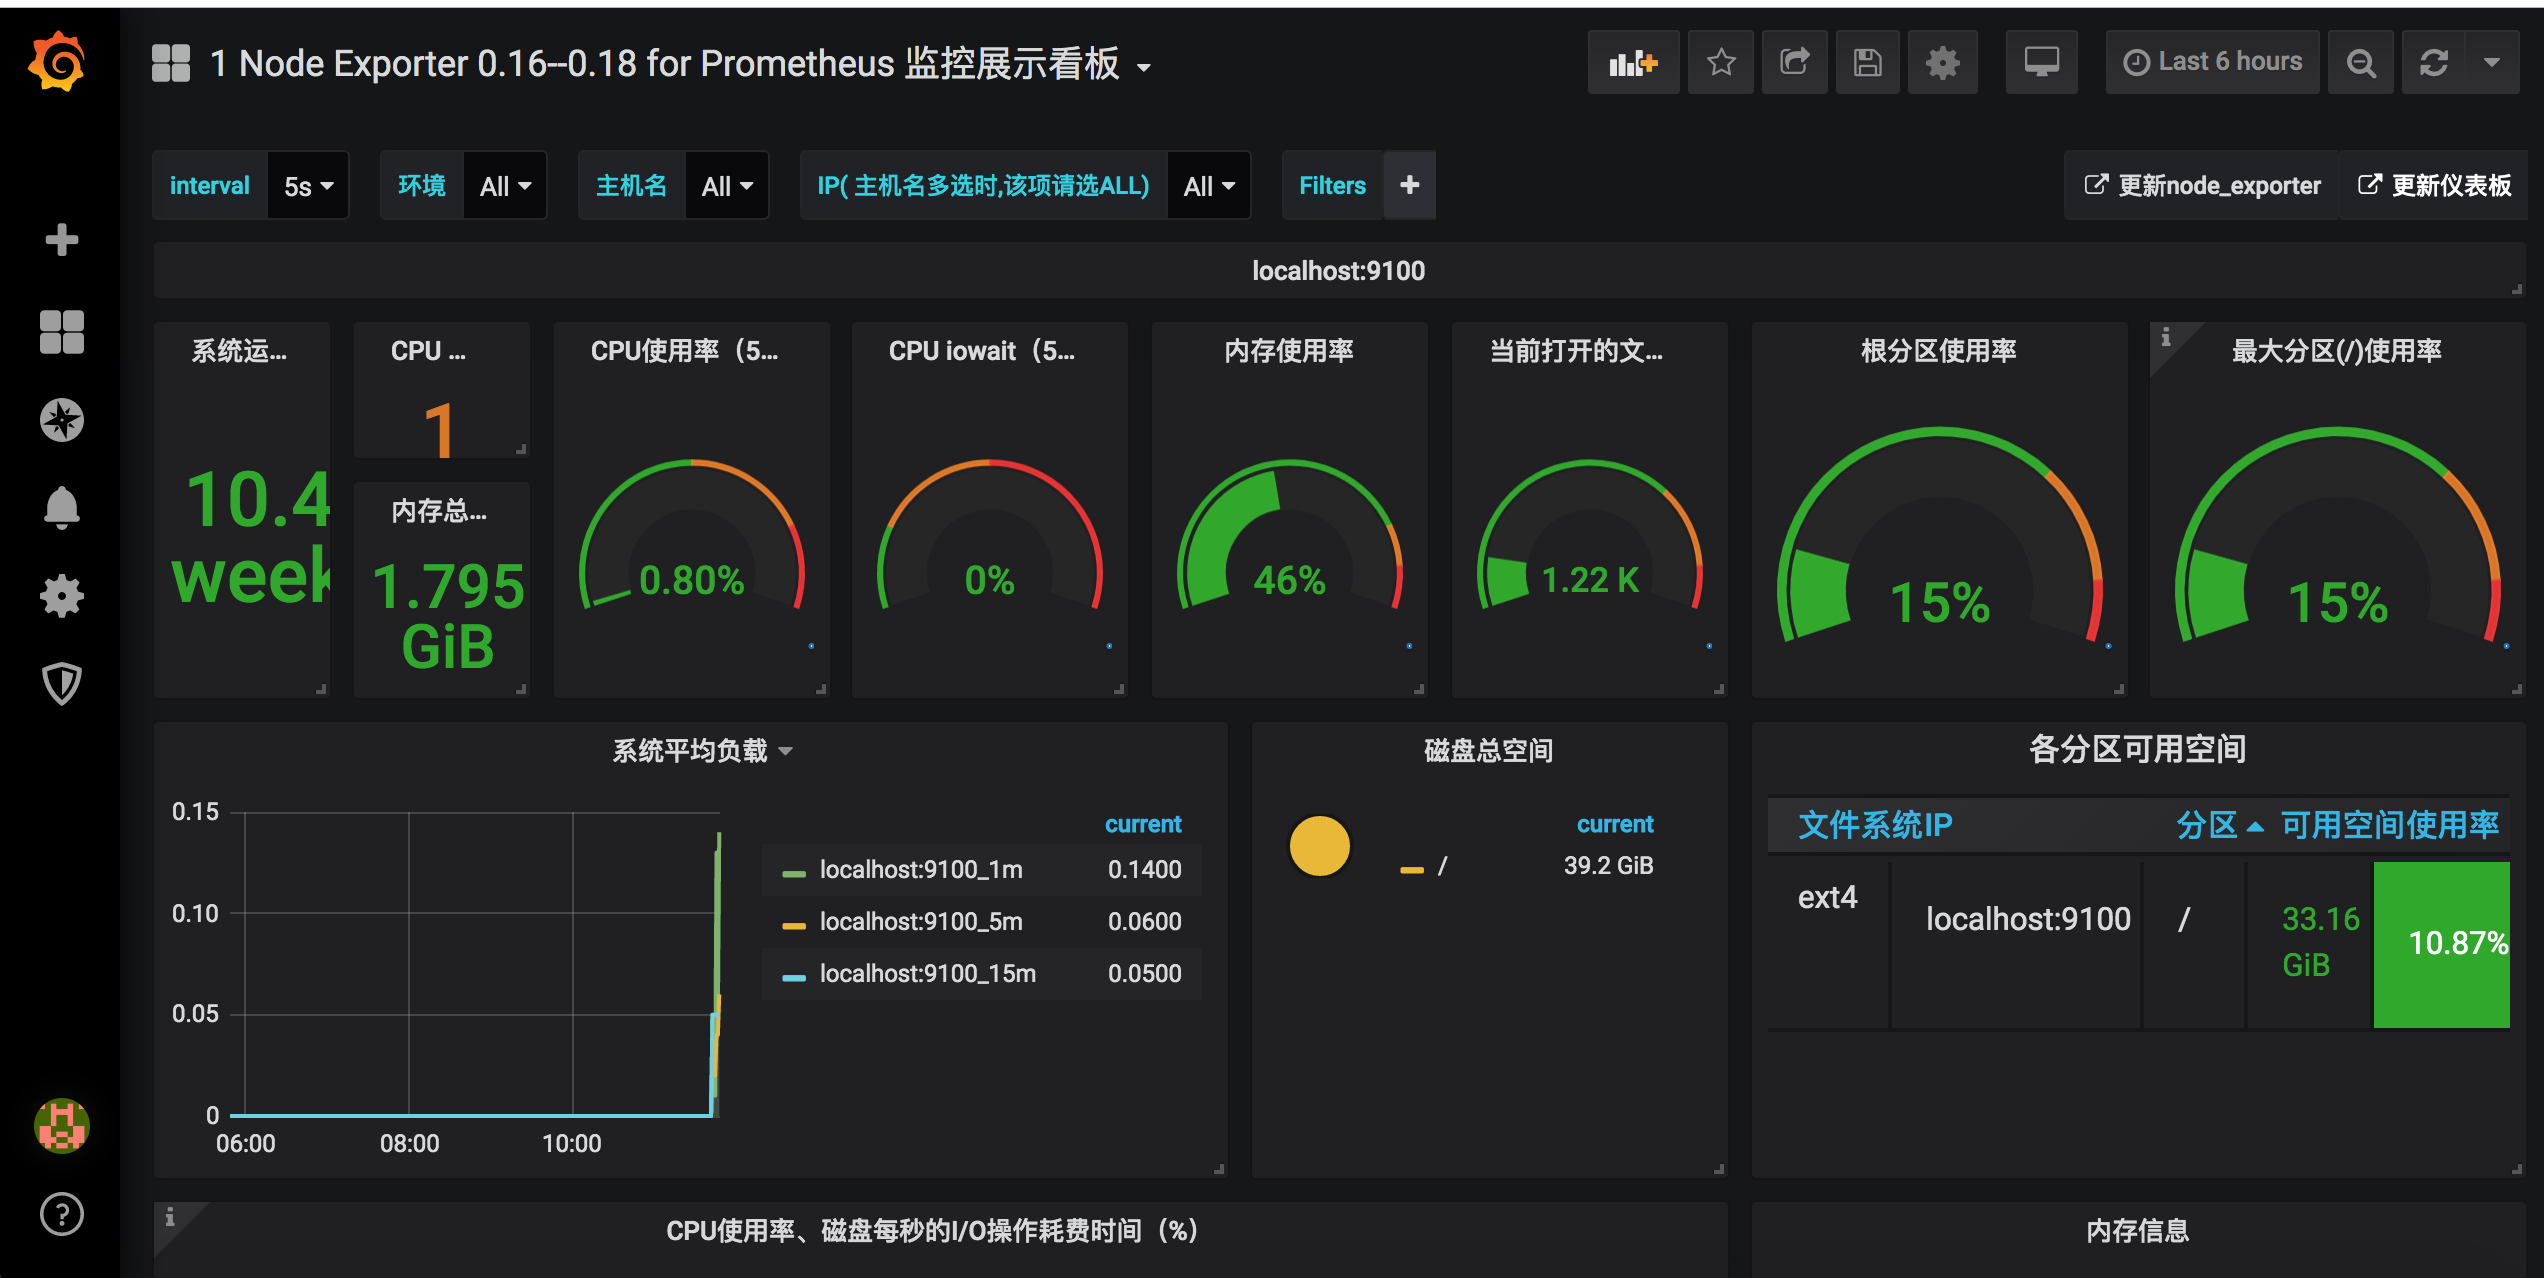
是不是觉得挺简单哉!那就赶快自己动手试一试吧!