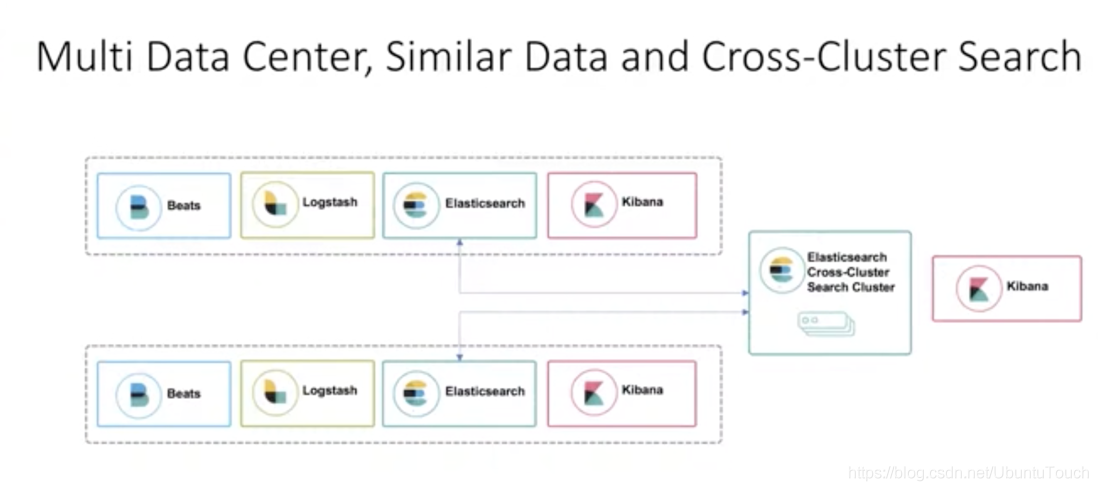
Search across the cluster (cross-cluster search) allows you for one or more remote cluster request to run a single search. For example, you can use the search across the cluster to filter and analyze log data stored in different data centers of clusters in.

As described above, when the client sends a request to the cluster our cluster_1, it can search the cluster itself, but can also send a request to the other two clusters cluster_2 and cluster_3. The end result is returned to the client by the cluster_1.
Currently supported APIs:
Search examples across a cluster
Sign up remote cluster
To perform a search across the cluster, you must configure at least one remote cluster. In a clustered configuration settings in the remote cluster
- Use cluster.remote property
- Seeds (seeds) are a list of remote nodes in the cluster to retrieve the registration status of a remote cluster cluster
The following Cluster Update Settings API request to add three remote clusters: cluster_one, cluster_two and cluster_three.
PUT _cluster/settings
{
  "persistent": {
    "cluster": {
      "remote": {
        "cluster_one": {
          "seeds": [
            "127.0.0.1:9300"
          ]
        },
        "cluster_two": {
          "seeds": [
            "127.0.0.1:9301"
          ]
        },
        "cluster_three": {
          "seeds": [
            "127.0.0.1:9302"
          ]
        }
      }
    }
  }
}
Hands
Installing the cluster
In today's practice, we set up two clusters:

In the above description, we configured with two clusters: cluster 1 and cluster 2. They are located within the same network, they can access each other. If you have not installed your Elasticsearch cluster, please refer to my previous article " Elastic: Rookie Start Guide " to install their own Elasticsearch and Kiban. During installation, we must note that:
- Our Elasticsearch and Kibana were unpacked and installed in different two directories . So that they do not interfere with each installation, which can form two different clusters, cluster although they may be the name of the same. For convenience, we put the names of two clusters are taken as cluster_1 and cluster_2.
- We can separately Elasticsearch configuration file config / elasticsearch.yml do above configuration. We also need to config / kibana.yml among Kibana do arranged such that cluster_1 Kibana corresponding port address is 5601, while for the Kibana cluster_2 port address is 5602.
In the above may be many people feel doubt: why we also need to configure the port addresses 9300 and 9301? In fact, Elasticsearch there are two important network communication mechanisms need to know:
- HTTP: HTTP communication address and port for binding, which is disclosed embodiment Elasticsearch REST API
- transport: for internal communication between the cluster nodes

When we installed our two clusters we can see by the following method:
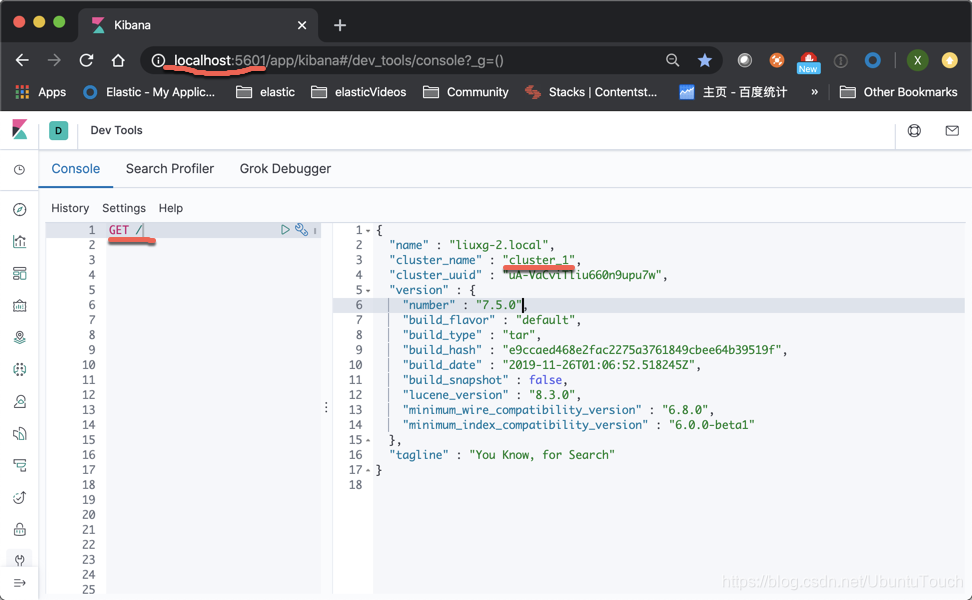
cluster_1
cluster_2
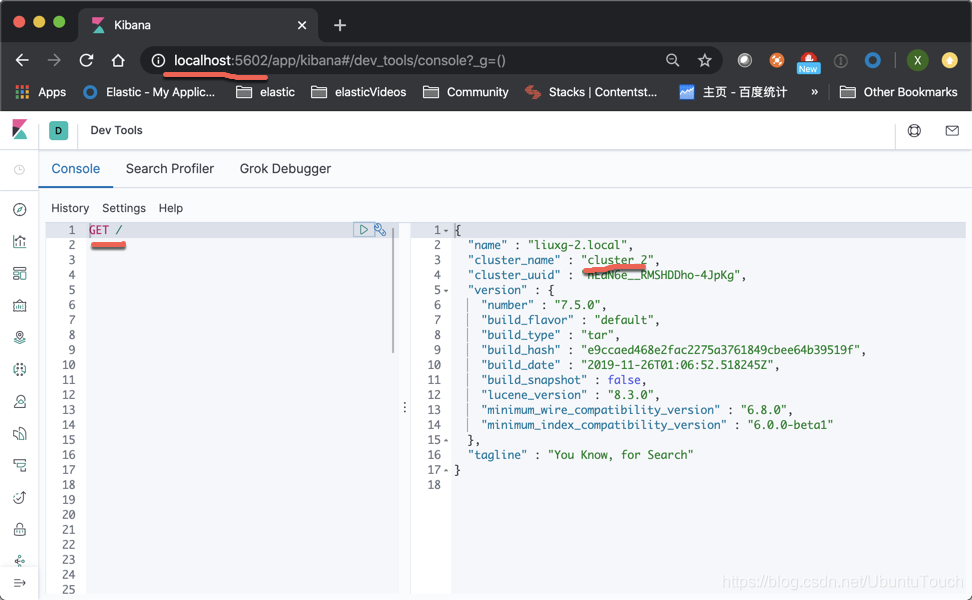
If we can see the screen above, while two clusters, cluster indicates that we have set correctly.
search for
We are going to configure. We kibana_2, also both port address Kibana 5602's. We enter the following command:
PUT _cluster/settings
{
  "persistent": {
    "cluster.remote": {
      "remote_cluster": {
        "seeds": [
          "127.0.0.1:9300"
        ]
      }
    }
  }
}
In the above, we cluster_2 in this configuration can be connected to a set cluster_1. Because cluster_1 the transport port address is 9300.
We can see the return information is as follows:

We then use the following command to check our connection status:
GET _remote/infoWe can see the following information in response:
{
  "remote_cluster" : {
    "seeds" : [
      "127.0.0.1:9300"
    ],
    "connected" : true,
    "num_nodes_connected" : 1,
    "max_connections_per_cluster" : 3,
    "initial_connect_timeout" : "30s",
    "skip_unavailable" : false
  }
}
It shows that our connection is successful.
This time we create the following index in Kibana_1 in twitter:
POST _bulk
{"index":{"_index":"twitter","_id":1}}
{"user":"张三","message":"今儿天气不错啊,出去转转去","uid":2,"age":20,"city":"北京","province":"北京","country":"中国","address":"中国北京市海淀区","location":{"lat":"39.970718","lon":"116.325747"}, "DOB": "1999-04-01"}
{"index":{"_index":"twitter","_id":2}}
{"user":"老刘","message":"出发,下一站云南!","uid":3,"age":22,"city":"北京","province":"北京","country":"中国","address":"中国北京市东城区台基厂三条3号","location":{"lat":"39.904313","lon":"116.412754"}, "DOB": "1997-04-01"}
{"index":{"_index":"twitter","_id":3}}
{"user":"李四","message":"happy birthday!","uid":4,"age":25,"city":"北京","province":"北京","country":"中国","address":"中国北京市东城区","location":{"lat":"39.893801","lon":"116.408986"}, "DOB": "1994-04-01"}
{"index":{"_index":"twitter","_id":4}}
{"user":"老贾","message":"123,gogogo","uid":5,"age":30,"city":"北京","province":"北京","country":"中国","address":"中国北京市朝阳区建国门","location":{"lat":"39.718256","lon":"116.367910"}, "DOB": "1989-04-01"}
{"index":{"_index":"twitter","_id":5}}
{"user":"老王","message":"Happy BirthDay My Friend!","uid":6,"age":26,"city":"北京","province":"北京","country":"中国","address":"中国北京市朝阳区国贸","location":{"lat":"39.918256","lon":"116.467910"}, "DOB": "1993-04-01"}
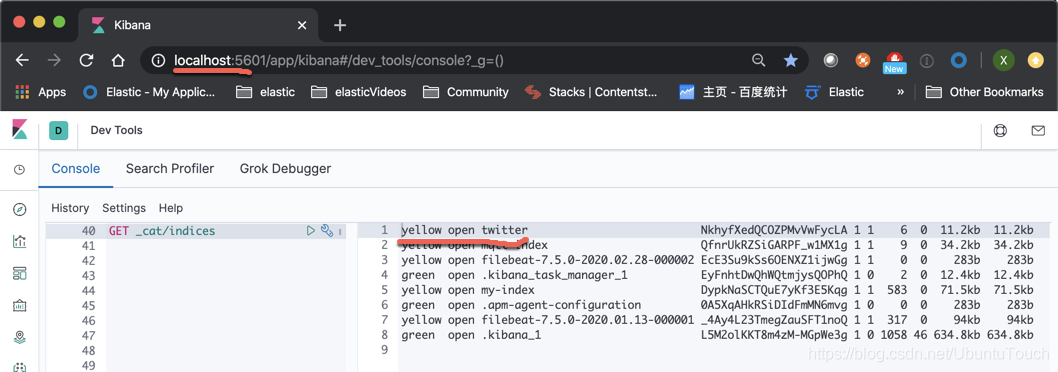
{"index":{"_index":"twitter","_id":6}}
{"user":"老吴","message":"好友来了都今天我生日,好友来了,什么 birthday happy 就成!","uid":7,"age":28,"city":"上海","province":"上海","country":"中国","address":"中国上海市闵行区","location":{"lat":"31.175927","lon":"121.383328"}, "DOB": "1991-04-01"}We can check twitter indexed by the following command in Kibana_1 in has been successfully created:
In the above, we can see that we have succeeded in creating an index on twitter cluster_1, then we how this search on cluster_2 it?
We Kibana_2 in, enter the following command:
GET remote_cluster:twitter/_searchWe will see the following output:

We can see from the above, we can search on twitter located cluster_1 the index.
Analysis of remote index
cluster_1
In Kibana_1, we have to load our test data by the following method:
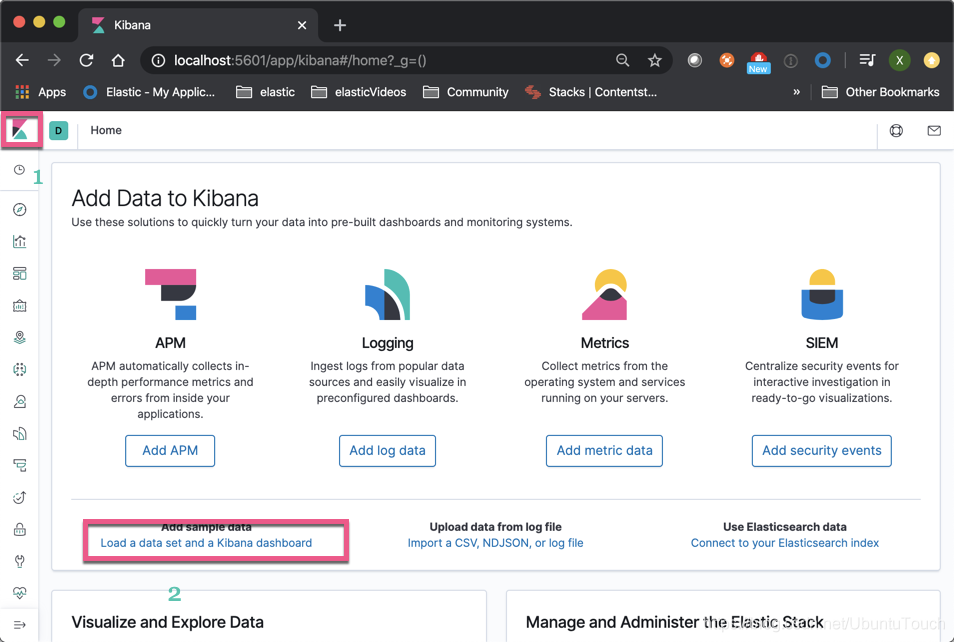
Then click " the Add the Data ":

So cluster_1, we have successfully loaded the Sample flight data index.
cluster_2
We opened Kibana_2, and to create an index pattern cluster_1 in the Sample flight data
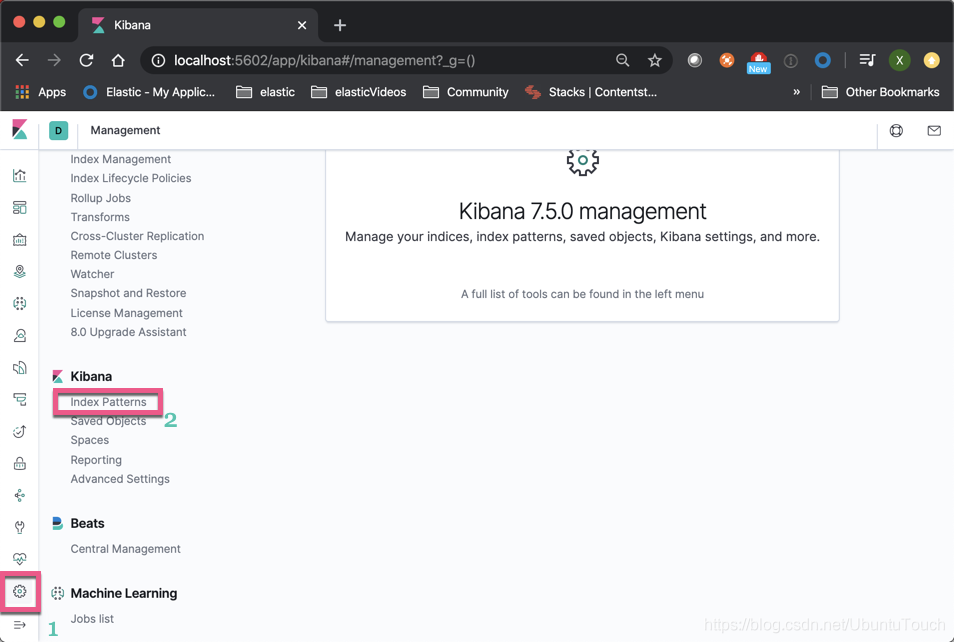
Click on " the Create index pattern ":
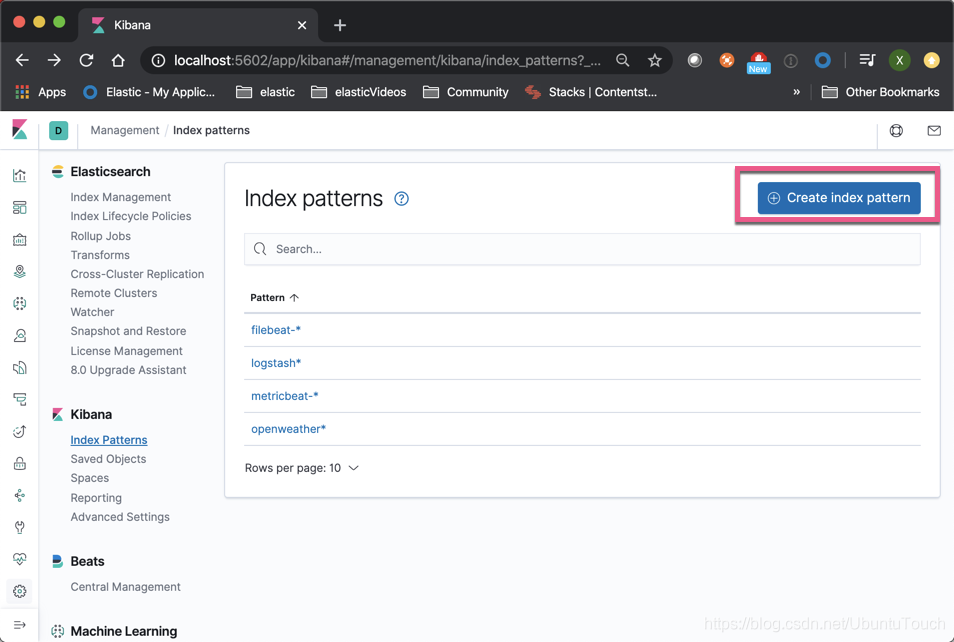
Enter the index we want. Note that preceded remote_cluster:
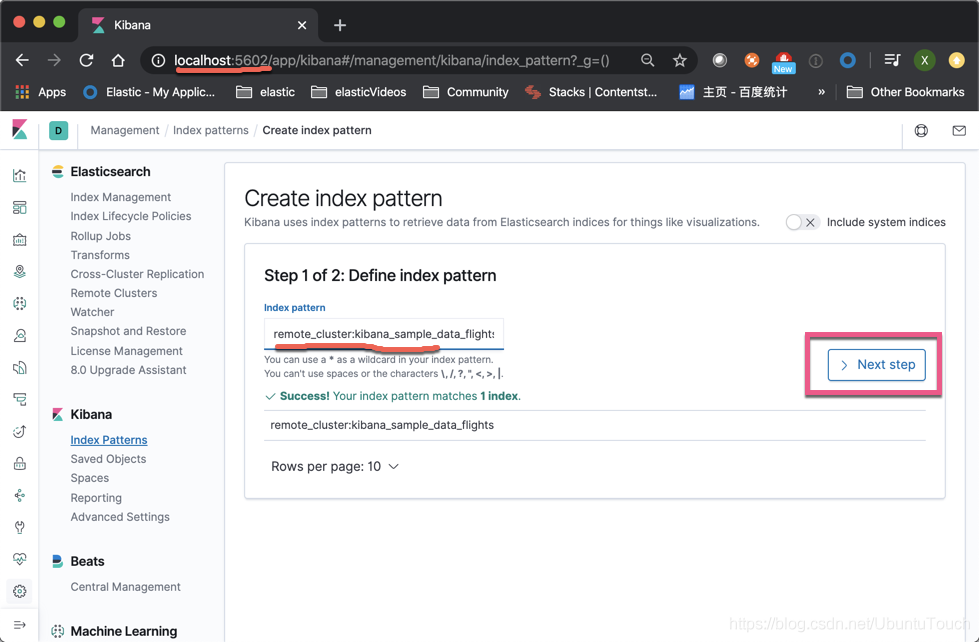
In the above, if we have the same type of local and remote index (for example, we collect data for different parts of the server), we can use a comma "," all the indexes together to make a index pattern, such as : remote_cluster: kibana_sample_data_flights, my_local_index.
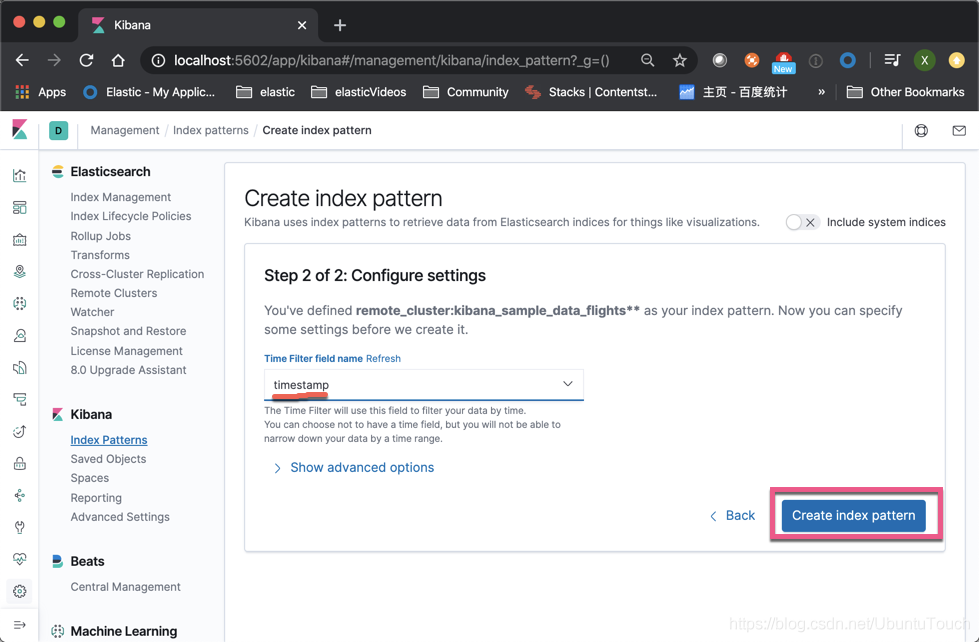
Click on " the Create index pattern ":

In this way, we create cluster_1 located in the index of a index pattern. We click on the upper right corner of the star, and make it our default index.
We click on the upper left corner Kibana_2 Discover:

Because our default index is remote_cluster: kibana_sample_data_flights, so by default Discover our first show is all about kibana_sample_data_flights index data located on the cluster_1. We can analyze these data in cluster_2.
reference:
【1】https://www.elastic.co/guide/en/elasticsearch/reference/current/modules-cross-cluster-search.html
