demand
1. A developer can not log in to view the online server logs
2. each system has its log, log dispersed difficult to locate
3. log large amount of data, look for slow, not enough real-time data
Solution: ELK deployment platform
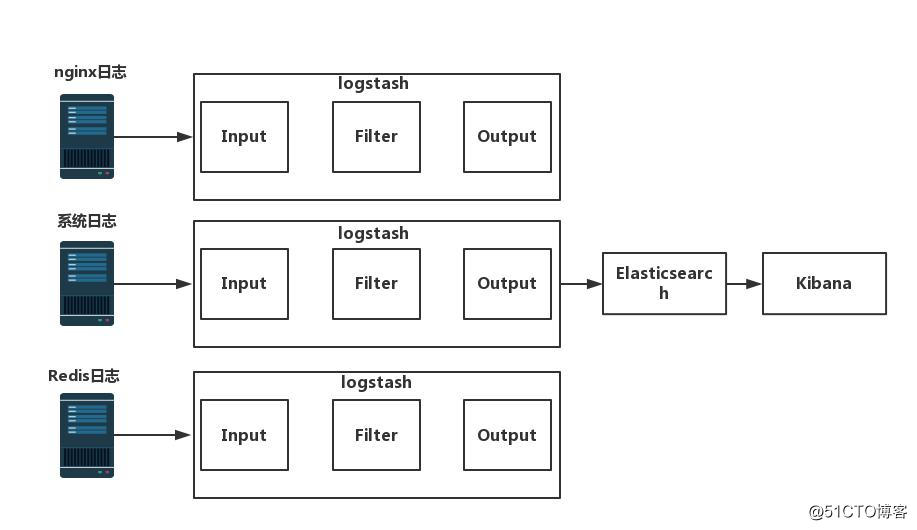
ELK Introduction
ELK is an abbreviation of three open source software, respectively: Elasticsearch, Logstash, Kibana, they are open source software. Added a FileBeat, it is a lightweight log collection processing tools (Agent), Filebeat small footprint, suitable for transmission to Logstash after collecting log on each server.
ELK Chart
Elasticsearch profile:
Elasticsearch is an open source distributed search engine that provides collection, analysis, storage of data three functions.
Features: distributed, zero-configuration, auto-discovery, auto-slice index, index replication mechanism, restful style interfaces, multiple data sources, such as automatic load search.
Deployment Elasticsearch
Configuring source yum
--import RPM https://packages.elastic.co/GPG-KEY-elasticsearch # Import key
vim /etc/yum.repos.d/elasticsearch.repo # source arranged yum
[elasticsearch-2.x]
name=Elasticsearch repository for 2.x packages
baseurl=http://packages.elastic.co/elasticsearch/2.x/centos
gpgcheck=1
gpgkey=http://packages.elastic.co/GPG-KEY-elasticsearch
enable=1
2. Install elasticsearch
yum install elasticsearch -y #安装elasticsearch
3. Configure Elasticsearch
vim /etc/elasticsearch/elasticsearch.yml
cluster.name: yltx    #17行 集群名称
node.name: node1   #23行 节点名称
path.data: /data/es-data   #33行工作目录
path.logs: /var/log/elasticsearch  #37行日志目录
bootstrap.memory_lock: true    #43行 防止交换swap分区
network.host: 0.0.0.0    #54行 监听网络
http.port: 9200   #58行 端口
mkdir -p /data/es-data
chown -R elasticsearch:elasticsearch /data/es-data/
4. Unlock memory and file limits
Production environment must be modified (note)
vim /etc/security/limits.conf
末尾插入
elasticsearch soft memlock unlimited
elasticsearch hard memlock unlimited
* soft nofile 65535
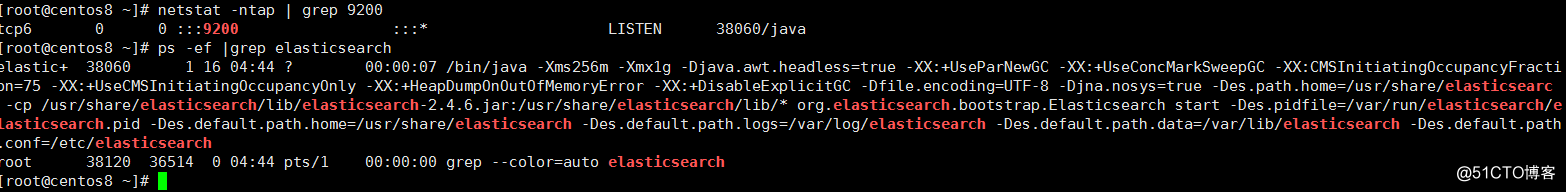
* hard nofile 65535systemctl start elasticsearch.service # start the service
netstat -ntap | grep 9200
PS -ef | grep elasticsearch
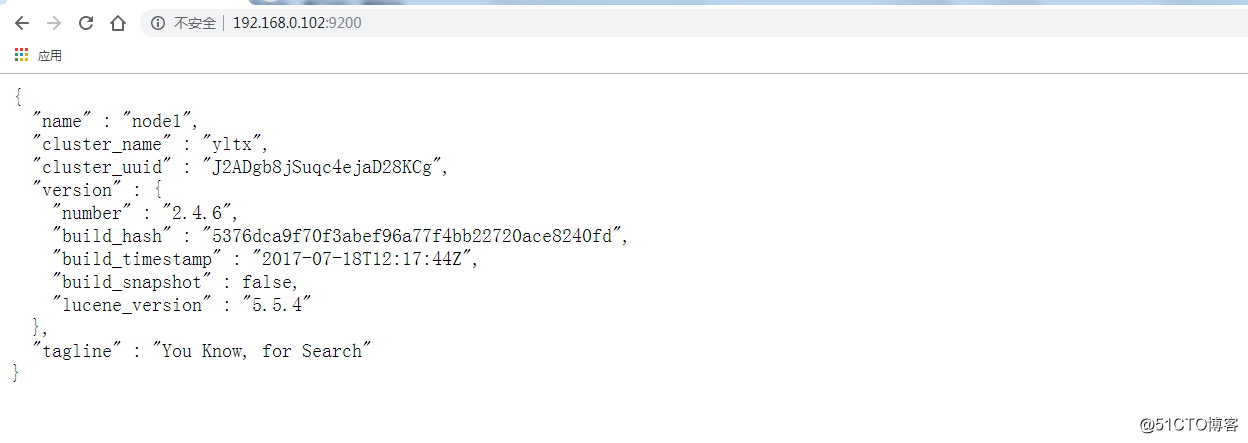
Page testing: http://192.168.0.102:9200/
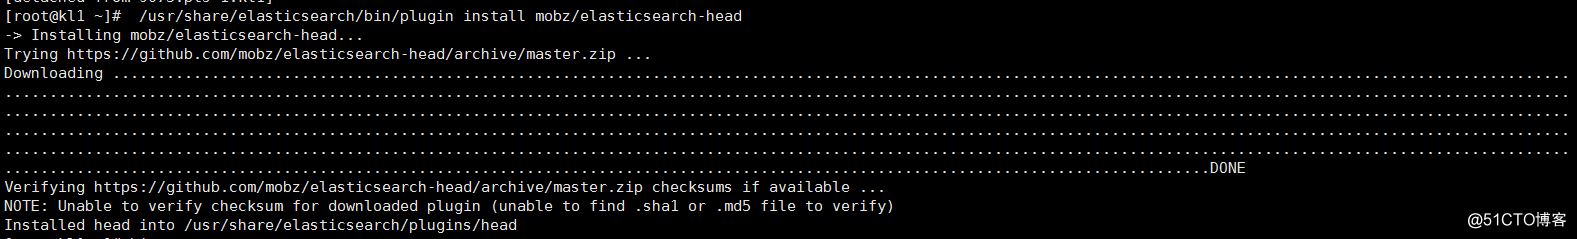
Installation Elasticsearch - head plug
/usr/share/elasticsearch/bin/plugin install mobz/elasticsearch-head
Web access:
http://192.168.0.102:9200/_plugin/head/
Logstash description:
Logstash mainly used to log collection, analysis, log filtering tools to support large amounts of data acquisition mode. General work of c / s architecture, client installed on the host side need to collect logs, server side is responsible for each node the received log is filtered, modification and other operations in a concurrent to elasticsearch up.
logstash collect logs the basic process: the INPUT -> CODEC -> filter -> CODEC -> the Output
the 1.INPUT: collect logs from where.
2.filter: issuing filtered prior to
3.output: Elasticsearch output to the message queue or Redis
4.codec: output to the front, to facilitate simultaneous practice test
The log the amount of data collected in accordance months
Deployment Logstash
Configuring source yum
vim /etc/yum.repos.d/logstash.repo
[logstash-2.1]
name=Logstash repository for 2.1.x packages
baseurl=http://packages.elastic.co/logstash/2.1/centos
gpgcheck=1
gpgkey=http://packages.elastic.co/GPG-KEY-elasticsearch
enable=1
2. Download and install logstash
yum install logstash -y
Test logstash
The basic syntax of logstash
input {
指定输入
}output {
指定输出
}
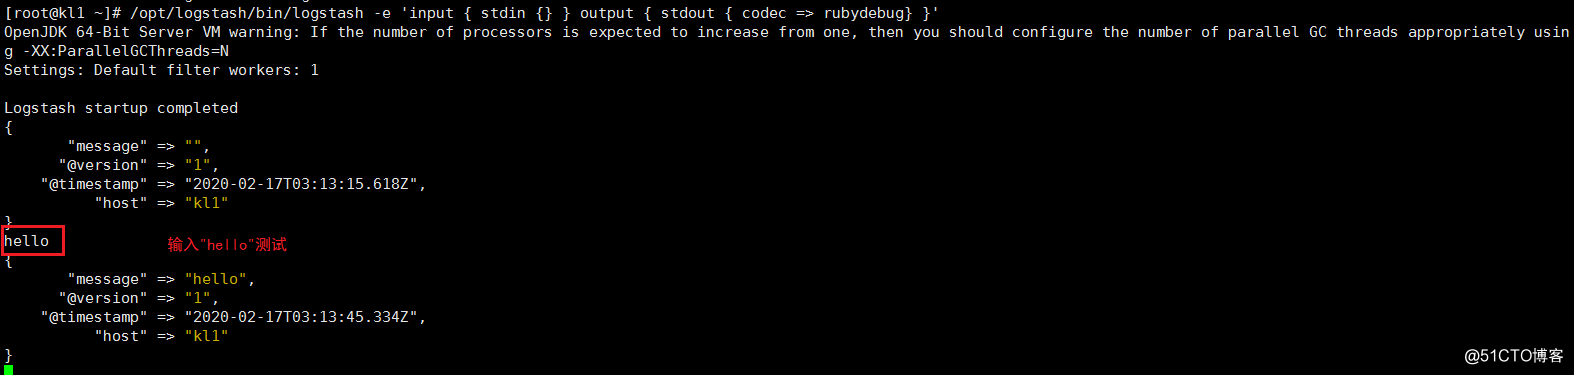
1.测试标准输入输出
使用rubydebug方式前台输出展示以及测试
/opt/logstash/bin/logstash -e 'input { stdin {} } output { stdout { codec => rubydebug} }'
hello #输入hello测试
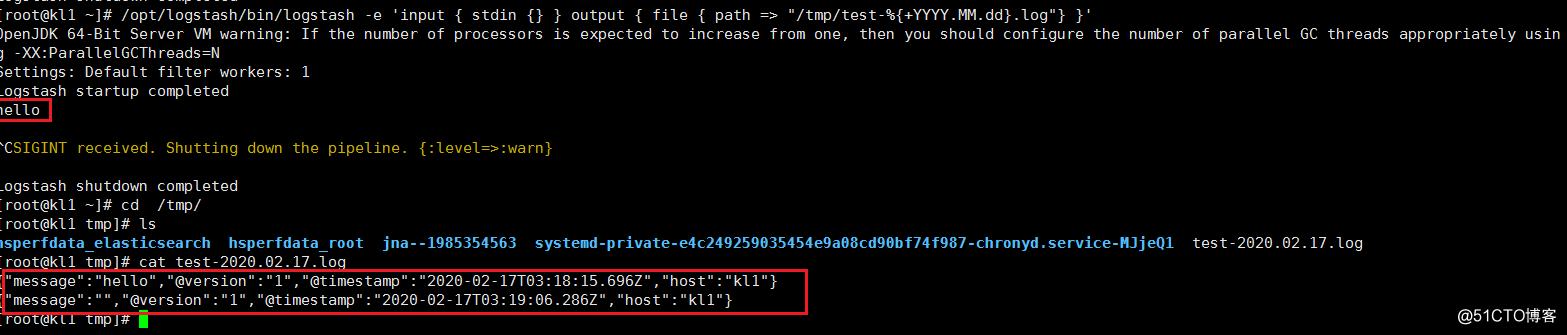
2.测试输出到文件
/opt/logstash/bin/logstash -e 'input { stdin {} } output { file { path => "/tmp/test-%{+YYYY.MM.dd}.log"} }'
cat /tmp/test-2020.02.17.log
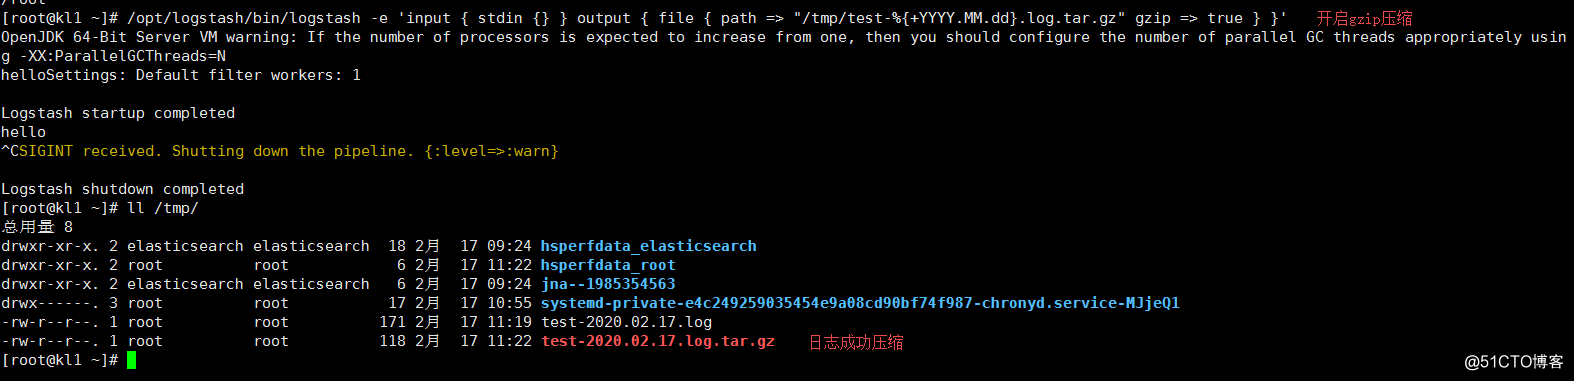
3.开启日志压缩
/opt/logstash/bin/logstash -e 'input { stdin {} } output { file { path => "/tmp/test-%{+YYYY.MM.dd}.log.tar.gz" gzip => true } }'
ll /tmp/
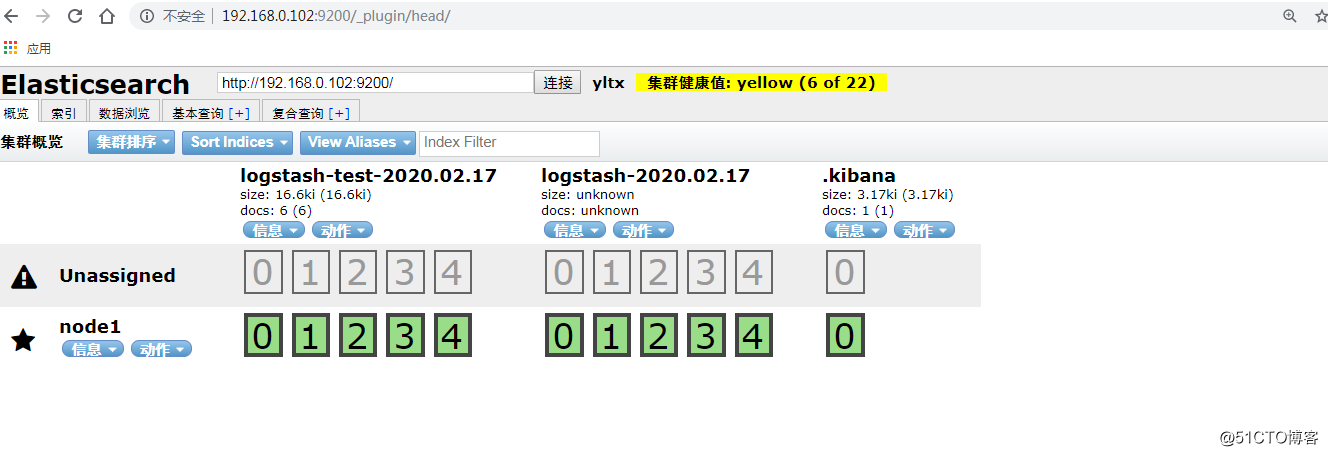
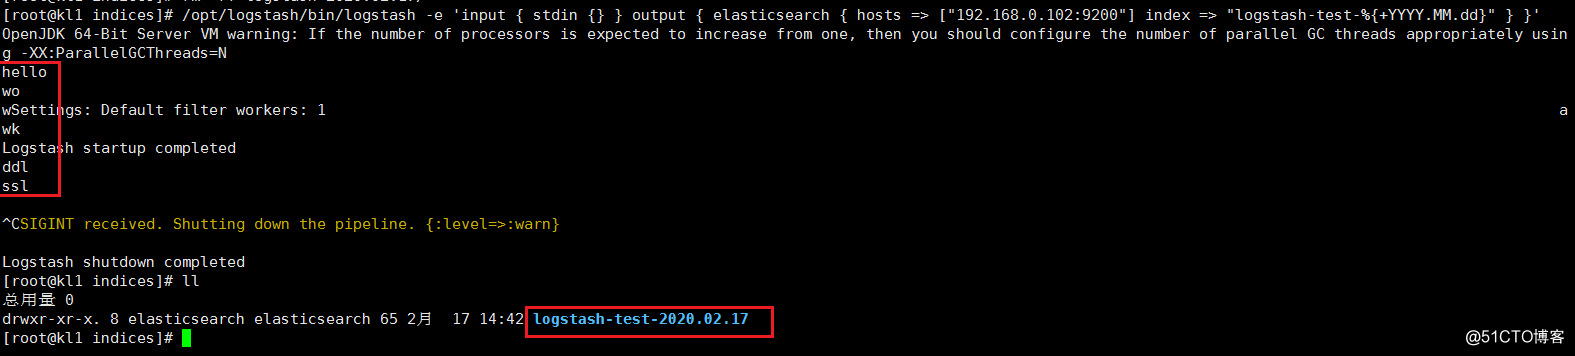
4.测试输出到elasticsearch
/opt/logstash/bin/logstash -e 'input { stdin {} } output { elasticsearch { hosts => ["192.168.0.102:9200"] index => "logstash-test-%{+YYYY.MM.dd}" } }'
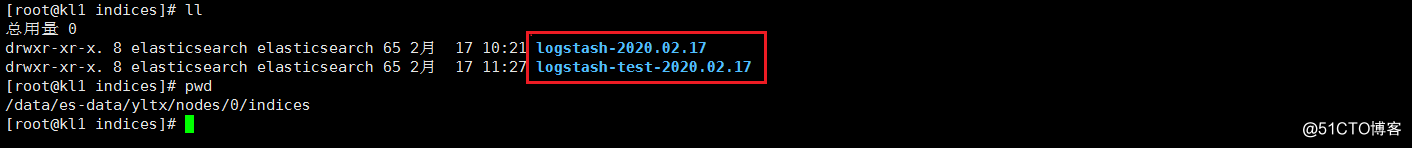
ll /data/es-data/yltx/nodes/0/indices
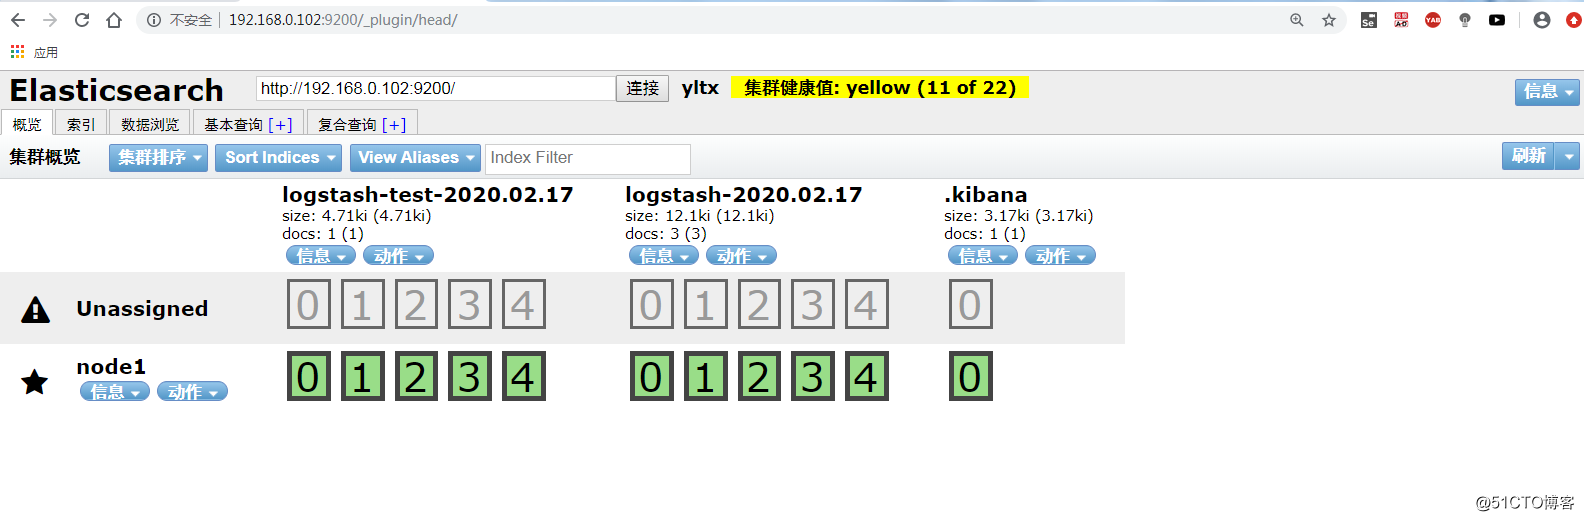
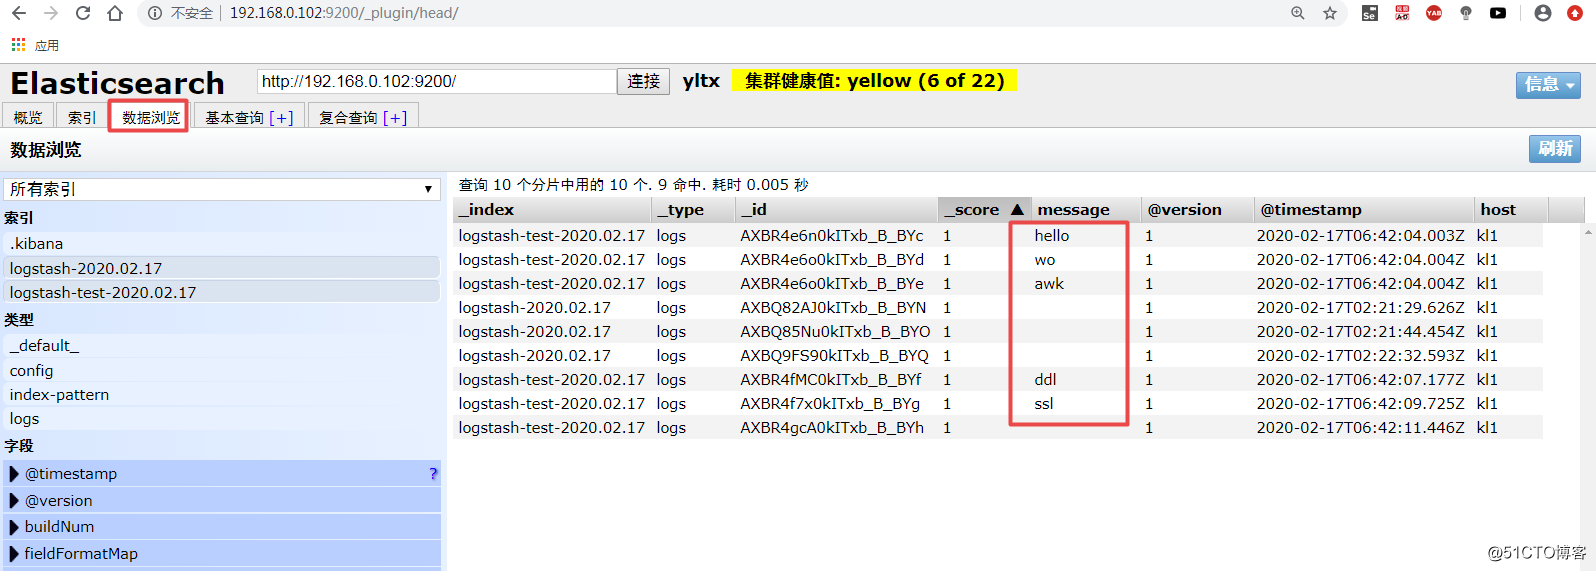
5.网页验证
Kibana 简介
Kibana 也是一个开源和免费的工具,Kibana可以为 Logstash 和 ElasticSearch 提供的日志分析友好的 Web 界面,可以帮助汇总、分析和搜索重要数据日志。
Kibana 部署
1.下载安装kibana
wget https://artifacts.elastic.co/downloads/kibana/kibana-7.6.0-linux-x86_64.tar.gz
tar zxvf kibana-7.6.0-linux-x86_64.tar.gz -C /opt/
mv /opt/kibana-7.6.0-linux-x86_64/ /usr/local/kibana
2.修改配置
vim /usr/local/kibana/config/kibana.yml
server.port: 5601           #2行 访问端口
server.host: "0.0.0.0"   #5行 监听网络
elasticsearch.url: "http://192.168.0.102:9200"    #12行 ES地址
kibana.index: ".kibana" #20行 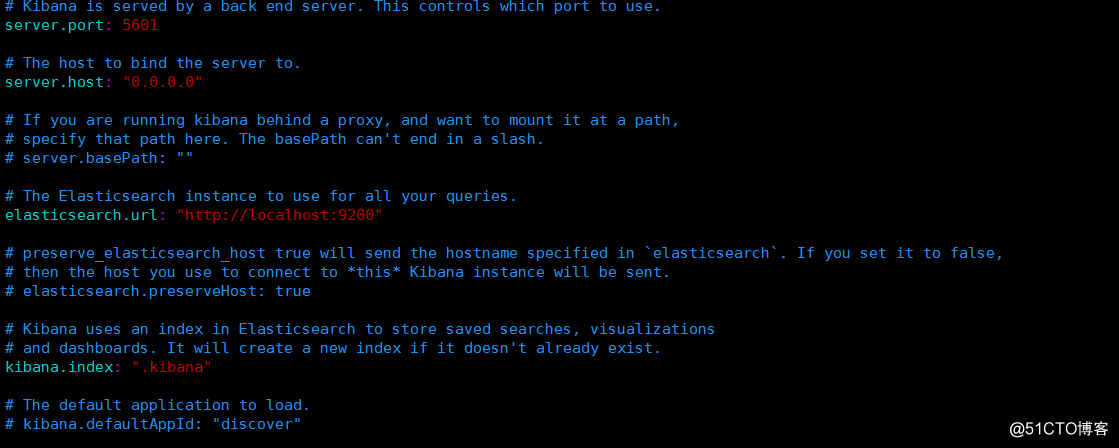
3.启动服务
/usr/local/kibana/bin/kibana &
netstat -ntap |grep 5601 #查看端口号

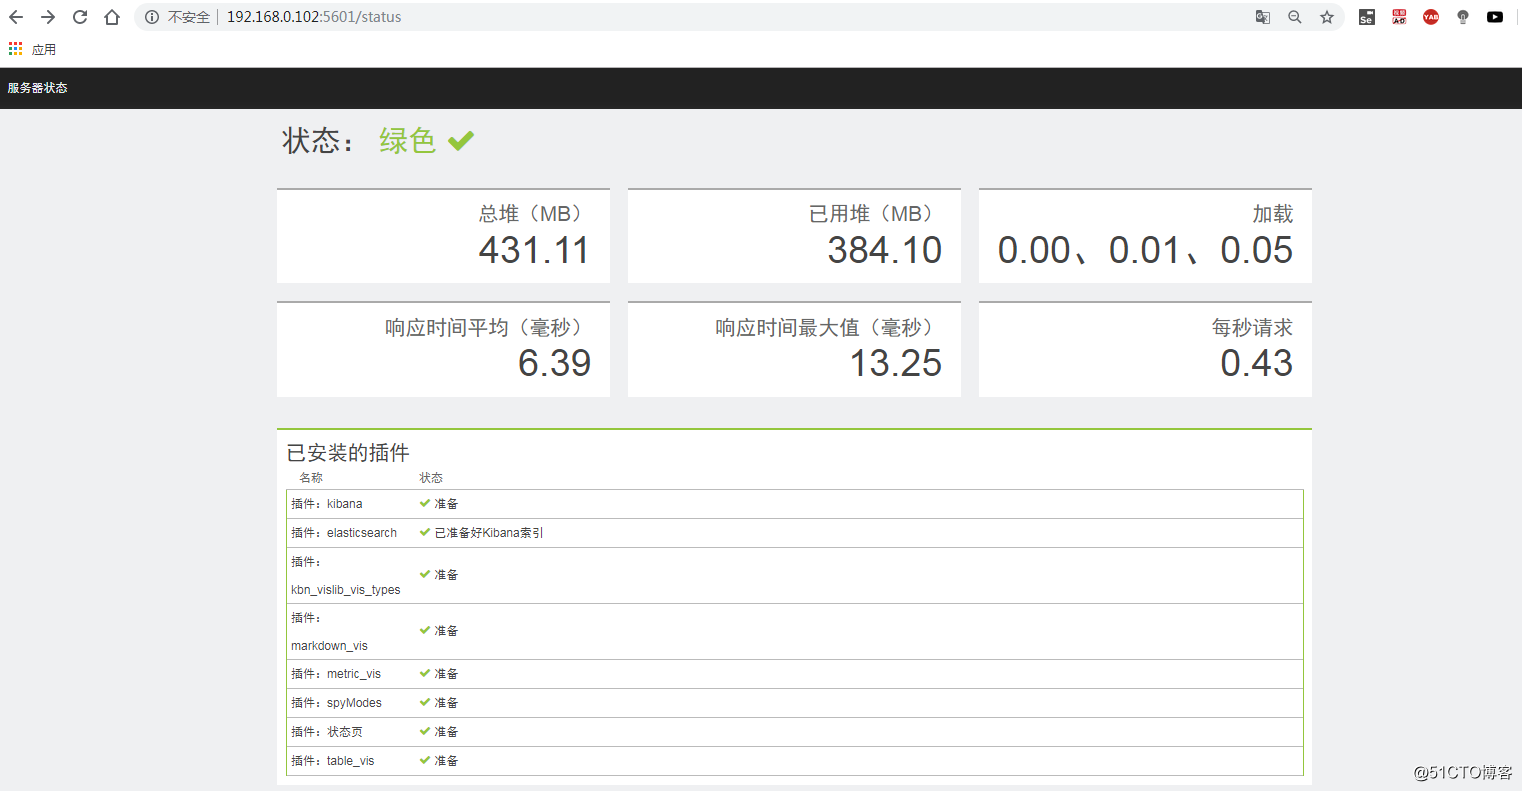
4.网页验证:
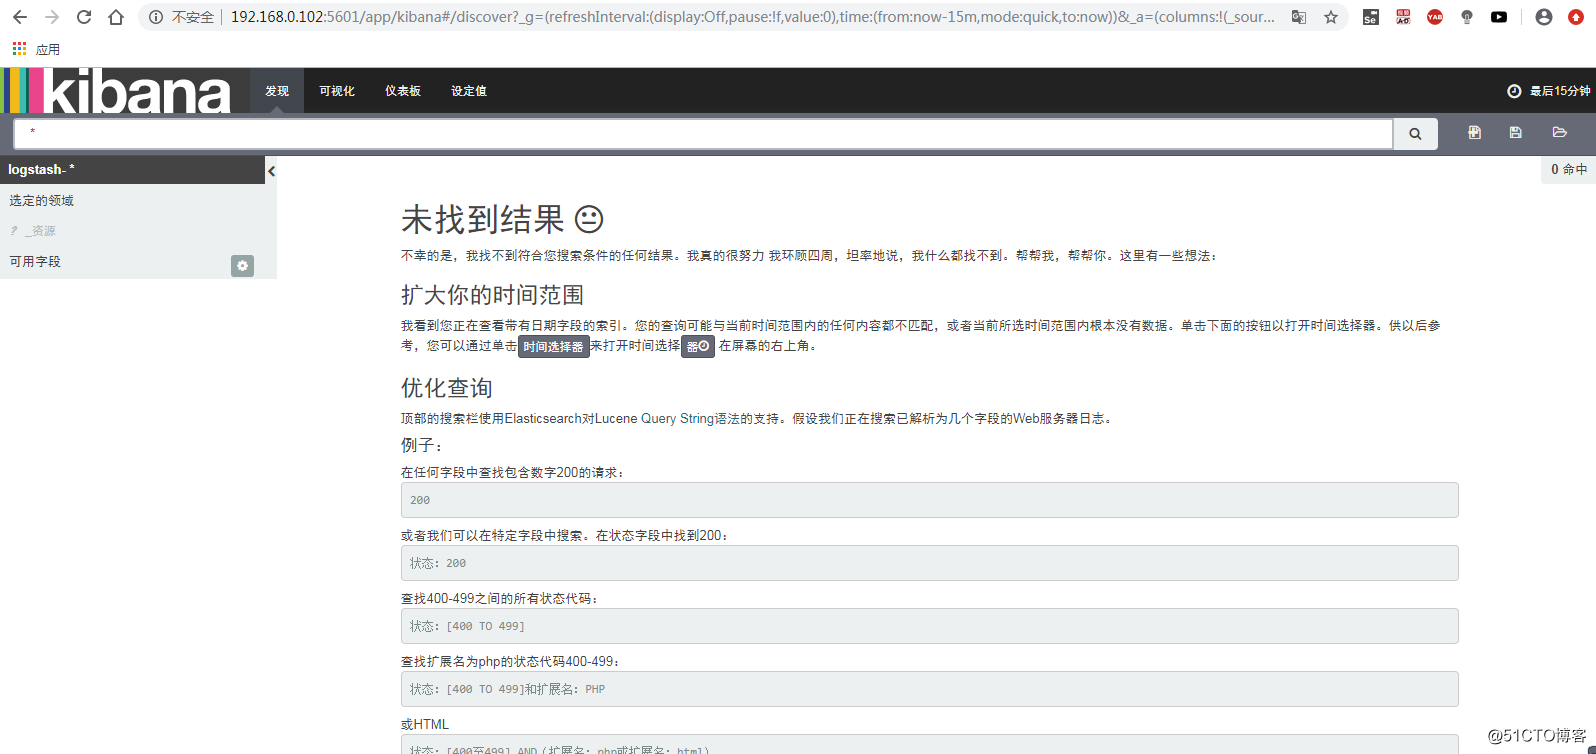
测试 ELK平台
收集系统日志和收集java异常日志
1.修改logstash配置文件:
vim /root/file.conf
input {
            file {
                    path => "/var/log/messages"     #收集系统日志
                    type => "system"
                    start_position => "beginning"
            }
            file {
                    path => "/var/log/elasticsearch/yltx.log"   #收集java异常日志
                    type => "es-error"
                    start_position => "beginning"
                    codec => multiline {
                    pattern => "^\["
                    negate => true
                    what => "previous"
                }
            }
}

output {

         if [type] == "system" {
                 elasticsearch {
                         hosts => ["192.168.0.102:9200"]
                         index => "system-%{+YYYY.MM.dd}"
                 }
         }

         if [type] == "es-error" {
                 elasticsearch {
                         hosts => ["192.168.0.102:9200"]
                         index => "es-error-%{+YYYY.MM.dd}"
                 }
         }
}
2.写入到elasticsearch中
/opt/logstash/bin/logstash -f /root/file.conf
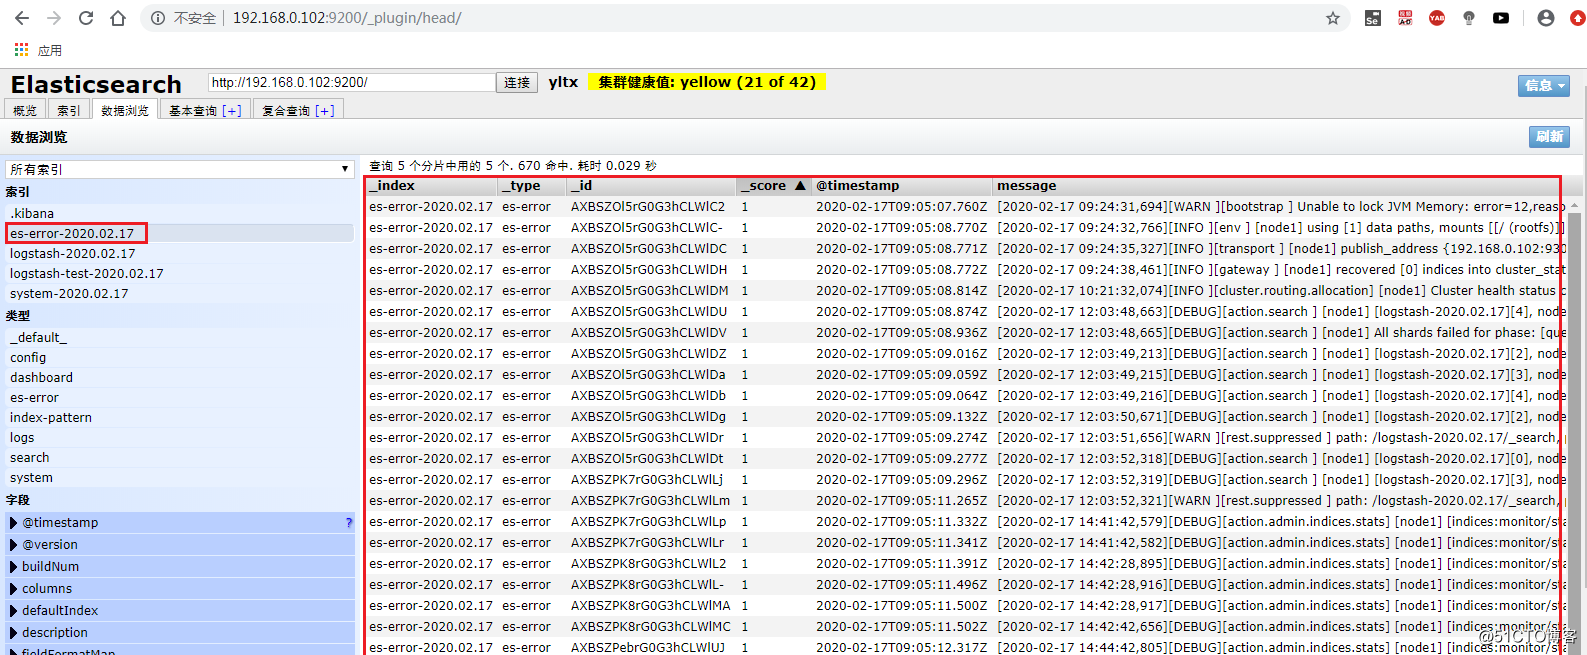
3. Check Elasticsearch
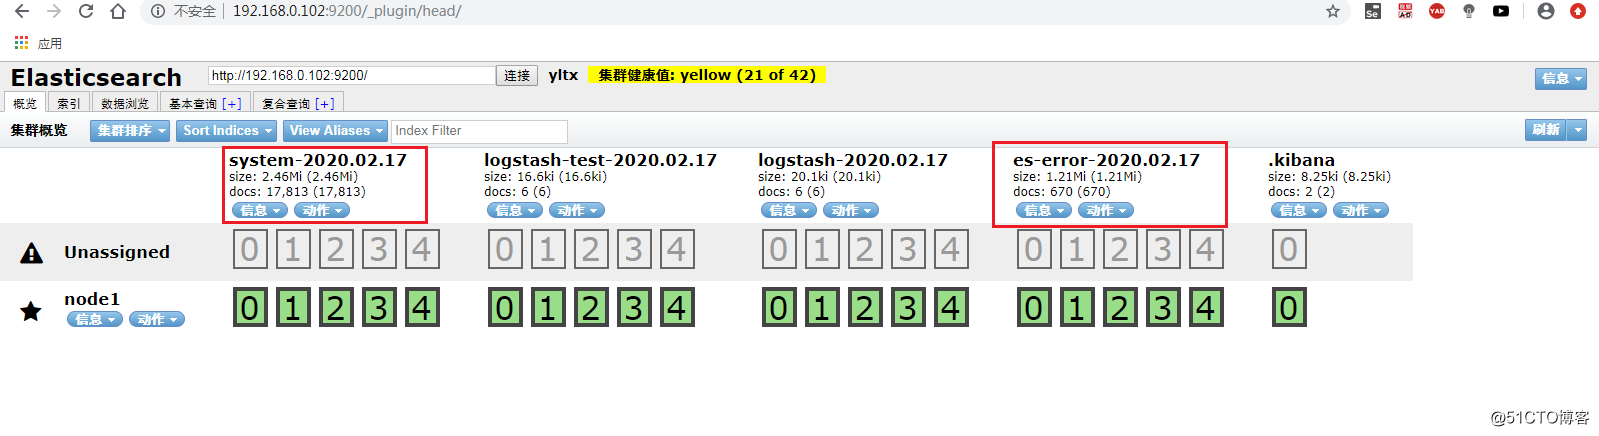
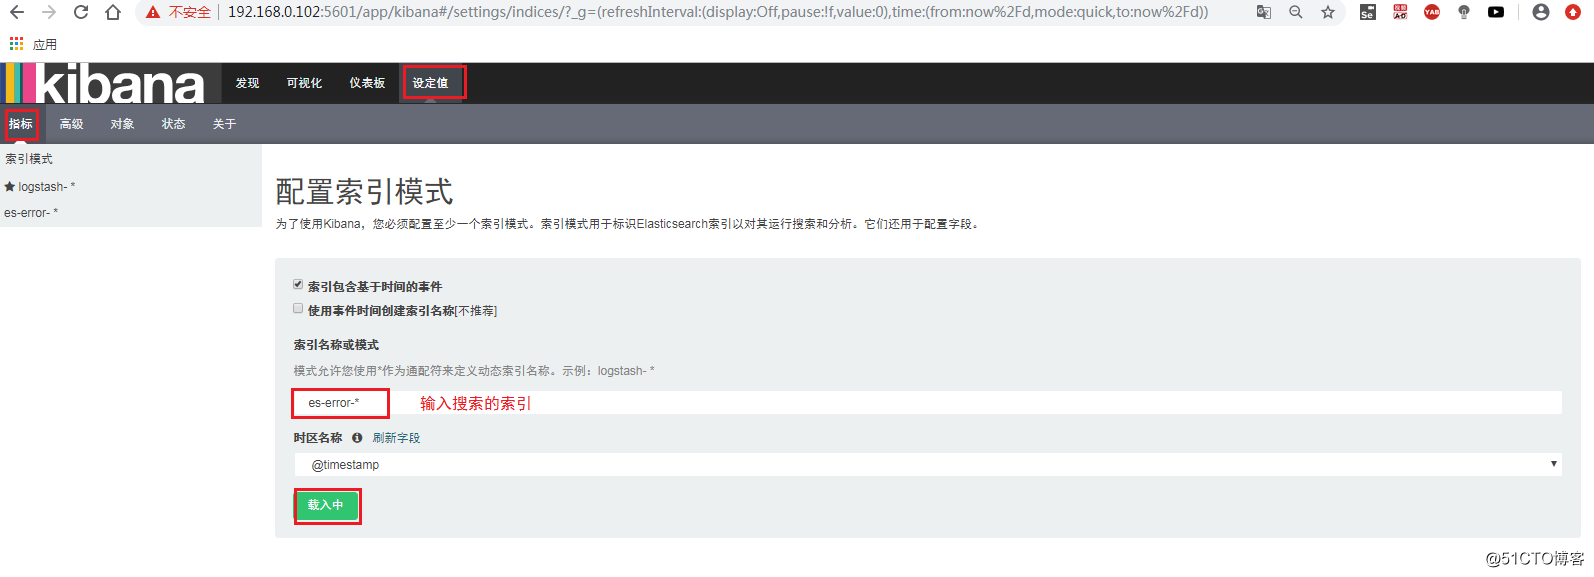
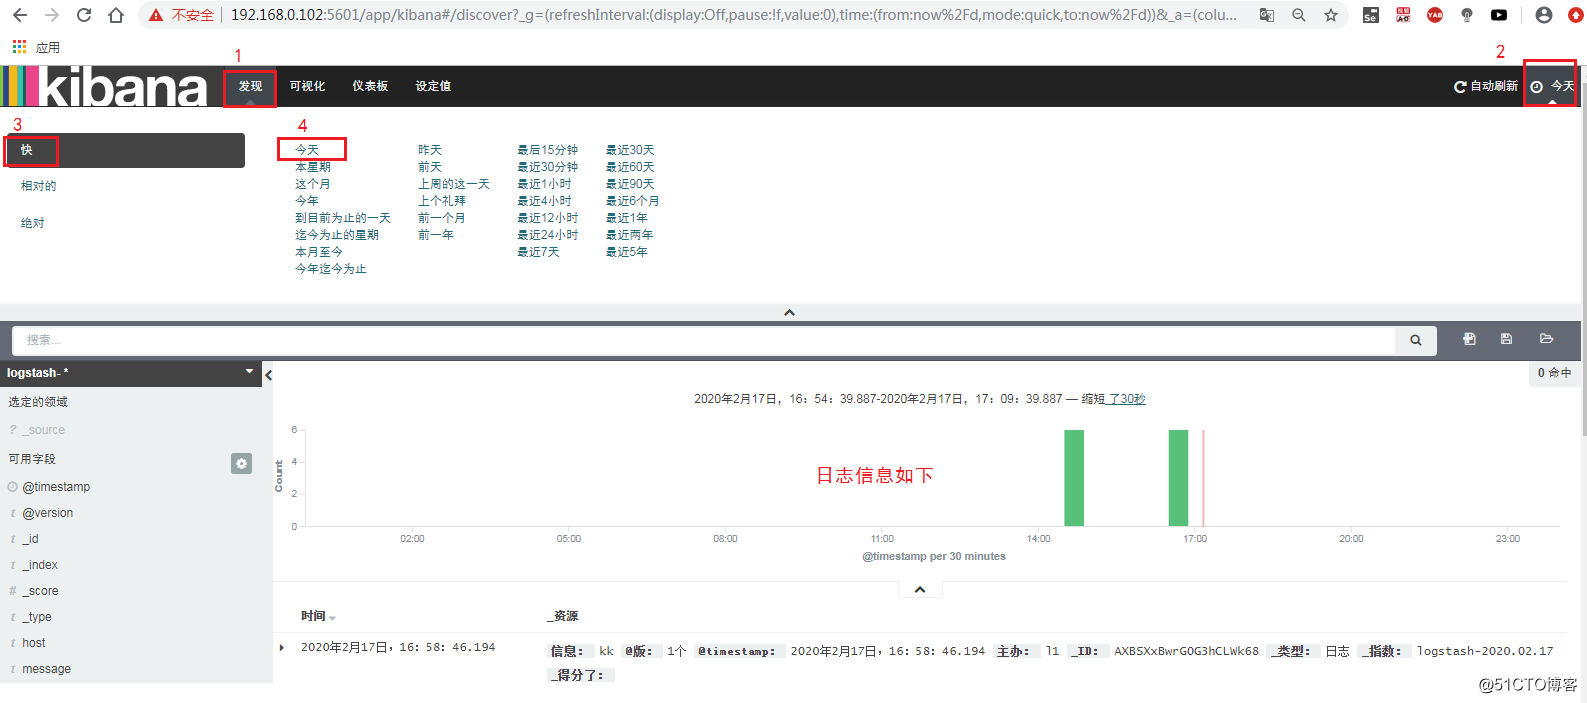
4. 查看 Kibana
Relevant information
ELK official website: https://www.elastic.co/cn/
Chinese Guide: https://www.gitbook.com/book/chenryn/elk-stack-guide-cn/details