supplement
1. Pre-environment
1.2 Responsible for es on server1
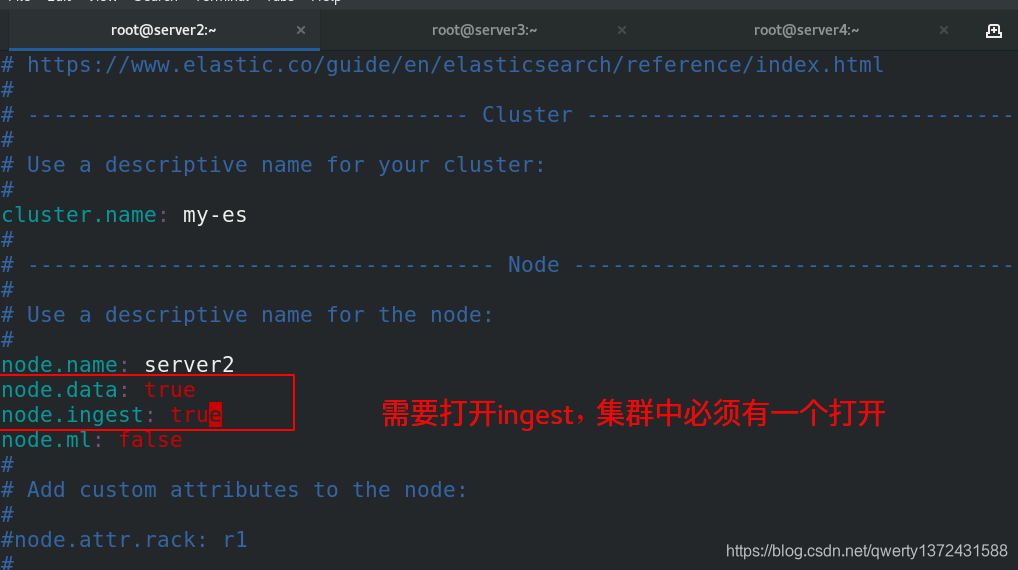
[root@server2 ~]# vim /etc/elasticsearch/elasticsearch.yml ##编辑配置文件,紧接这xpack实验做
[root@server2 ~]# systemctl start elasticsearch.service ##启动es服务,每个集群都要启动
[root@server2 ~]# cat /var/log/elasticsearch/my-es.log ##查看日志信息,看是否启动成功
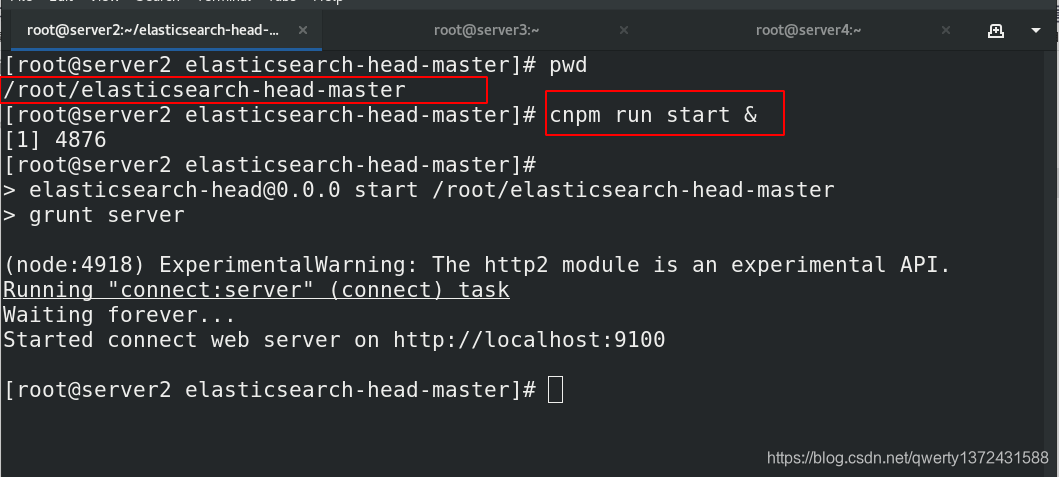
[root@server2 elasticsearch-head-master]# pwd
/root/elasticsearch-head-master
[root@server2 elasticsearch-head-master]# cnpm run start &
[root@server2 ~]# rm -fr /var/lib/elasticsearch/nodes/ ##如果因为之前的残留文件出错,可以删除数据目录在重新启动
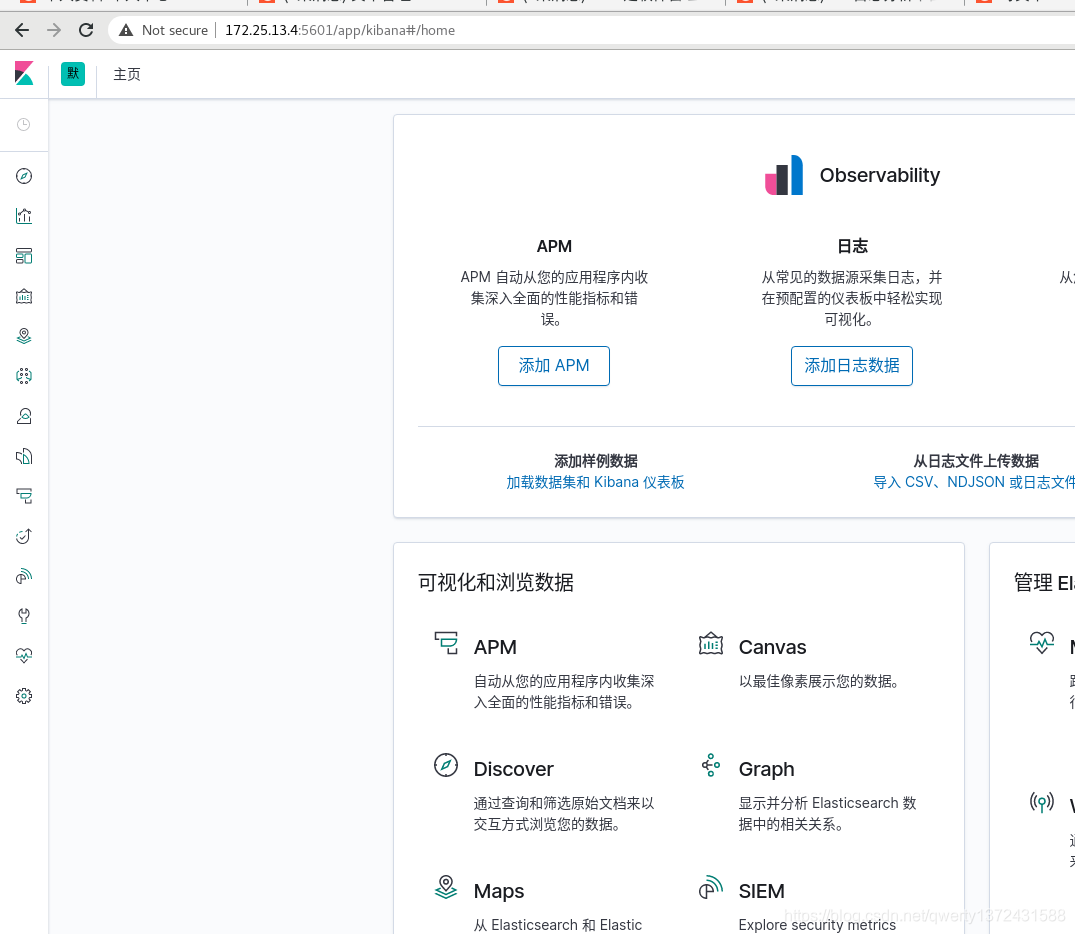
1.2 Responsible for kibana on server4
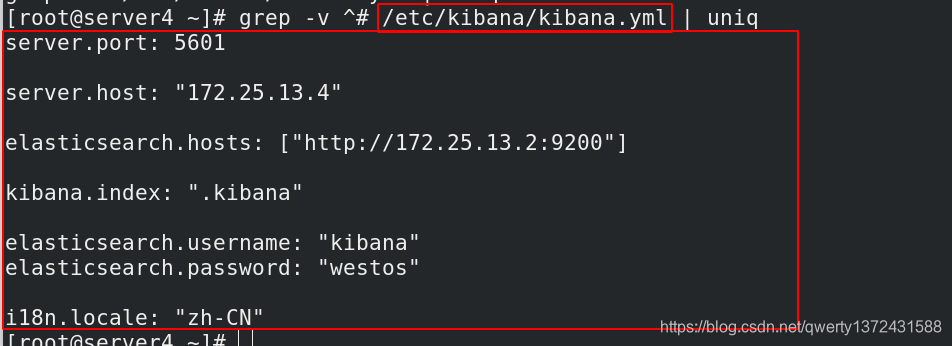
[root@server4 ~]# grep -v ^# /etc/kibana/kibana.yml | uniq
server.port: 5601
server.host: "172.25.13.4"
elasticsearch.hosts: ["http://172.25.13.2:9200"]
kibana.index: ".kibana"
elasticsearch.username: "kibana"
elasticsearch.password: "westos"
i18n.locale: "zh-CN"
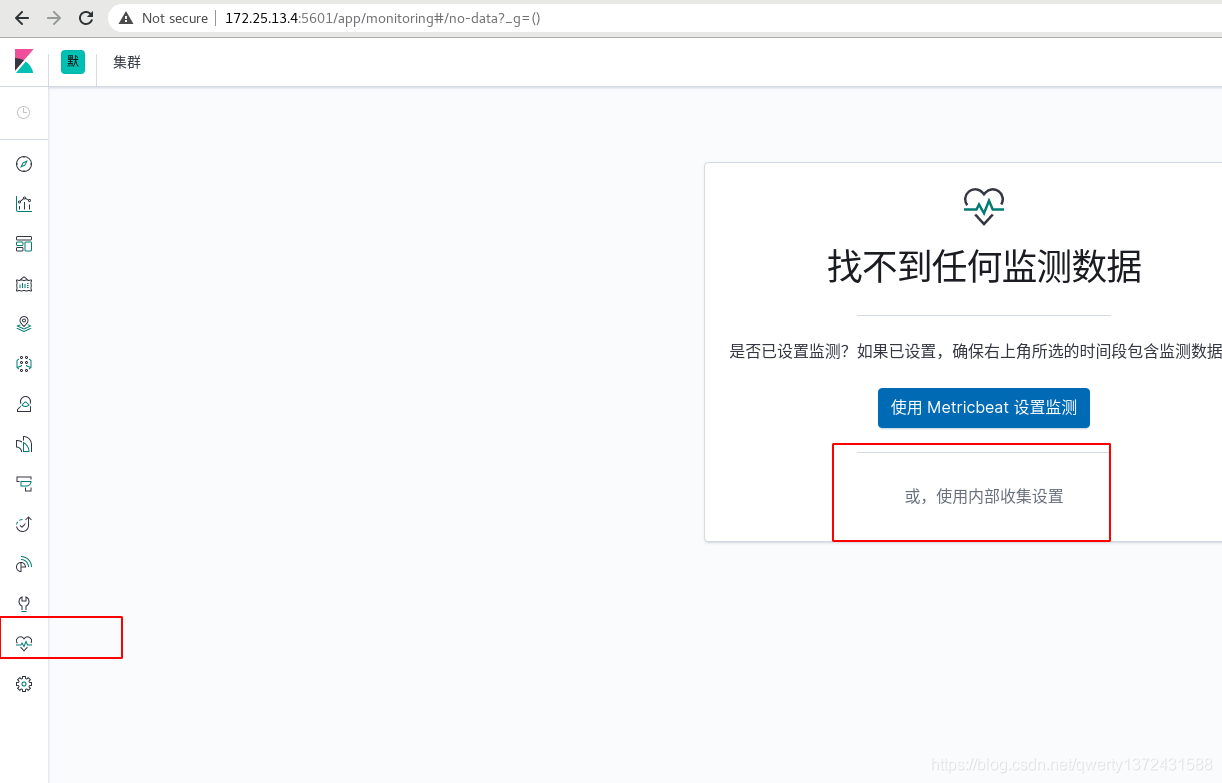
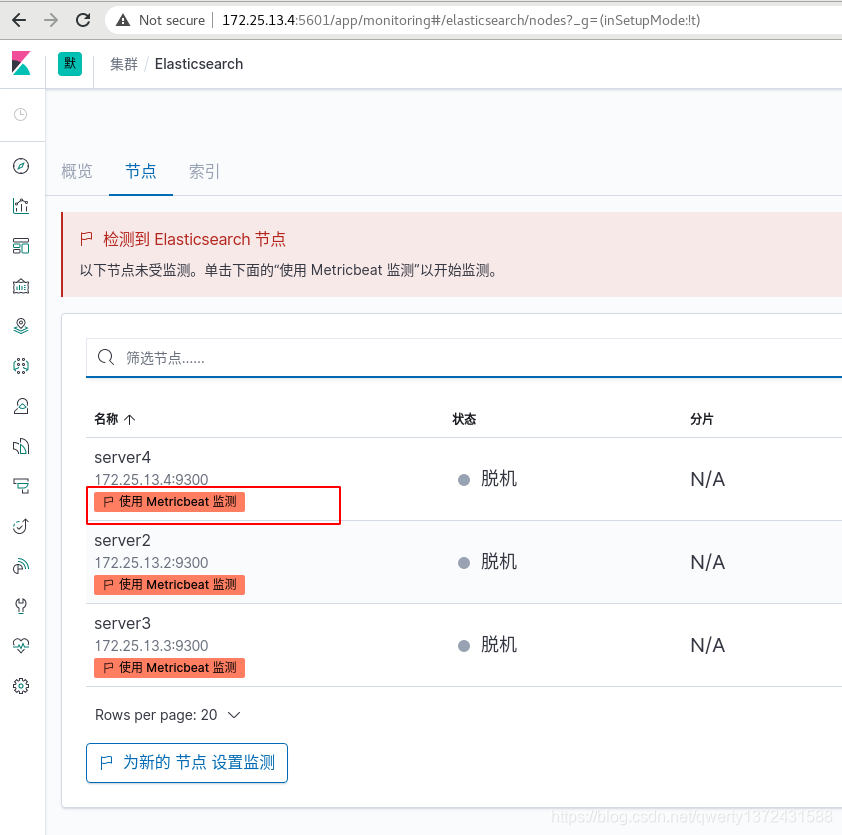
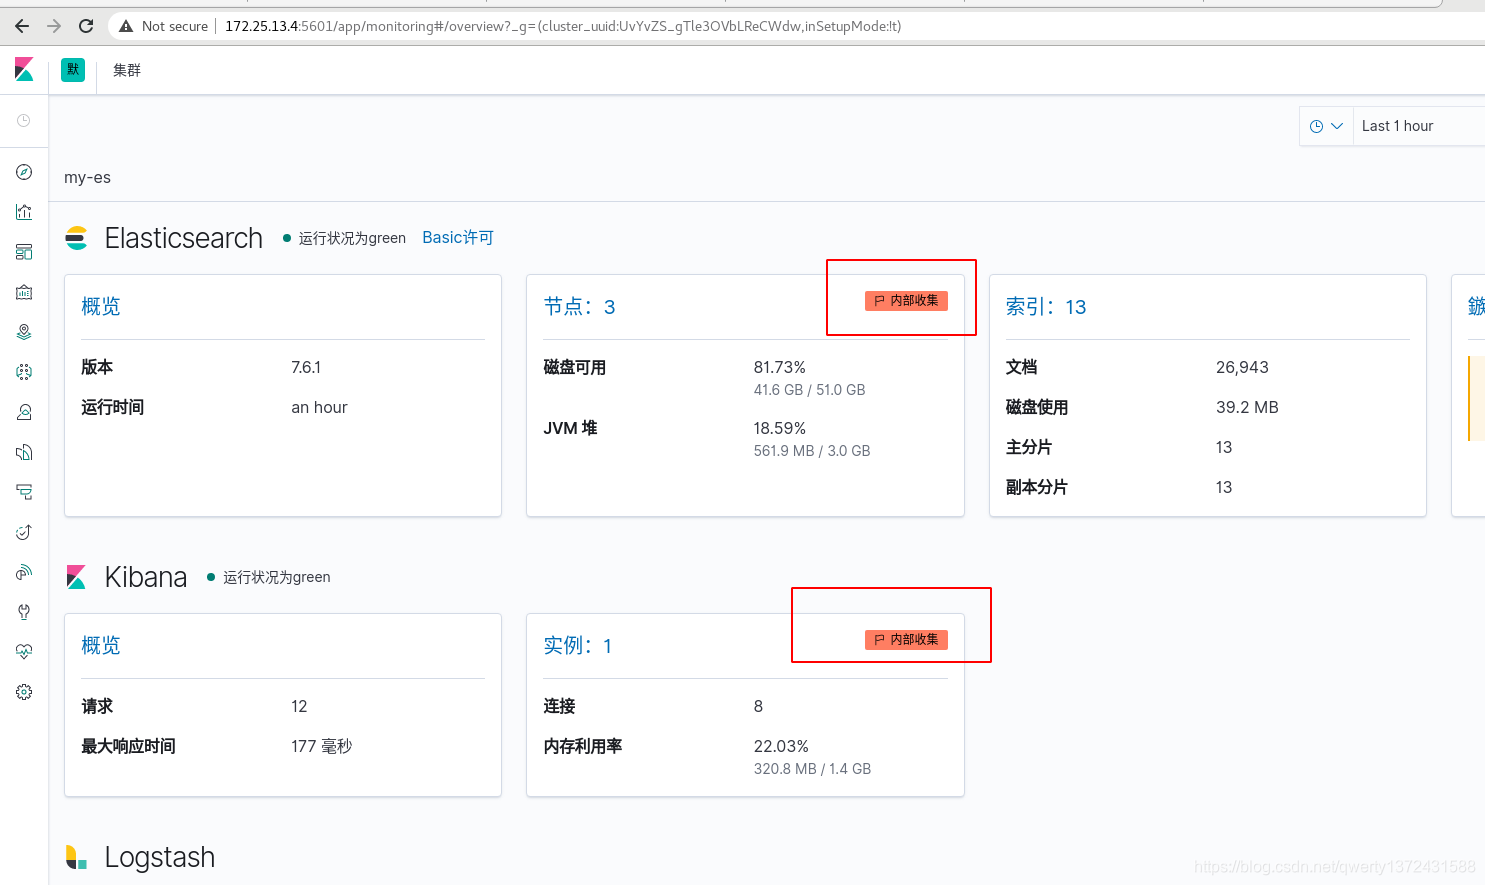
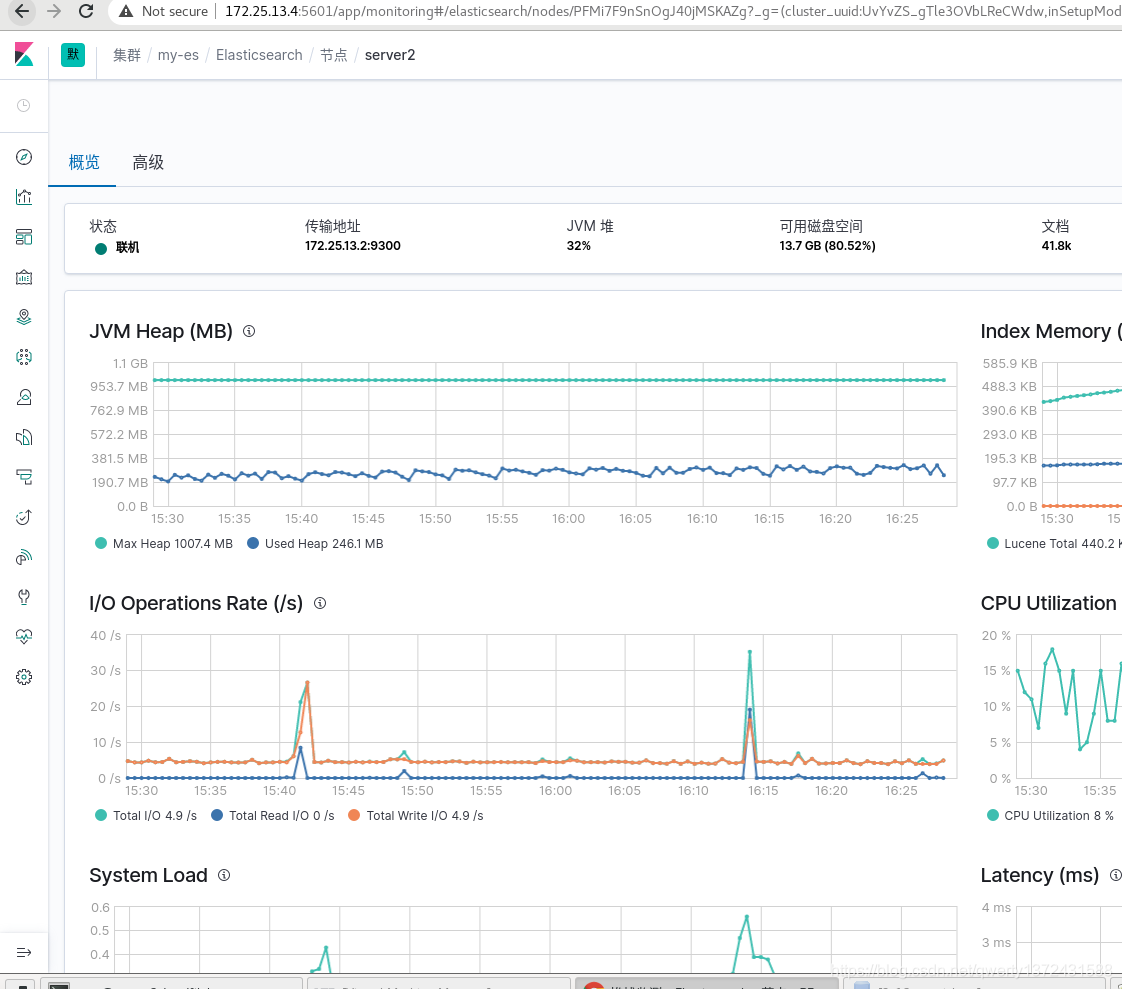
2. Use internal settings for health monitoring
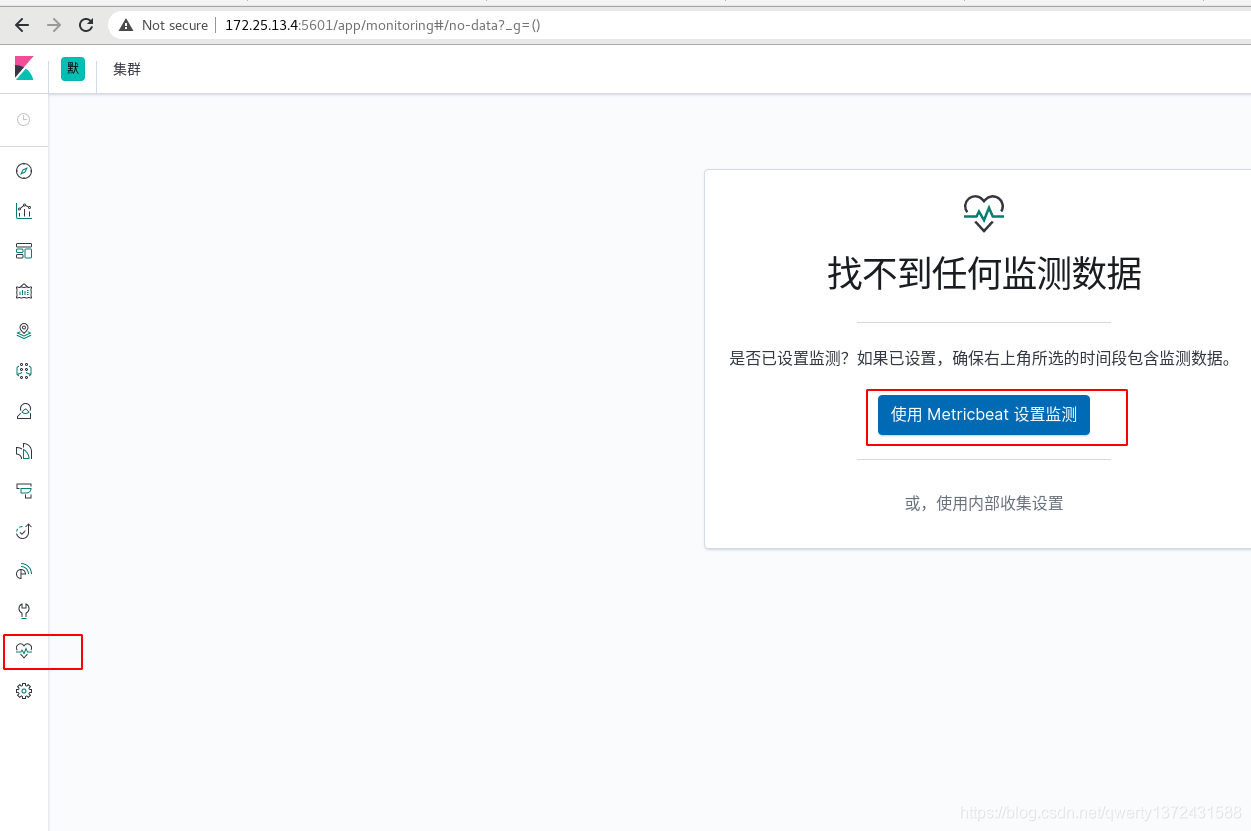
3. Configure metricbeat for health detection
3.1 Basic configuration metric monitoring
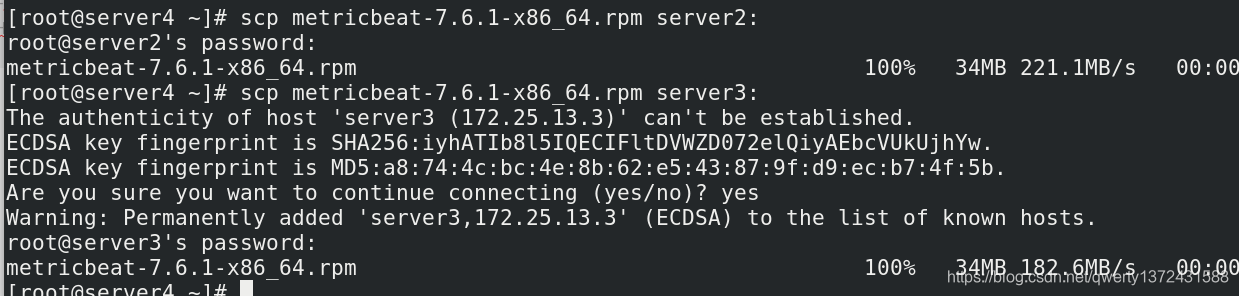
[root@server4 ~]# ll metricbeat-7.6.1-x86_64.rpm ##三台主机每一台都必须有metricbeat
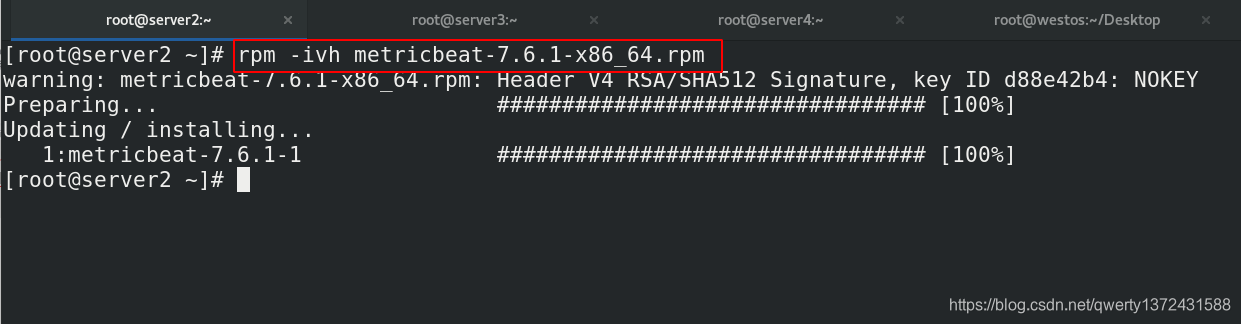
[root@server2 ~]# rpm -ivh metricbeat-7.6.1-x86_64.rpm #三台主机全部安装metricbeat
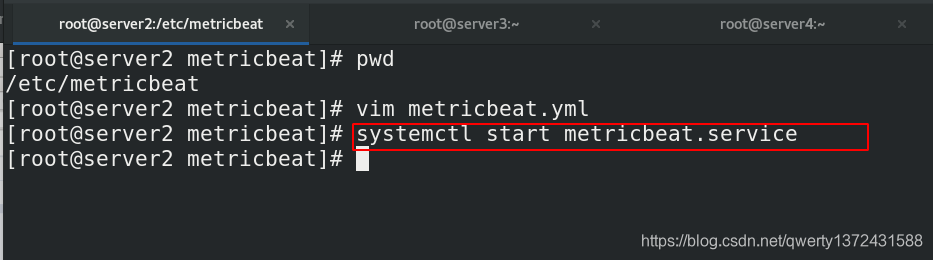
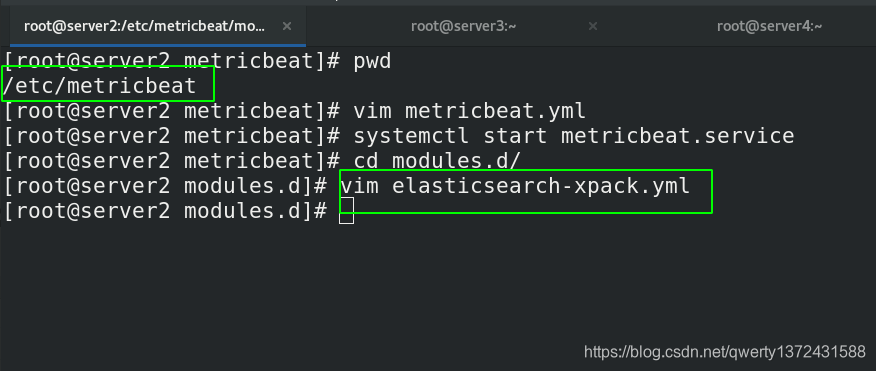
[root@server2 metricbeat]# vim /etc/metricbeat/metricbeat.yml
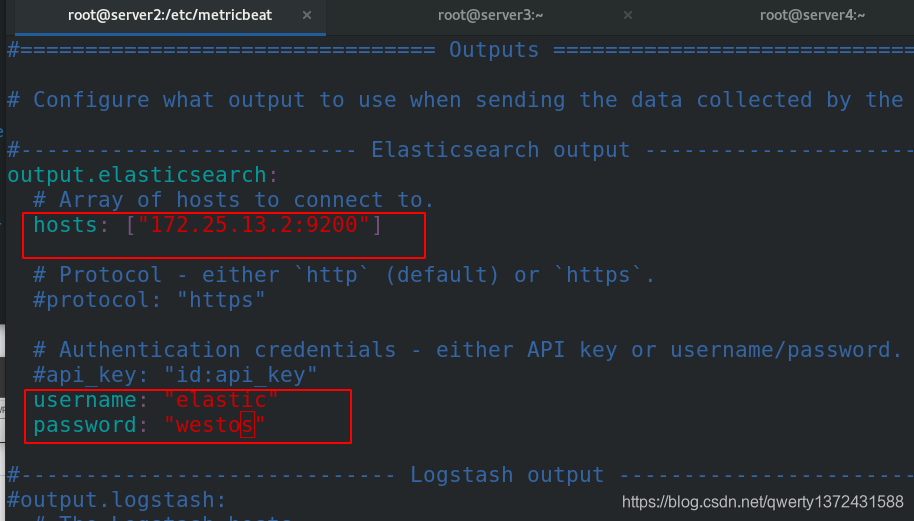
#-------------------------- Elasticsearch output ------------------------------
output.elasticsearch:
hosts: ["172.25.13.2:9200"]
username: "elastic"
password: "westos"
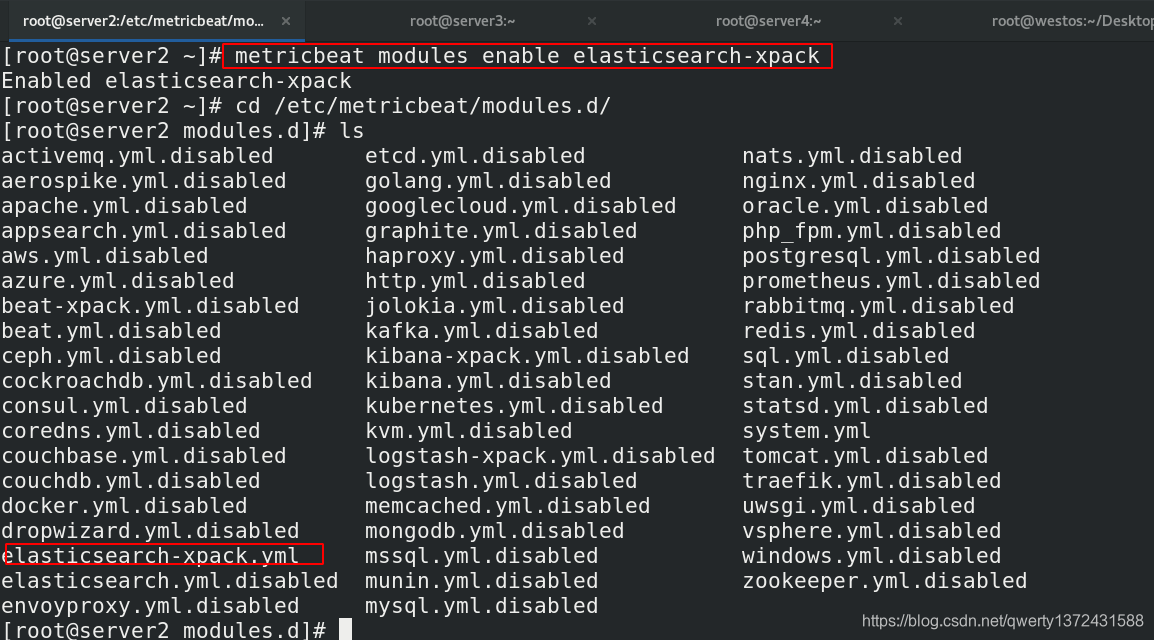
[root@server2 ~]# metricbeat modules enable elasticsearch-xpack ##启用模块
[root@server2 metricbeat]# systemctl start metricbeat.service
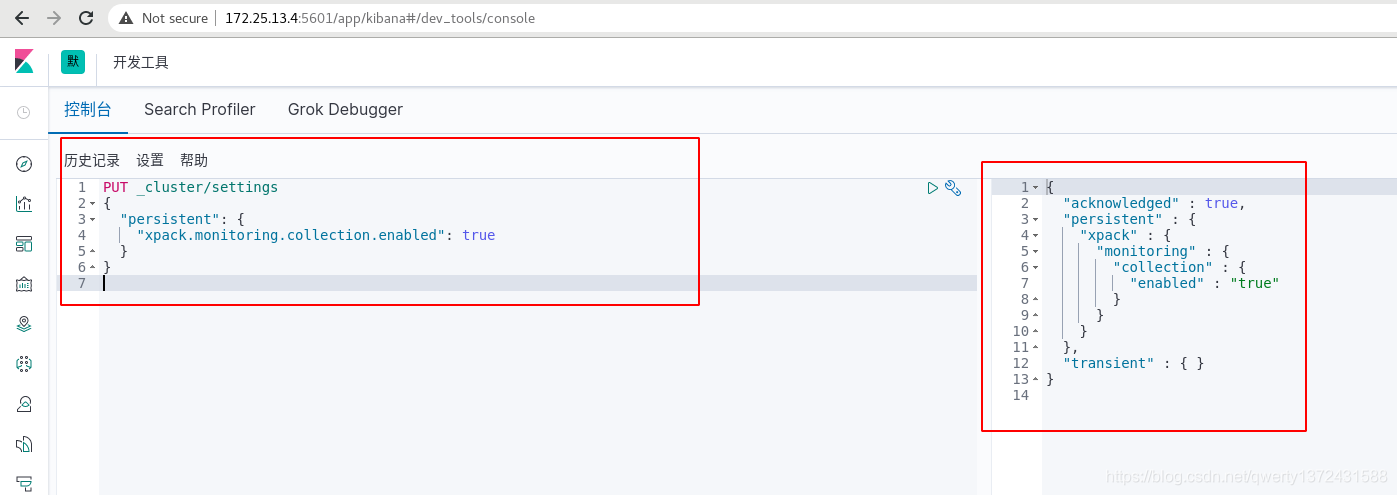
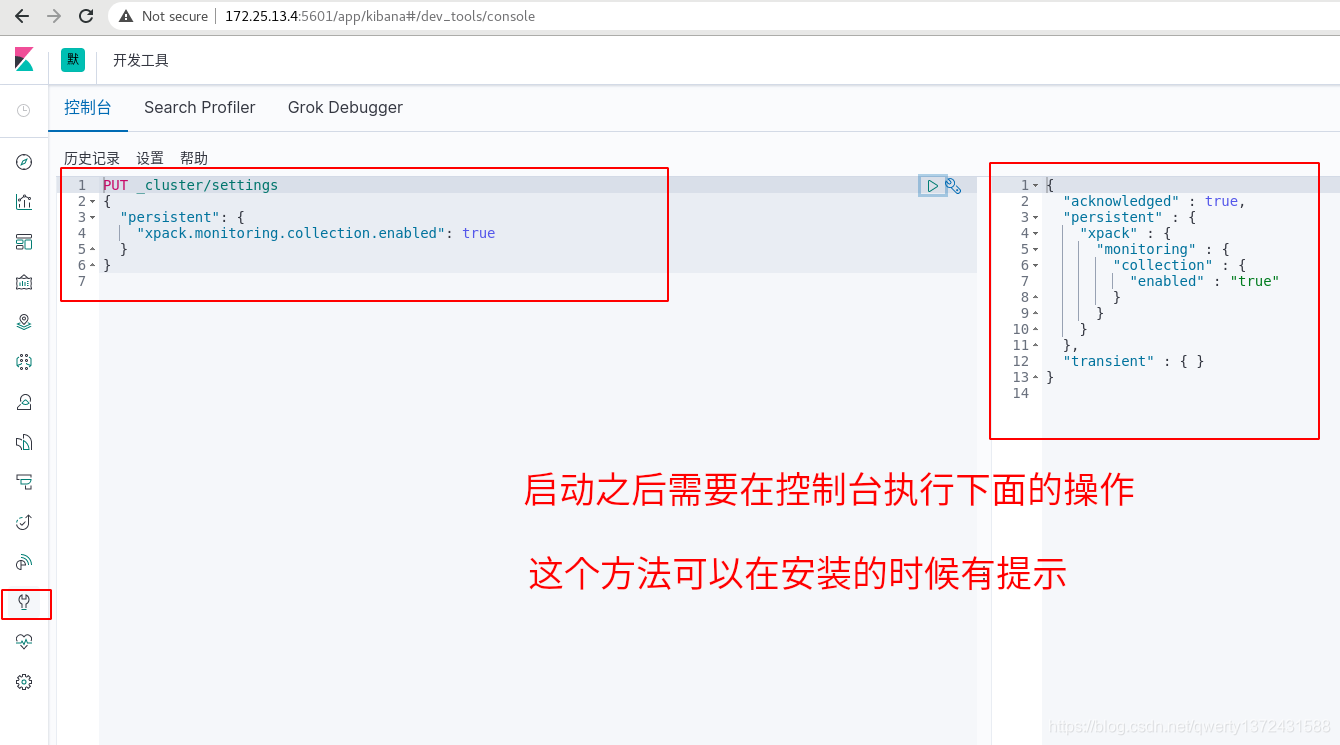
##开发工具设置下面内容
PUT _cluster/settings
{
"persistent": {
"xpack.monitoring.collection.enabled": true
}
}
[root@server2 modules.d]# vim elasticsearch-xpack.yml
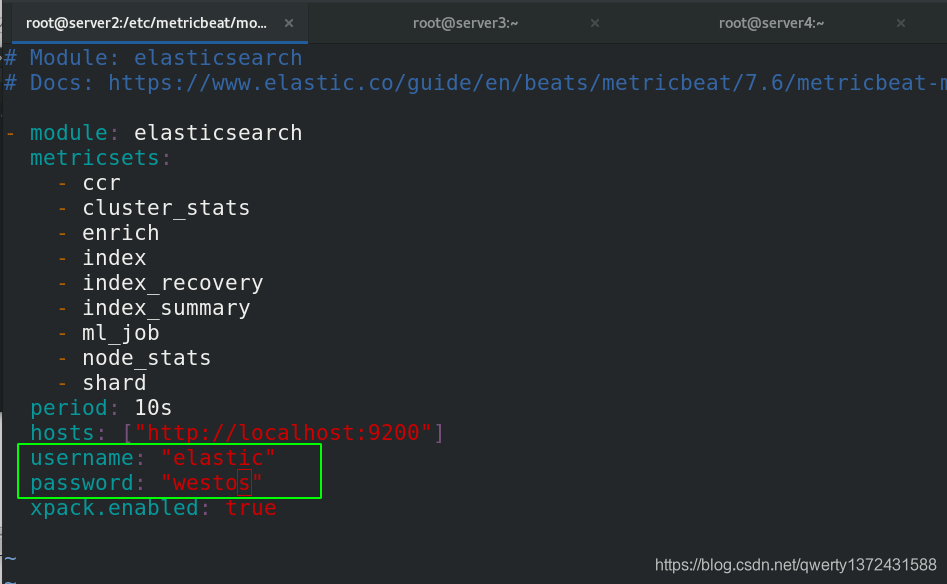
[root@server2 modules.d]# cat elasticsearch-xpack.yml
# Module: elasticsearch
# Docs: https://www.elastic.co/guide/en/beats/metricbeat/7.6/metricbeat-module-elasticsearch.html
- module: elasticsearch
metricsets:
- ccr
- cluster_stats
- enrich
- index
- index_recovery
- index_summary
- ml_job
- node_stats
- shard
period: 10s
hosts: ["http://localhost:9200"]
username: "elastic"
password: "westos"
xpack.enabled: true
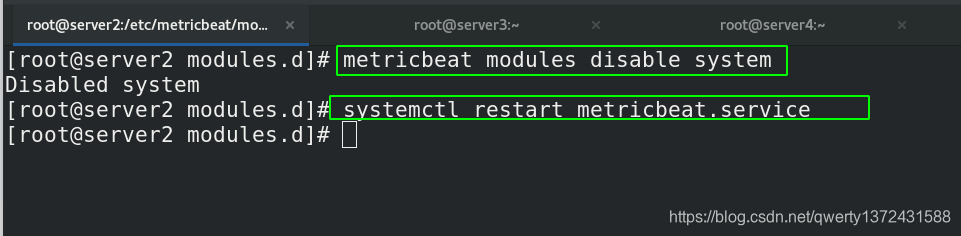
[root@server2 modules.d]# metricbeat modules disable system
Disabled system
[root@server2 modules.d]# systemctl restart metricbeat.service


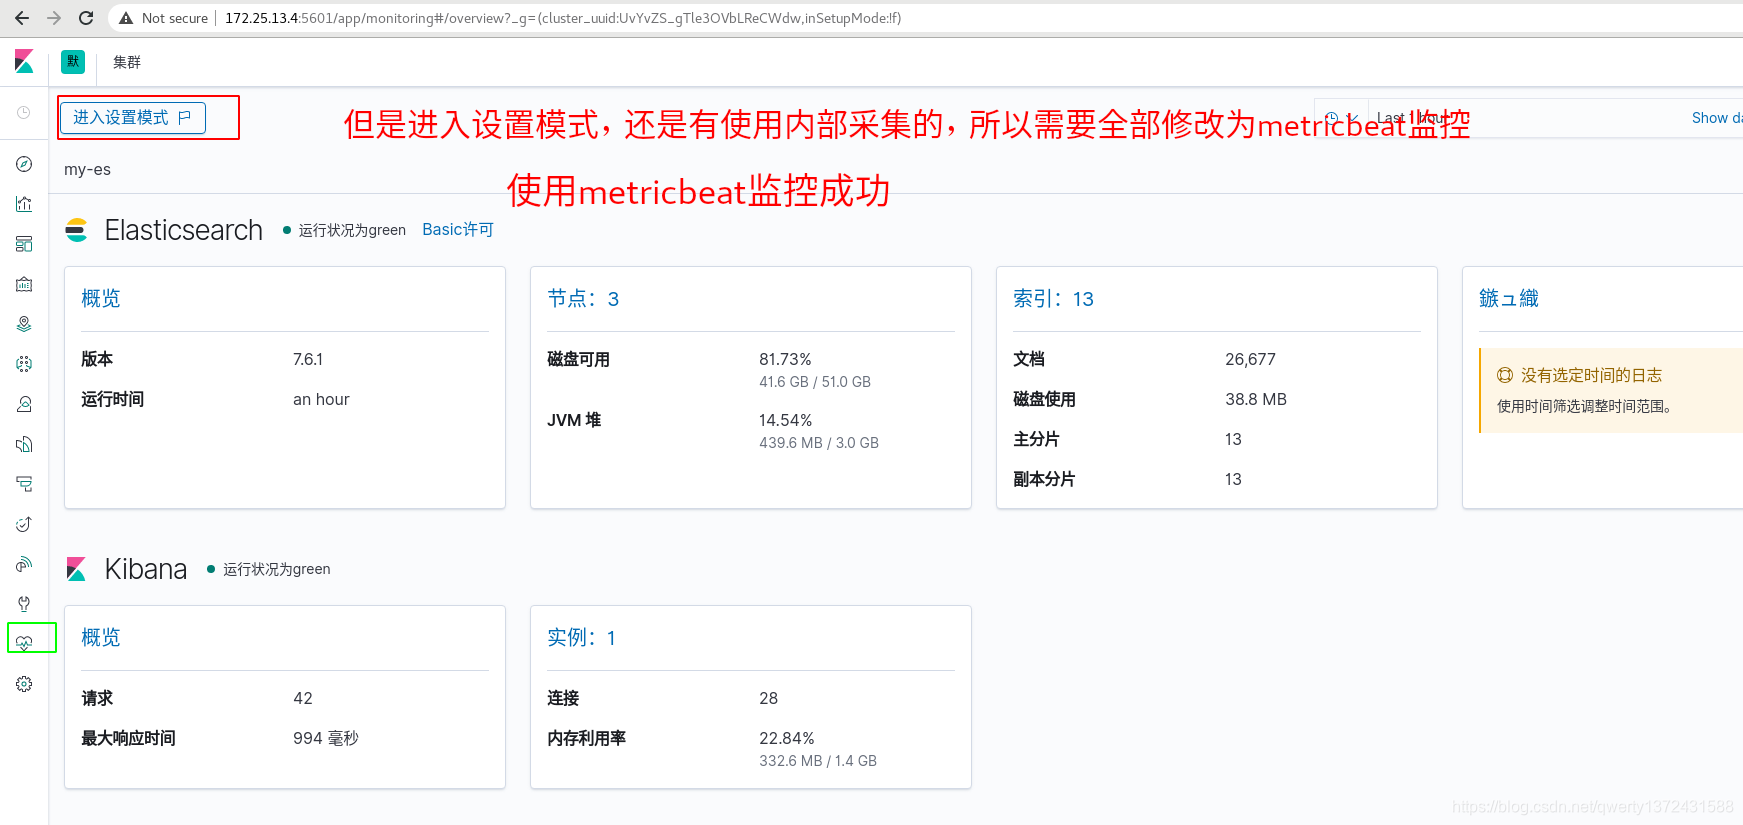

3.2 Final effect (disable internal collection)

4. Combine filebeat
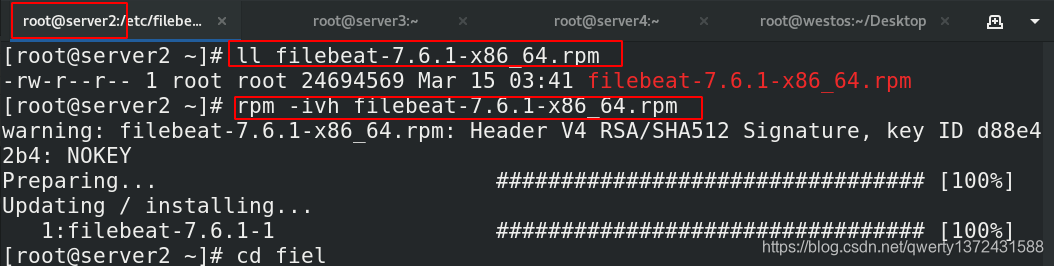
4.1 Install filebeat
4.2 Configuration information
[root@server2 ~]# filebeat modules list ##查看模块
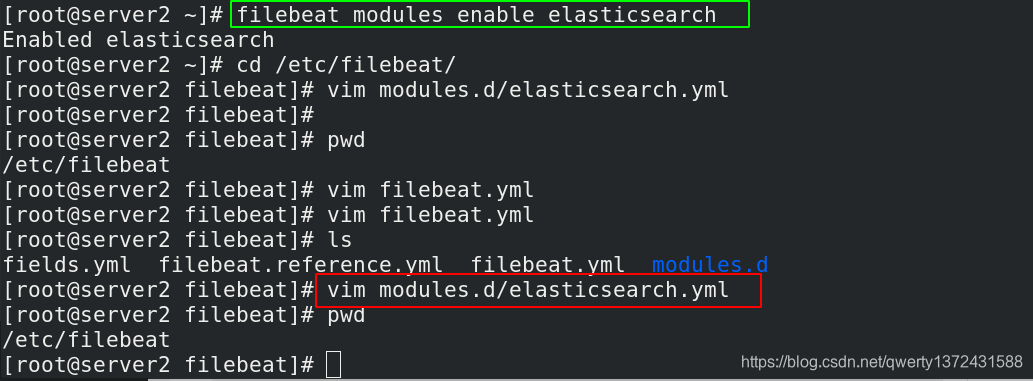
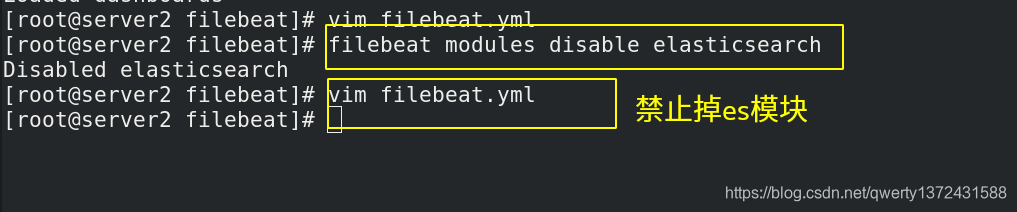
[root@server2 ~]# filebeat modules enable elasticsearch ##允许监控ES日志
[root@server2 filebeat]# pwd
/etc/filebeat
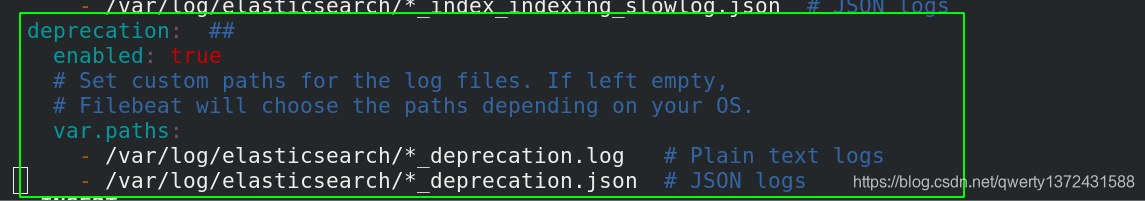
[root@server2 filebeat]# vim modules.d/elasticsearch.yml ##配置模块信息
[root@server2 filebeat]# vim filebeat.yml ##编辑主配置信息
Module configuration information copy and paste stamp here


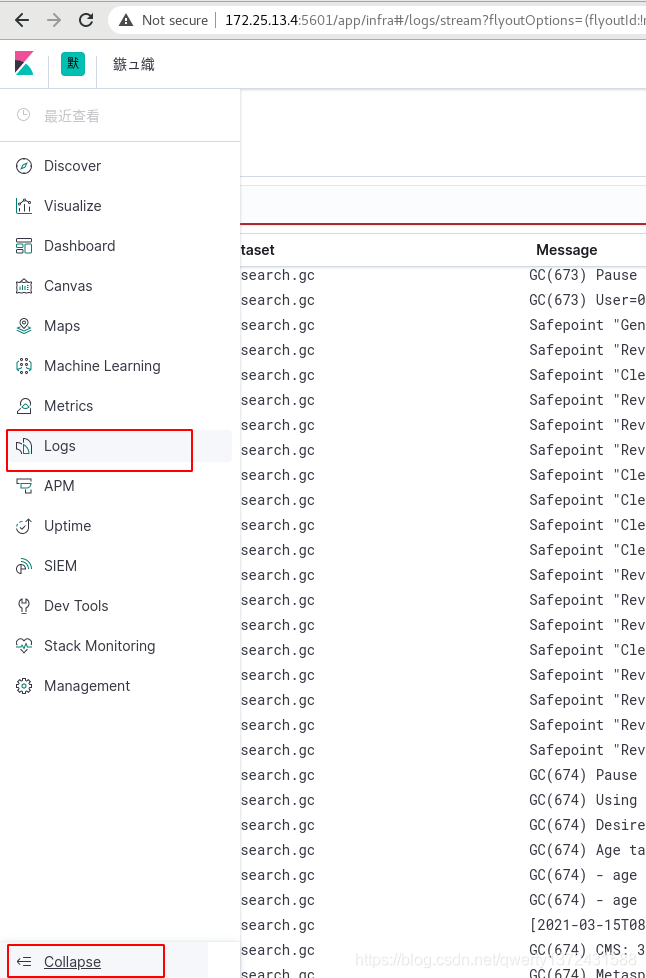
4.3 View the obtained log effect
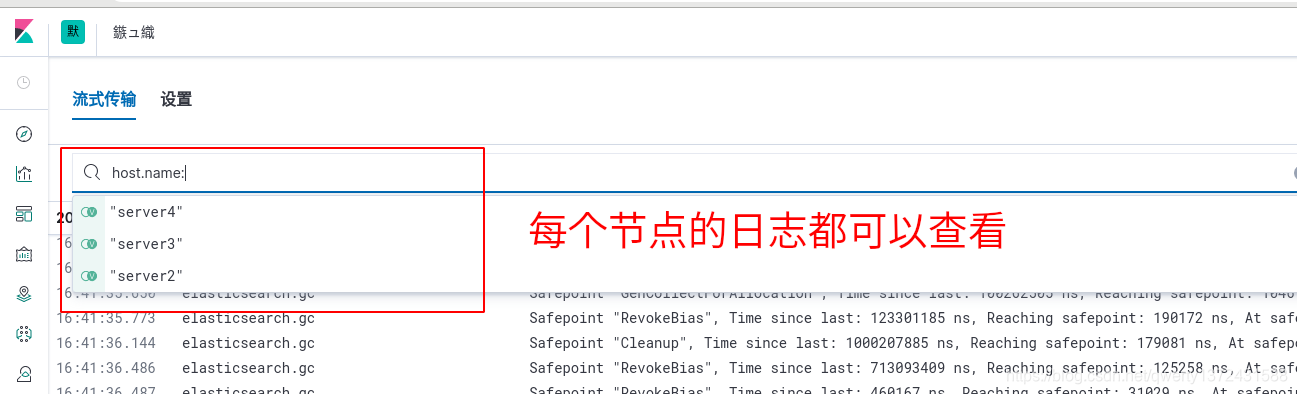
4.4 Other nodes also configure filebeat for log monitoring
[root@server2 ~]# scp filebeat-7.6.1-x86_64.rpm server3:
[root@server2 ~]# scp filebeat-7.6.1-x86_64.rpm server4:  ##操作和server2上的一模一样
[root@server2 ~]# filebeat modules enable elasticsearch  ##允许监控ES日志
[root@server2 filebeat]# pwd
/etc/filebeat
[root@server2 filebeat]# vim modules.d/elasticsearch.yml  ##配置模块信息

[root@server2 filebeat]# vim filebeat.yml   ##编辑主配置信息
4.5 View all node logs
4.6 metricbeat uses dashboards template
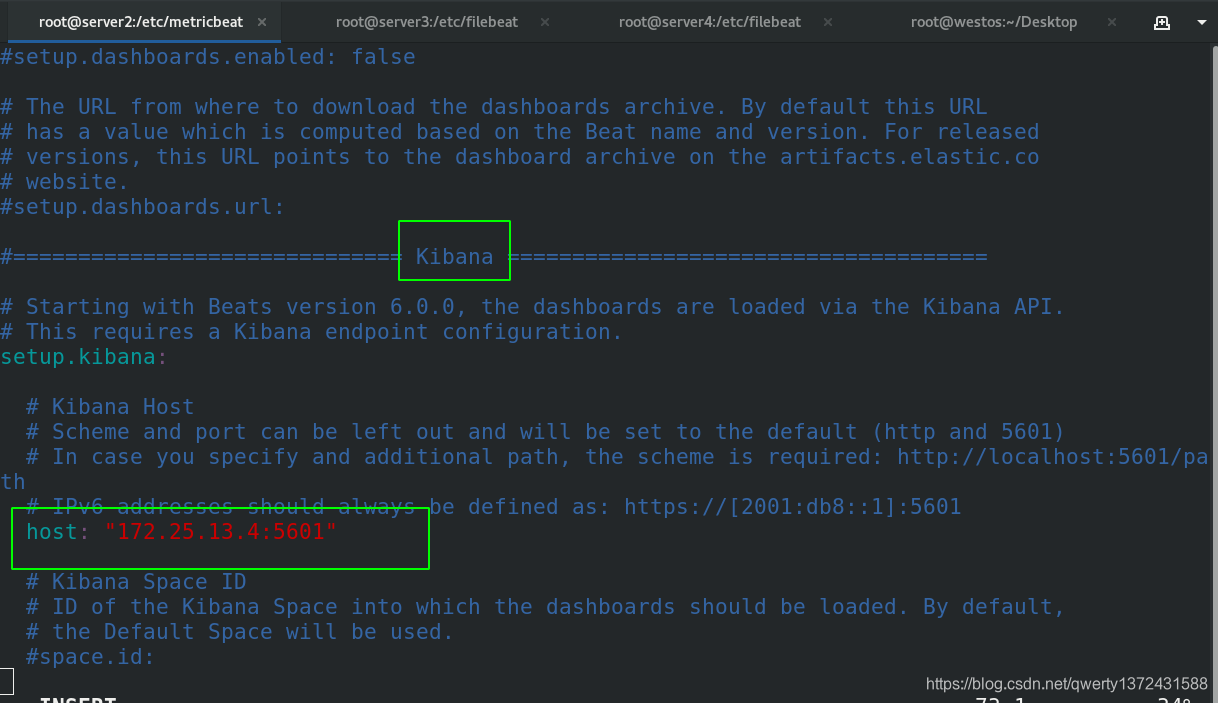
[root@server2 ~]# cd /etc/metricbeat/
[root@server2 metricbeat]# vim metricbeat.yml ##设置为kibana的ip
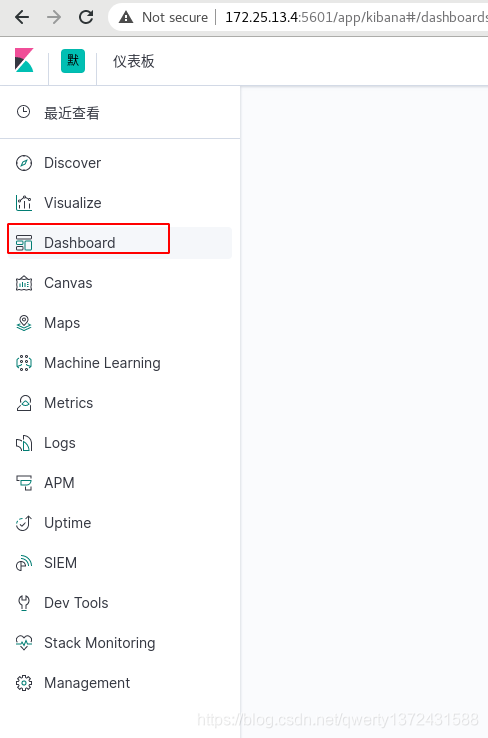
[root@server2 metricbeat]# metricbeat setup --dashboards ##前提得打开kibana连接,并且kibana是运行的

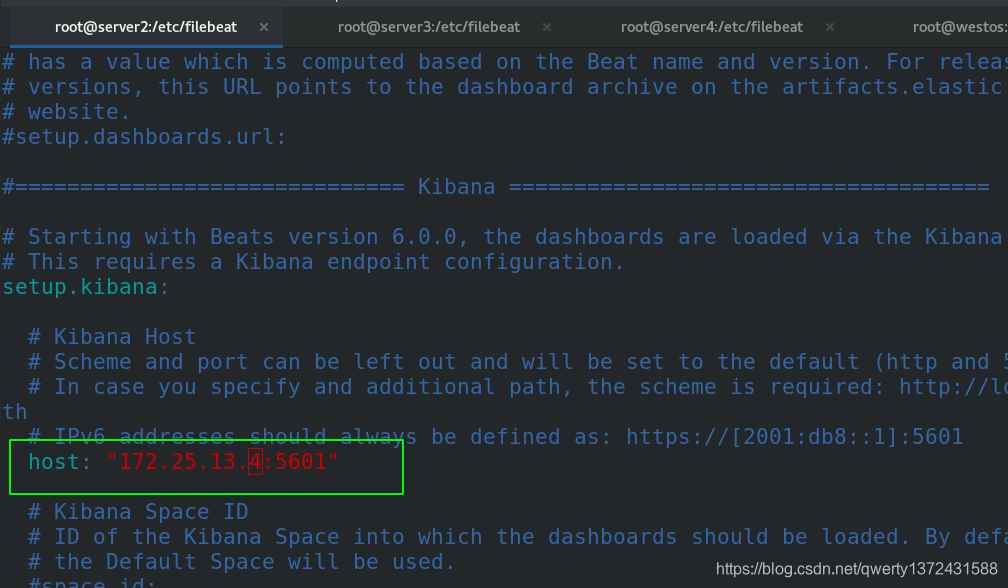
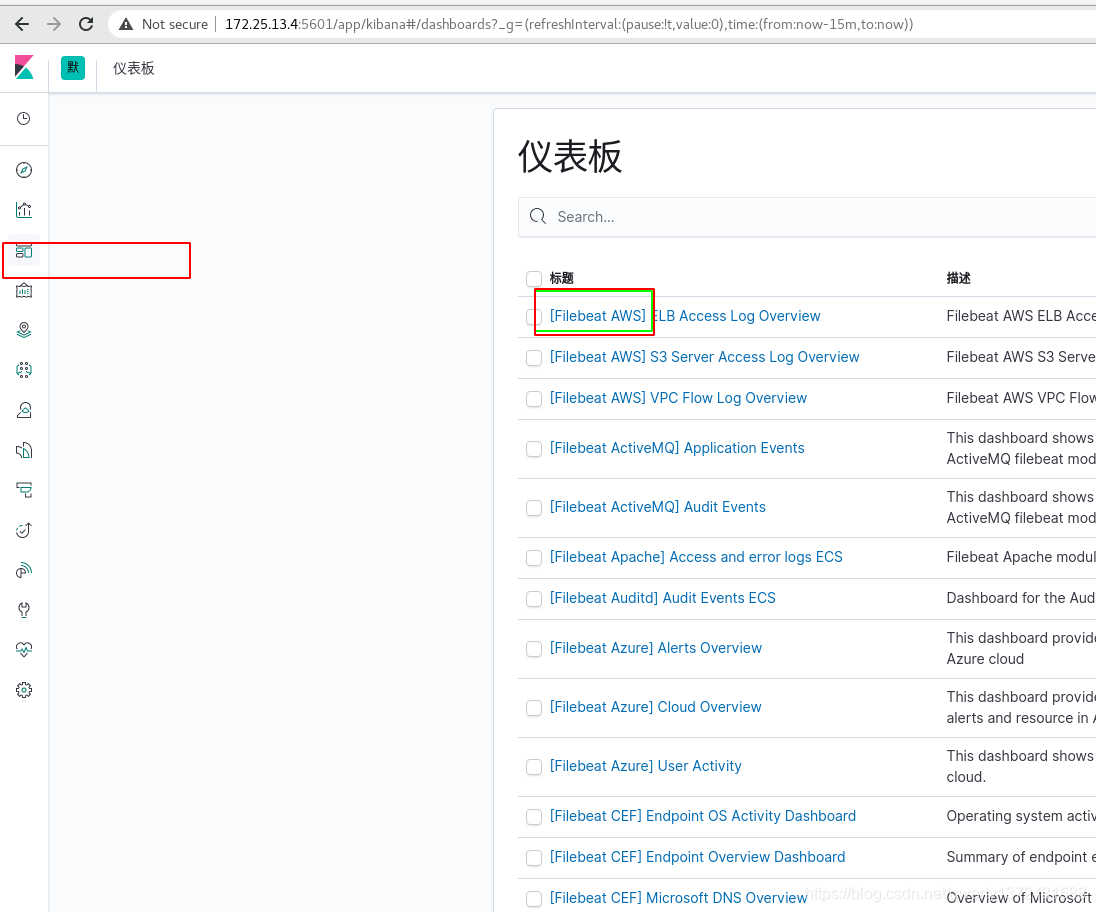
4.7 Filebeat uses the dashboard template


5. Filebeat combined with logstash
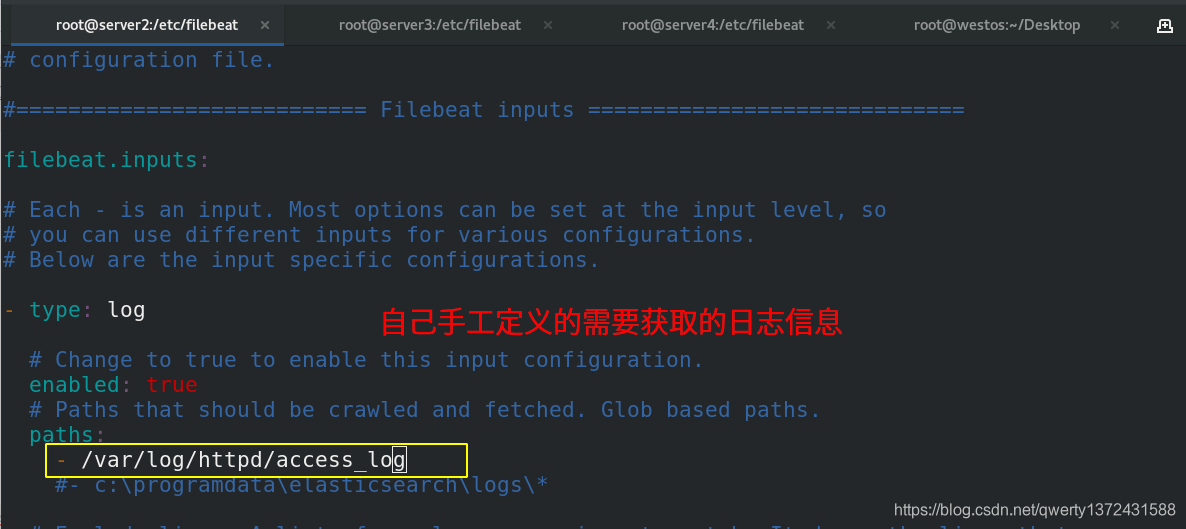
5.1 filebeat configuration file
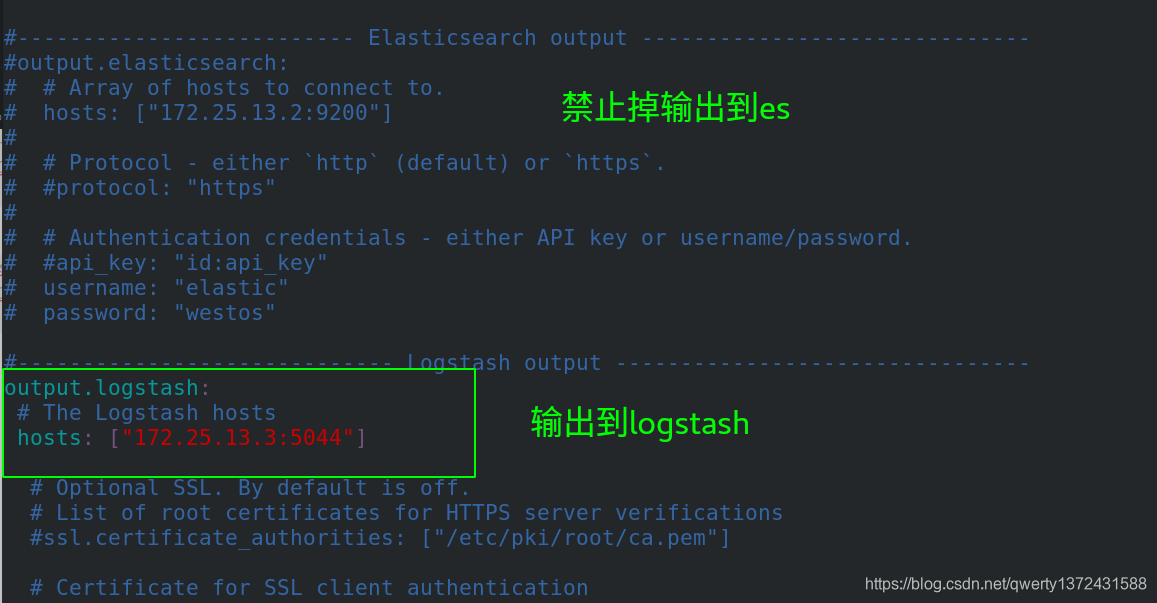

5.2 Configure logstash host
[root@server3 ~]# rpm -ivh jdk-8u171-linux-x64.rpm
[root@server3 ~]# rpm -ivh logstash-7.6.1.rpm
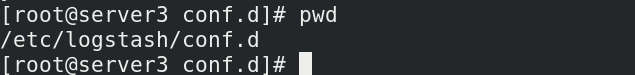
[root@server3 conf.d]# pwd
/etc/logstash/conf.d
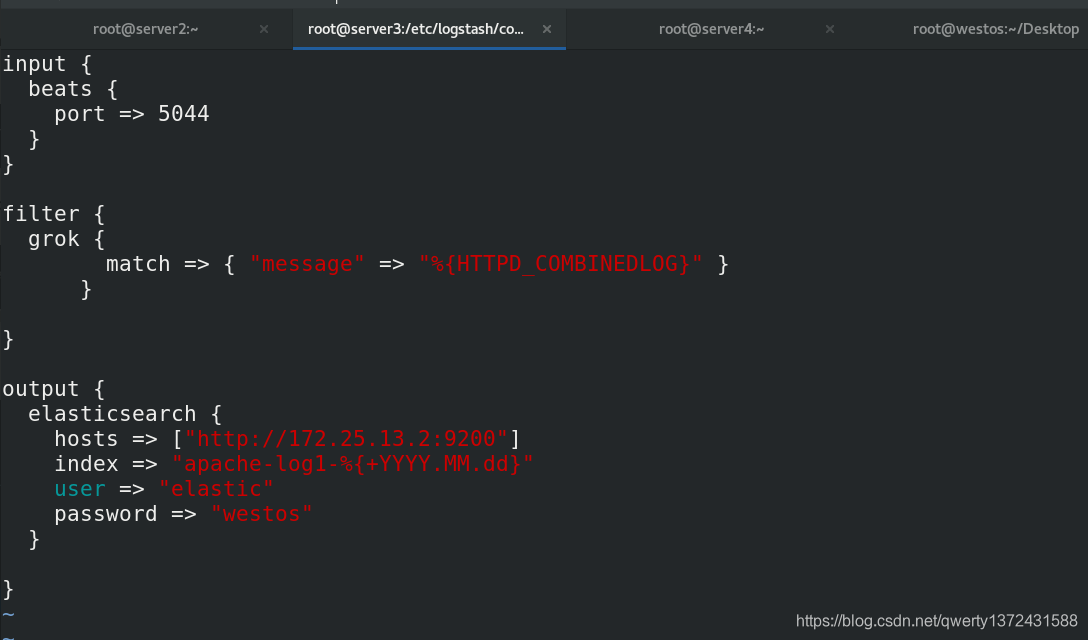
[root@server3 conf.d]# vim apache.conf
[root@server3 conf.d]# cat apache.conf
input {
beats {
port => 5044 ##监控5044端口
}
}
filter {
grok {
match => {
"message" => "%{HTTPD_COMBINEDLOG}" }
}
}
output {
elasticsearch {
hosts => ["http://172.25.13.2:9200"]
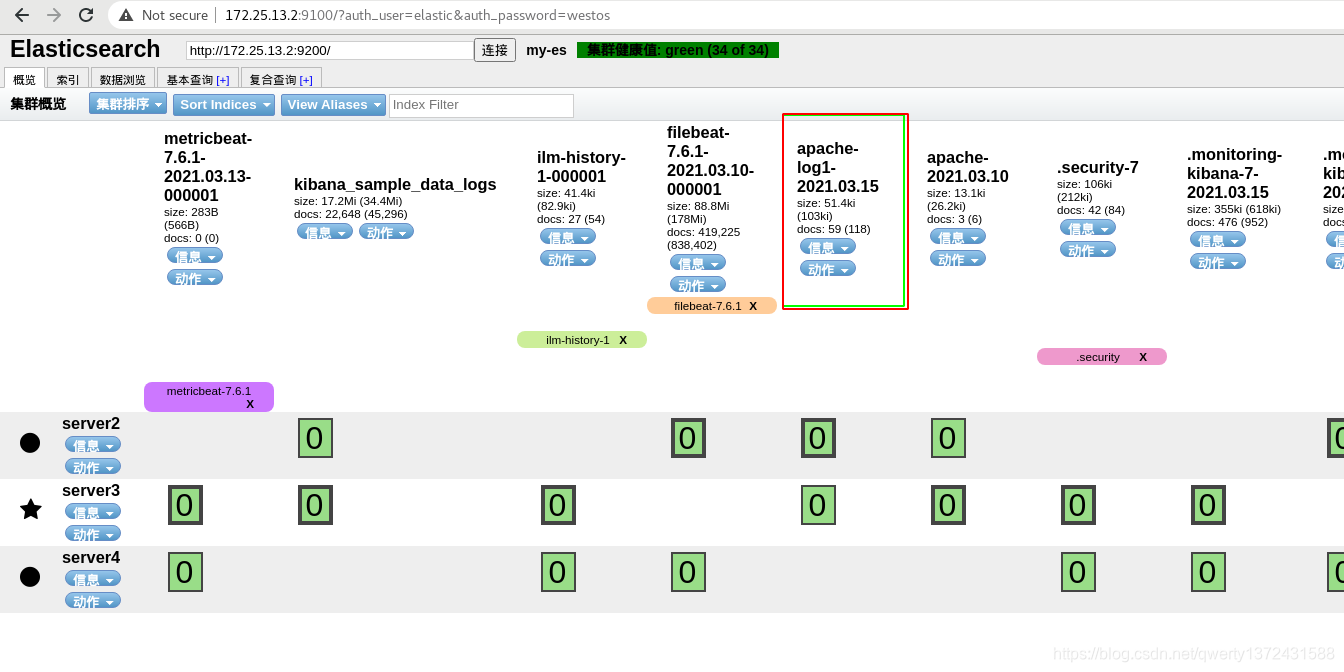
index => "apache-log1-%{+YYYY.MM.dd}"
user => "elastic"
password => "westos"
}
}
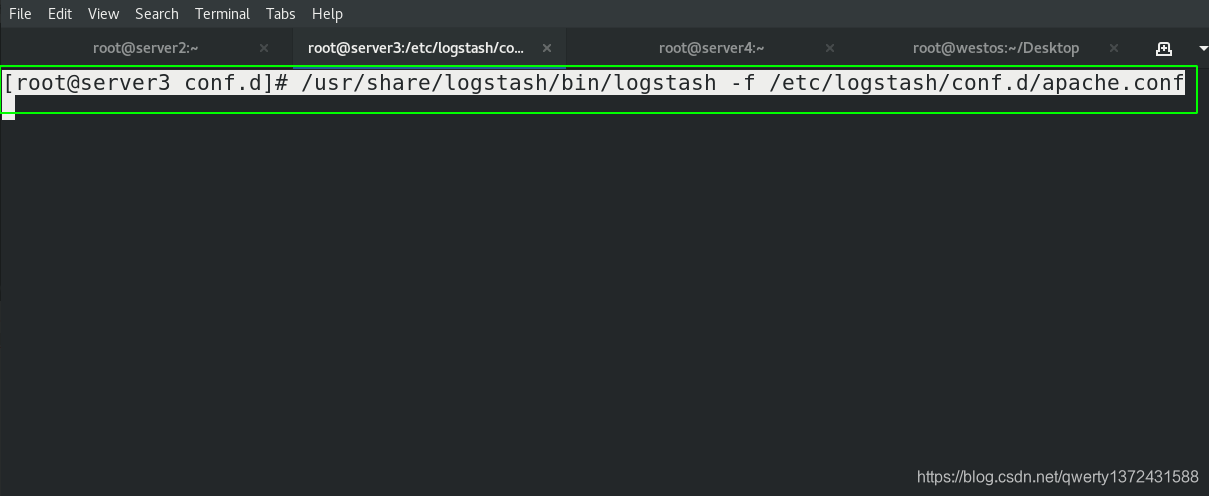
[root@server3 conf.d]# /usr/share/logstash/bin/logstash -f /etc/logstash/conf.d/apache.conf