HTML5 adds many new tag elements such as: <section>, <article>, <header>, <footer>, and also provides a number of interactive media elements, such as class <canvas>, <audio>, <vedio> and so on. Form elements have been strengthened, new color picker, data selectors, sliders and progress bars, in addition to many new elements but also with their own JavaScript and DOM API. With this article we will focus on canvas canvas.

Canvas Canvas
Each browser can display still pictures can be achieved by a number of animated GIF, or use CSS plus JavaScript can transform some style, but if you want to interact with a static image, it is more difficult. The emergence of the Canvas element to solve this problem, canvas canvas can dynamically create and manipulate graphic images.
Introduction canvas
- The canvas element for rendering graphics on the page.
- HTML5 canvas element uses JavaScript to draw graphics on the page.
- The canvas is a rectangular area, each pixel can be controlled.
- drawing canvas has a plurality of paths, rectangles, circles, characters, images and more.
Custom canvas
<Canvas> element may be like any ordinary picture have the same margin, border, background and the like properties. However, these styles will not affect the actual image in the canvas of. When the start is not specified style canvas, canvas area will be completely transparent. Creation Method:
<canvas id="draw-in-me" width="40" height="30">替代内容</canvas>
Some older browsers (especially before the IE9 IE browser) or text browser does not support HTML elements "canvas", on which browser you should always be able to display alternate content. After adding a background color this region becomes a visual:
By rendering JavaScript
canvas 元素本身是没有绘图能力的,所有的绘制工作必须在 JavaScript 内部完成,canvas真正有效的不是表层的< canvas >标签,而是强大的Canvas API 提供了一个通过JavaScript 和 HTML的< canvas >元素来绘制图形的方式。它可以用于动画、游戏画面、数据可视化、图片编辑以及实时视频处理等方面。
在正式开始之前,我们先来看这样一段代码:
定义draw函数
 function draw(){
   var canvas = document.getElementById('tutorial');//获得渲染上下文和绘画功能
   if (canvas.getContext){//检查支持性
     var ctx = canvas.getContext('2d');
   }
 }
canvas起初是空白的。为了展示,首先脚本需要找到渲染上下文,然后在它的上面绘制。
- getContext() 方法,这个方法是用来获得渲染上下文和它的绘画功能。getContext()只有一个参数,上下文的格式。
- 由于一些浏览器不支持canvas元素,我们对此进行检查,而getContext方法的存在就能体现支持性
今后我们在画布上的描绘,都通过这个draw函数实现。
以下添加必要的CSS渲染后的效果:
图形绘制API
(1)矩形绘制API
canvas提供了三种方法绘制矩形:
- fillRect(x,y,width,height) 绘制一个填充矩形
- strokeRect(x,y,width,height) 绘制一个矩形边框
- clearRect(x,y,width,height) 清除指定矩形区域,让清除部分完全透明
上面提供的方法之中每一个都包含了相同的参数。x与y指定了在canvas画布上所绘制的矩形的左上角(相对于原点)的坐标。width和height设置矩形的尺寸。
使用矩形绘制API
接下来我们将使用这三个API,并且增加一些小技巧,用鼠标的onmouseover属性来返回坐标:
Javascript:
window.onload=draw;
function draw()
{
var canvas=document.getElementById("canvas");
if(canvas.getContext)
{
var ctx=canvas.getContext('2d');//获取上下文和绘画功能
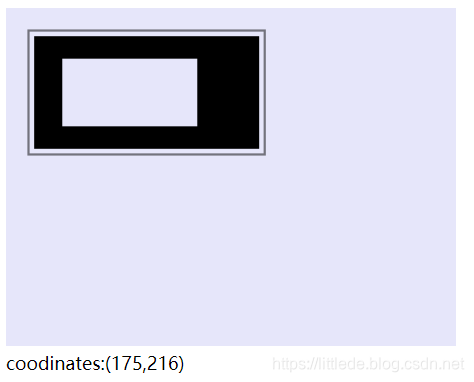
ctx.fillRect(25,25,200,100);//绘制矩形
ctx.strokeRect(20,20,210,110);//绘制矩形边框
ctx.clearRect(50,45,120,60);//设置清除
}
}
function cnvs_getCoordinates(e)//显示坐标
{
x=e.clientX;
y=e.clientY;//获取坐标
document.getElementById("xycoordinates").innerHTML="coodinates:("+x+","+y+")";
}
function cnvs_clearCoordinates()//清除坐标
{
document.getElementById("xycoordinates").innerHTML="";
}
HTML:
<!DOCTYPE html>
<html>
<head>
	<meta charset="utf-8">
	<title>canvas Test</title>
	<link rel="stylesheet" type="text/css" href="canvas.css">
	<script src="canvas.js"></script>
</head>
<body>
	<canvas id="canvas" width="400" height="300" style="background-color:#E6E6FA" onmousemove="cnvs_getCoordinates(event)" onmouseout="cnvs_clearCoordinates()"></canvas>
	<div id="xycoordinates"></div>
</body>
</html>
(2)绘制路径
绘制步骤
图形的基本元素是路径。路径是通过不同颜色和宽度的线段或曲线相连形成的不同形状的点的集合。一个路径,甚至一个子路径,都是闭合的。使用路径绘制图形需要一些额外的步骤。
- beginPath 新建一条路径
- 创建路径起始点。moveTo
- 使用画图命令去画出路径。
- 把路径封闭。
- 通过描边或填充路径区域来渲染图形
- closePath() 闭合路径之后图形绘制命令又重新指向到上下文中。
注意:当前路径为空,即调用beginPath()之后,或者canvas刚建的时候,第一条路径构造命令通常被视为是moveTo(),无论实际上是什么。出于这个原因,你几乎总是要在设置路径之后专门指定你的起始位置。
绘制路径 API
- beginPath() 新建一条路径,生成之后,图形绘制命令被指向到路径上生成路径。
- closePath() 闭合路径 之后图形绘制命令又重新指向到上下文中,不是必需的。这个方法会通过绘制一条从当前点到开始点的直线来闭合图形。如果图形是已经闭合了的,即当前点为开始点,该函数什么也不做。
- stroke() 线条绘制 图形轮廓。使用描边(stroke)则不会闭合路径。
- fill() 填充路径的内容区域生成实心的图形。径使用填充fill时,路径自动闭合
- moveTo(x, y) 移动笔触,将笔触移动到指定的坐标x以及y上。一般在beginPath后建立新的起点
- lineTo(x, y) 线,绘制一条从当前位置到指定x以及y位置的直线。
- arc(x, y, radius, startAngle, endAngle, anticlockwise) 圆, 画一个以(x,y)为圆心的以radius为半径的圆弧(圆),从startAngle开始到endAngle结束,按照anticlockwise给定的方向(默认为顺时针)来生成,弧度Math.PI/180*角度。
- rect(x, y, width, height) 矩形,绘制一个左上角坐标为(x,y),宽高为width以及height的矩形。当该方法执行的时候,moveTo()方法自动设置坐标参数(0,0)。也就是说,当前笔触自动重置回默认坐标。
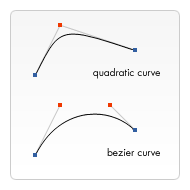
- quadraticCurveTo(cp1x, cp1y, x, y) 二次贝塞尔曲线,绘制二次贝塞尔曲线,cp1x,cp1y为一个控制点,x,y为结束点。
- bezierCurveTo(cp1x, cp1y, cp2x, cp2y, x, y) 三次贝塞尔曲线,绘制三次贝塞尔曲线,cp1x,cp1y为控制点一,cp2x,cp2y为控制点二,x,y为结束点。
- 二次贝塞尔曲线和三次贝塞尔曲线的区别:
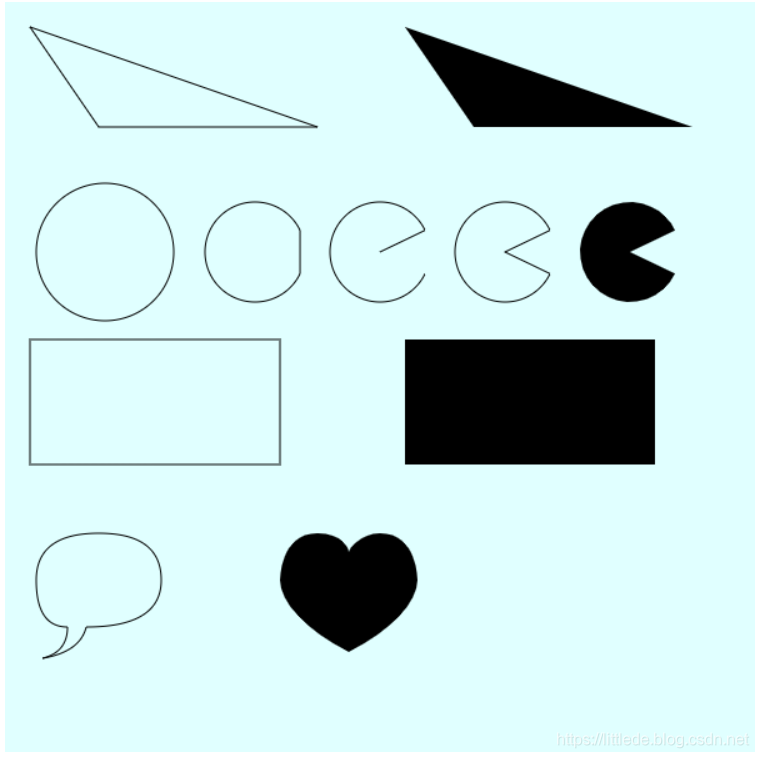
使用绘制路径API
下面我们将会把以上介绍的API全部绘制一遍:
window.onload=function()
{
	draw_triangle_strock();
	draw_triangle_fill();
	draw_arc();
	draw_rect();
	draw_bezier();
}
function draw_triangle_strock()//空心三角形
{
	var canvas=document.getElementById("canvas");
	if(canvas.getContext)
	{
		var ctx=canvas.getContext('2d');

		ctx.beginPath();
		ctx.moveTo(20,20);
		ctx.lineTo(250,100);
		ctx.lineTo(75,100);
		ctx.lineTo(20,20);//线
		ctx.stroke();//填充
		ctx.closePath();
	}
}
function draw_triangle_fill()//实行三角形
{
	var canvas=document.getElementById("canvas");
	if(canvas.getContext)
	{
		var ctx=canvas.getContext('2d');

		ctx.beginPath();
		ctx.moveTo(320,20);
		ctx.lineTo(550,100);
		ctx.lineTo(375,100);
		ctx.lineTo(320,20);//线
		ctx.fill();//填充
		ctx.closePath();
	}
}
function draw_arc()//圆1
{
	var canvas=document.getElementById("canvas");
	if(canvas.getContext)
	{
		var ctx=canvas.getContext('2d');

		ctx.beginPath();
		ctx.arc(80,200,55,0,Math.PI*2,true);//顺时针
		ctx.stroke();//空心圆
		ctx.closePath();

		ctx.beginPath();
		ctx.arc(300,200,40,Math.PI/7,-Math.PI/7,false);//顺时针
		ctx.lineTo(300,200);
		ctx.stroke();//空心圆
		ctx.closePath();

		ctx.beginPath();
		ctx.arc(200,200,40,Math.PI/7,-Math.PI/7,false);//顺时针
		ctx.closePath();
		ctx.stroke();//空心圆

		ctx.beginPath();
		ctx.arc(400,200,40,Math.PI/7,-Math.PI/7,false);//顺时针
		ctx.lineTo(400,200);
		ctx.closePath();
		ctx.stroke();//空心圆

		ctx.beginPath();
		ctx.arc(500,200,40,Math.PI/7,-Math.PI/7,false);//顺时针
		ctx.lineTo(500,200);
		ctx.fill();//空心圆
		ctx.closePath();
	}
}
function draw_rect()
{
	var canvas=document.getElementById("canvas");
	if(canvas.getContext('2d'))
	{
		var ctx=canvas.getContext('2d');

		ctx.beginPath();
		ctx.rect(20,270,200,100);
		ctx.stroke();
		ctx.closePath();

		ctx.beginPath();
		ctx.rect(320,270,200,100);
		ctx.fill();
		ctx.closePath();
	}
}
function draw_bezier()
{
	var canvas=document.getElementById("canvas");
	if(canvas.getContext('2d'))
	{
		var ctx=canvas.getContext('2d');
		 ctx.beginPath();
		 ctx.moveTo(75,425);
		 ctx.quadraticCurveTo(25,425,25,462.5);
		 ctx.quadraticCurveTo(25,500,50,500);
		 ctx.quadraticCurveTo(50,520,30,525);
		 ctx.quadraticCurveTo(60,520,65,500);
		 ctx.quadraticCurveTo(125,500,125,462.5);
		 ctx.quadraticCurveTo(125,425,75,425);
		 ctx.stroke();

		 ctx.beginPath();
		 ctx.moveTo(275,440);
		 ctx.bezierCurveTo(275,437,270,425,250,425);
		 ctx.bezierCurveTo(220,425,220,462.5,220,462.5);
		 ctx.bezierCurveTo(220,480,240,502,275,520);
		 ctx.bezierCurveTo(310,502,330,480,330,462.5);
		 ctx.bezierCurveTo(330,462.5,330,425,300,425);
		 ctx.bezierCurveTo(285,425,275,437,275,440);
		 ctx.fill();
	}
}
Path2D 对象
正如我们在前面例子中看到的,你可以使用一系列的路径和绘画命令来把对象“画”在画布上。为了简化代码和提高性能,Path2D对象已可以在较新版本的浏览器中使用,用来缓存或记录绘画命令,这样你将能快速地回顾路径。
产生Path2D对象
var path=new Path2D();//空Path对象
var path=new Path2D(path1);//克隆Path1对象
var path=new Path2D(d);//从SVG建立Path对象
Path2D.addPath(path[,transform]);//添加一条路径到当前路径
示例:
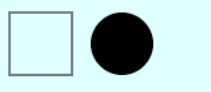
function draw() {
  var canvas = document.getElementById('canvas');
  if (canvas.getContext){
    var ctx = canvas.getContext('2d');

    var rectangle = new Path2D();
    rectangle.rect(10, 10, 50, 50);

    var circle = new Path2D();
    circle.moveTo(125, 35);
    circle.arc(100, 35, 25, 0, 2 * Math.PI);

    ctx.stroke(rectangle);
    ctx.fill(circle);
  }
}