Use PerfMon for server resource monitoring program is implemented in two parts
ServerAgent, deployed in the test server, responsible for resource consumption data collection, and its function is mainly based on hyperic realization of SIGAR.
PerfMon Listener, to be integrated into the plug-in JMeter, wherein as a Listener.
1.1 ServerAgent deployment
Premise: ServerAgent need to run version supports jre1.4 above.
Download: Download from the official
Deployment: the downloaded .zip placed into the test server, unpacked, startAgent.sh (direct running
Linux
) /startAgent.bat (
Windows
using a simple text protocol) can, with JMeter for data transmission, using the default TCP protocol The default port 4444. Of course, in Linux, we usually put it in the background, such as using nohup.
Validation: In order to ensure smooth testing process, we can confirm in advance whether the communication ServerAgent deployed on presses with JMeter test server properly. A convenient method is to use telnet transmission "test" as in JMeter ServerAgent press, such as telnet 192.168.18.10 4444, after the communication, Test input, the output will normally ServerAgent similar INFO 2017-07-29 23: 10: 52.430 [ kg.apc.p] (): Yep, we received the 'test' command of the log.
You can add --tcp-port xxx when you run the script to specify the port, such as $ ./startAgent.sh --tcp-port 3450, should be noted that at this time also need to be modified to bind the corresponding port when JMeterPerfMon plugin. More information can refer to the official documentation download page.
1.2 PerfMon plug-in uses
Installation: After JMeter3.0, there are two ways to install the plug jmeter-plugins included.
The first embodiment: the official website jmeter-plugins to search for and download PerfMon, the resulting package is placed under the jar JMeter installation directory lib / ext / path JMeter restart, selected from the plug used in the Listener.
The second way: Use Plugins Manager, but for reasons of domestic well-known, many students may not show problems encountered No Network widget here will not start, refer to my previous article: JMeter Performance Test 3.0 era - new JMeter plugin Manager
Use: As shown, the plug-in select PerfMon Listener added to the test plan 2, and with reference to Figure 3 configuration, including the configuration of the deployment of the IP ServerAgent test server, the port ServerAgent used to obtain and display resources and other items. After the test start

FIG 2 using PerfMon widget
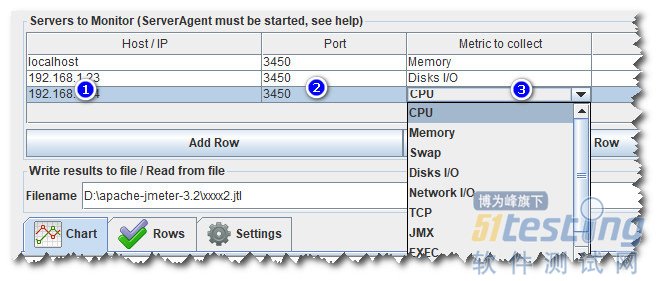
Observation and Data storage: When debugging mode using the GUI, after the test starts, can be directly observed in the corresponding window according to a graphical depiction of data collection. And to the formal implementation of the test using NO GUI mode, view the surveillance data, when designing test plans Filename location of the configuration data in Figure 3 address to be saved, it and save JMeter test master data the same way as, to note that Do not save the same file to JMeter test and master data. After completion of test execution, and then load the file in the plug-in interface to display graphic display monitoring data.
II. Advanced
From a colleague, technical group of friends there, I learned that there are a lot of meaning for students of various indicators show PerfMon plug-in data, particularly the unit is not particularly clear, so speak about this part. In addition to the graph display data, there are some points worth noting.
2.1 indicators
Doubts about the monitoring indicator data, most of the answers can be found from the Metric parameter setting interface plug-in PerfMon. We know that for servers such as CPU, memory and other indicators to monitor each type, there are a variety of data from different dimensions to reflect resource usage, such as for the CPU, with the top command, you can look at idle, user, system and other data on Linux systems .
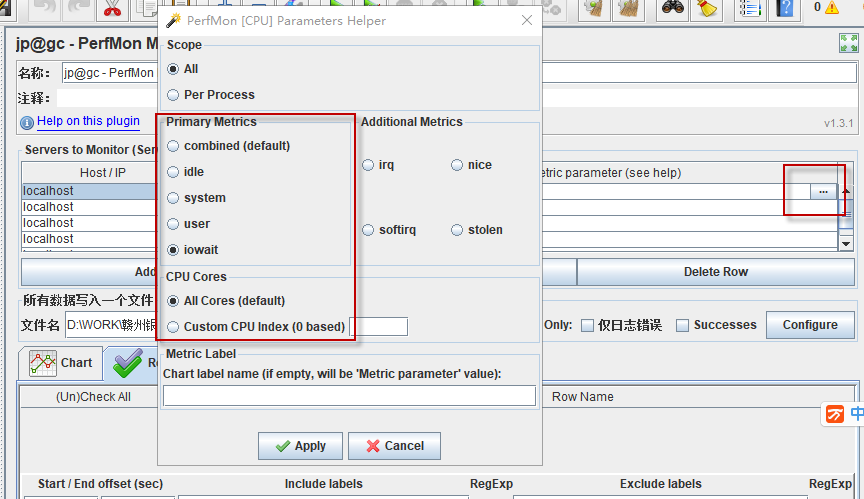
For PerfMon plug may be set for a specific data collection and display of certain resources Metric parameter, but it is not very conspicuous in the inlet, as shown upper right red arrow 4, the double-click input box, clicking on the last side open button to open the interface shown in Figure 4 Intermediate red arrow, although depending on the specific configuration items each metric, but the same structure, are divided into Primary metrics, Additional metrics, etc., Primary is commonly considered official, usually the actual
work
more concerned, more index entries have reference significance, Additional is in some special scenarios may need to know the index entries.
Here briefly talk about some of the main indicators of the type of resource items, corresponding graph is not posted, it takes up too much space, affecting reading:
1、CPU:
For each index item, percentage values are representative of such a default configuration (Combined) seen in the graph 30 is the value at a certain time, which represents the total cpu time at this time accounted for 30%.
There are two more useful place worthy of note: First Scope area, you can get CPU usage of a specified process by Per Process option, the second is in CPU Cores area, we can select individual Core surveillance specified.
2、Memory:
各指标项中,usedperc(默认)和freeperc两项的数值代表与总内存的百分比,其余指标项的数值都是指内存大小,选中对应想,可以看到Metric Unit区域单位配置将变为可用,通常Mb会比较适合观察。
同样,也可以选择监控指定进程的数据
3、Disk I/O:
各指标项中,queue(默认)的数值代表等待I/O队列长度,reads、writes分别代表每秒处理的读/写次数,readbytes、writebytes顾名思义,代表每秒读/写的数据量,单位同样在Metric Unit区域配置,通常Mb会比较适合观察。
如果有挂载多个存储设备,可以在Filesystem Filter区域指定要监控的设备。
剩下的,就不一一说明了,参考前面几项,我觉得理解其他资源类型的配置应该没有问题了,至于具体指标项的含义,首先用不到的可以暂时不去了解,如果想要了解,请善用搜索。
2.2 曲线图
1、使用策略:
如果测试场景的测试执行时间较长,采集的监控数据量比较大,为了在GUI模式查看曲线图时更方便、快捷,建议将各个监控指标项单独使用一个PerfMon监听器,从而配置不同的指标项数据存储到不同的文件中,测试执行完毕后,载入数据和数据查看都会更快。
如果预计数据量不会太大,可以以服务器为单位来划分PerfMon监听器。这样可以方便的观察到整个测试过程中,某台服务器各项资源使用情况的变化趋势
对于分布式服务、为了方便观察各个节点的负载分布、负载变化趋势,可以考虑将同类型的节点放置到同一个PerfMon监听器,以便对比观察
2、数值:
当一个PerfMon监听器中展示多种指标项的数据时,为了曲线图的可观察性,插件会自动进行优化,如图5所示,我们看到在CPU项和内存项都有个x10,代表曲线图中展示的数值是在采集到的真实数值上放大了10倍,目的是为了保证不同数据项在同一坐标系中展示时,各项都变化趋势都能够被观察到。
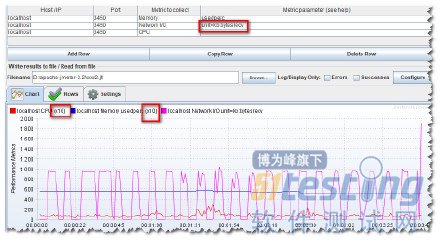
图5 曲线图
曲线图配置:
插件界面的Rows标签页可以调整要在曲线图中展示的指标项
Setting标签页中常用的有
use relative times用于配置曲线图x轴表示相对时间(测试开始时为0)还是实际系统时间。
Auto-zoom rows for best fit默认勾选,则会有上一节讲数值时提到的展示数据自动放大的功能,取消勾选则全部展示采集的实际数值。
Limit number of points in row to xx points:勾选后可以设定曲线图展示的采样点数量,我们的测试报告会有不同的角色查看,其中一些角色可能不具备也不需要对监控数据的细节理解能力,此时我们提供的监控曲线图应该是易读的,如果按照实际的所有采样点来渲染出曲线图,可能会有很多偏离趋势的噪点数据,这对于不了解的人来说可能会有很多疑惑,所以当我们有了分析结论,最后报告呈现的时候,可以考虑通过调整采样点,来让曲线图更好的展示资源使用趋势,消除其他不必要的信息。
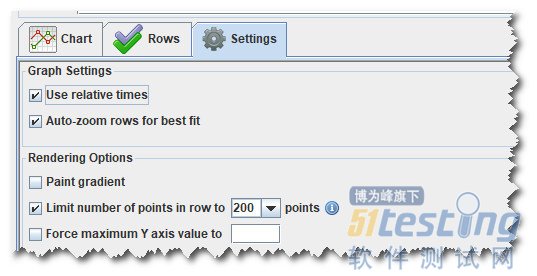
图6 曲线图配置
Force maximum Y axis value to xx,实际上我更多会选择不勾选,不勾选的情况下,插件在描绘曲线图的时候,会根据数值大小自动调整Y轴最大值,以达到更佳可读性,如图7和图8,分别是不勾选,和勾选后设置最大值为100时的曲线图效果,显然图7可以更容易的观察到变化的细节。不过与上一项类似,可能在对外出具报告时,为了更少的解释说明,可能需要某个指定的数值。
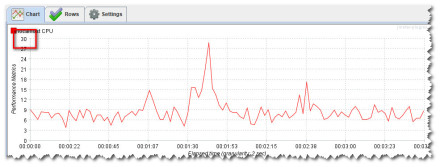
图7 不自定义Y轴

图8 自定义Y轴
2.3 自定义指标
1、EXEC
在插件界面选择指标类型时,可以看到一个EXEC选型,该选项允许我们在后面的Metric parameter中配置一个命令语句(该语句最终应该输出单个数值),测试执行时,ServerAgent将执行该命令,同时插件将接收ServerAgent捕获的输出数值。
语法规则:EXEC所配置的语句需要按照一定的规则来填写,先是给出命令的执行程序的位置,然后将具体的命令以及命令的参数作为,命令和命令参数都需要用冒号”:”来隔开。比如/bin/sh:-c:free |grep Mem |awk '{pring $7}'
/bin/sh,代表命令的执行程序
-c,即/bin/sh的-c选型,有-c选型的情况下,将从后面的字符串按一定规则解析为命令和命令参数
可以看到有用冒号分隔了执行程序/选型参数/命令语句
对于windows,也类似,如C\:\Windows\System32\cmd.exe:/c:echo %RANDOM%
2、TAIL
如同Linux的tail命令,读取文件的最后一行,用在这里,需要文件每一行只包含一个单独的数值。借助tail,我们可以通过自定义脚本监控任意指标,只需要脚本的输出满足要求即可。
显而易见,TAIL后面的参数就是配置要读取的文件的地址,测试执行时,ServerAgent将根据配置读取所在服务器的指定文件。
叁.总结
本文先简单的讲解了JMeter性能测试资源监控插件的部署,然后从现有指标、曲线图和自定义指标三个方面讲解了插件使用过程中比较使用的细节问题,希望通过本文,让大家能灵活运用这款插件来快速实现自己的测试需求。