Jmeter Plugins plugins
I was testing work: The main use of the listeners chart reporting and monitoring server CPU, memory (this blog is to plug-in installation, and jmeter how to monitor server CPU ~)
1. Download and install the plug-Plugins
Address: https://jmeter-plugins.org/install/Install/
Click the image below "red box" will be able to download at

Downloaded jar package, placed in this directory: Apache-4.0-JMeter / lib / EXT
Restart jmeter
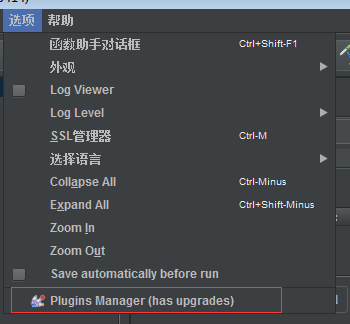
2. plugins components need to download the
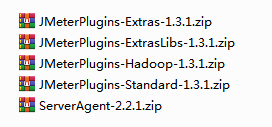
Once downloaded, the compressed package. .. jar file in the \ lib \ ext directory

Installation Directory: apache-jmeter-4.0 / lib / ext

Restart jmeter
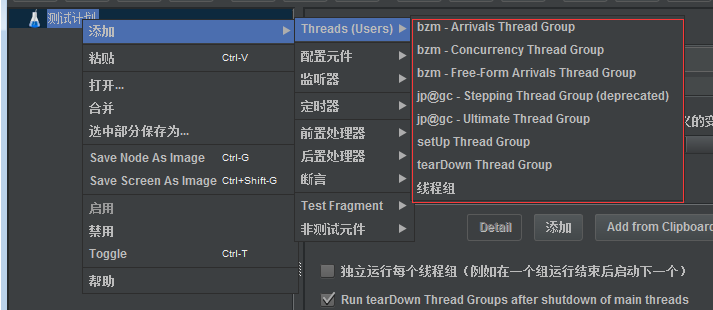
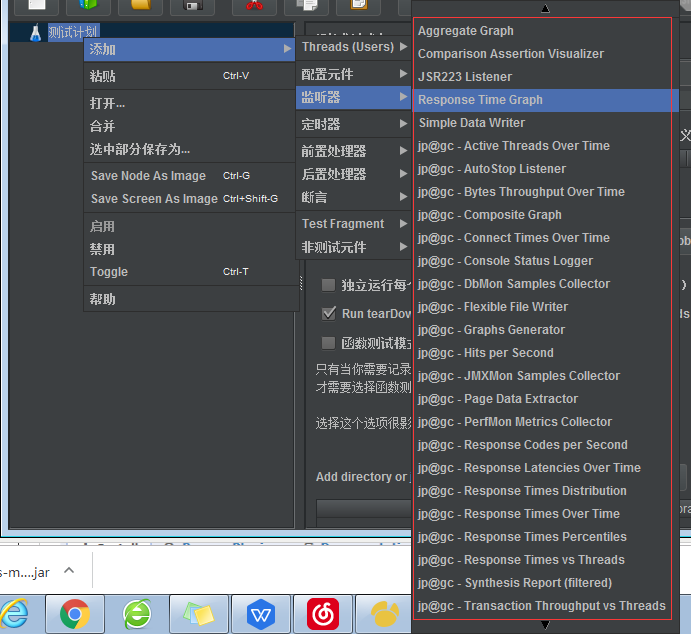
(Based on his own script, choose ~~ I want to use mainly used the listener some graphical reports: throughput, response time, server resources monitoring)
3. Server Monitoring
The server monitoring, you need to start "ServerAgent-2.2.1" The program on the server! ! !
After ServerAgent-2.2.1-extracting, copy the files to a directory on the server
● Window System: Double-click the Start startAgent.bat
● linux system: Start startAgent.sh
(1) extracting ServerAgent-2.2.1: Command: the unzip ServerAgent-2.2.1.zip
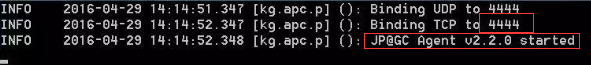
(2) Start command: ./startAgent.sh start
Below, start successfully, listening port is: 4444
● change the port command (Windows and inux all this command)
ServerAgent into the root directory, enter the command: the Java -jar ./CMDRunner.jar --tool PerfMonAgent - UDP-Port 7777 Port --tcp-7777
(7777 represents the destination port)
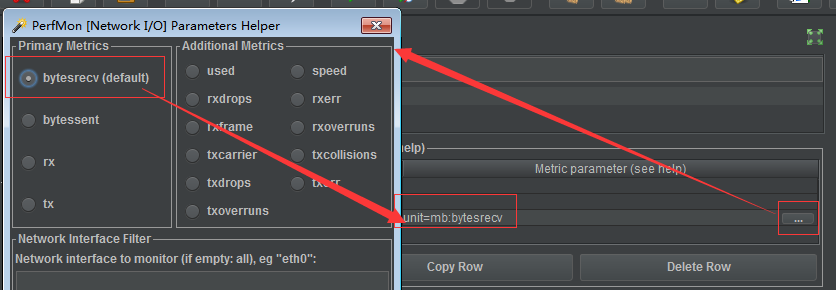
配置jmeter:jp@gc - PerfMon Metrics Collector

Note: monitor Network I / O, the need to change the Y-axis, the Y-axis so that it is the percentage of