Article directory
1. Introduction
Prometheus is an open source system monitoring and alarm system. It has now joined the CNCF Foundation and has become the second project hosted by CNCF after k8s. In the kubernetes container management system, prometheus is usually used for monitoring, and it also supports multiple An exporter collects data and supports pushgateway for data reporting. Prometheus performance is sufficient to support a cluster of tens of thousands of units.
Prometheus advantages:
- Implement flexible querying of multi-dimensional data models through PromQL.
- It defines the standards for open indicator data and custom probes (such as Exporter, etc.), which are simple and convenient to write.
- The PushGateway component allows this monitoring system to receive monitoring data.
Grafana is an open source visualization system. Use Grafana to display pages more beautifully.
2. Install Prometheus
1. Time and time zone synchronization
For monitoring systems, time out-of-synchronization will seriously lead to data collection failure or inaccurate data collection!
# 时区同步
timedatectl set-timezone Asia/Shanghai

# 时间同步
yum -y install ntpdate
/usr/sbin/ntpdate -u ntp1.aliyun.com
2. Schedule synchronization for time
# 每天凌晨5点进行时间同步
echo "0 5 * * * /usr/sbin/ntpdate -u ntp1.aliyun.com >/dev/null &" >> /var/spool/cron/root

# 查看定时任务
crontab -l
3. Install Prometheus.
Prometheus official download address:
wget https://github.com/prometheus/prometheus/releases/download/v2.42.0/prometheus-2.42.0.linux-amd64.tar.gz

tar zxf prometheus-2.42.0.linux-amd64.tar.gz
mv prometheus-2.42.0.linux-amd64 /usr/local/prometheus
cd /usr/local/prometheus/

# 修改配置监控自己的19090端口
sed -i  s/localhost:9090/localhost:19090/g prometheus.yml

# 启动监听端口为19090,不加默认9090
./prometheus --config.file=prometheus.yml --web.listen-address=:19090
PS: The above command indicates whether the test can be started. If it can be started, just stop it! Configure systemd management below
4. Add systemd management
cat > /usr/lib/systemd/system/prometheus.service << EOF
[Unit]

[Service]
ExecStart=/usr/local/prometheus/prometheus --config.file=/usr/local/prometheus/prometheus.yml --web.listen-address=:19090
ExecReload=/bin/kill -HUP \$MAINPID

[Install]
WantedBy=multi-user.target
Alias=dbus-org.fedoraproject.FirewallD1.service
EOF
Start and join auto-start at boot
systemctl start prometheus.service
systemctl enable prometheus.service
5. WEB page verification
Browser access IP: 19090
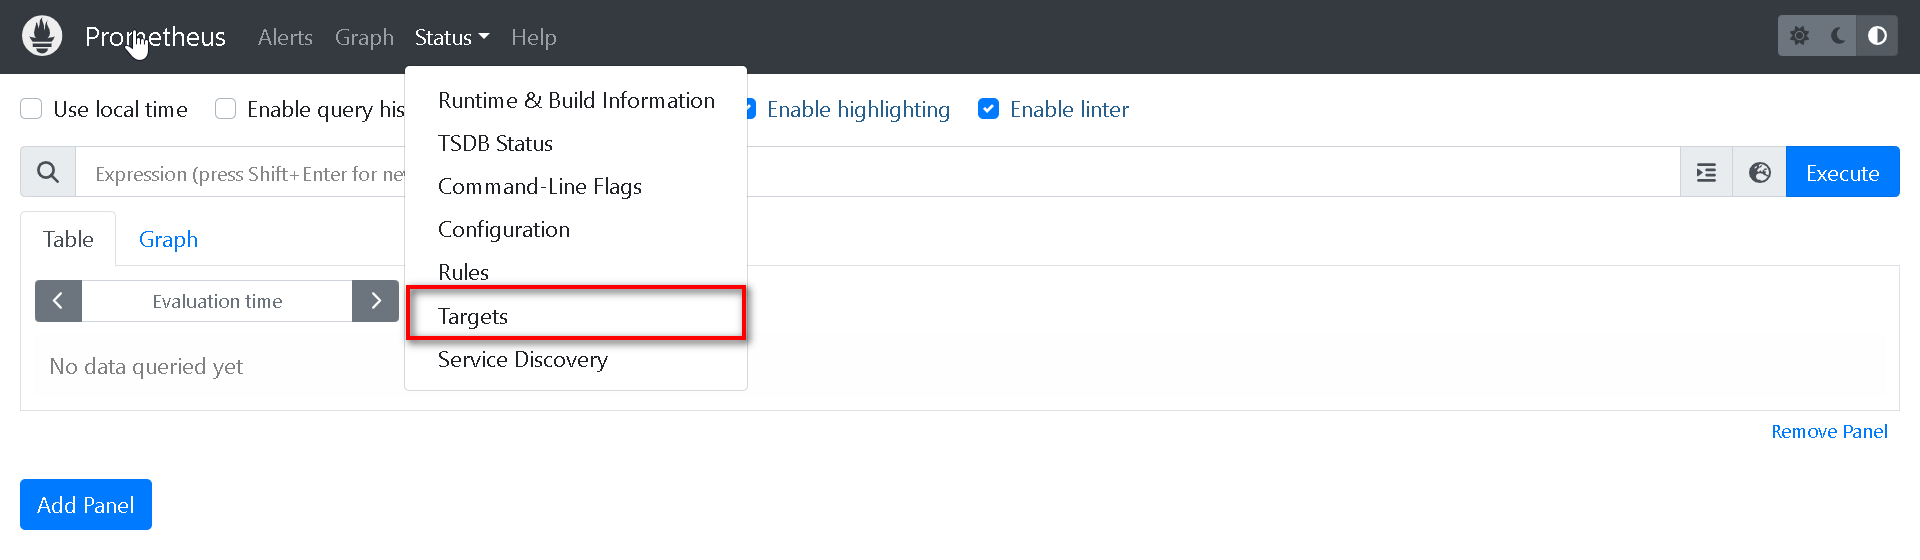

as shown in the picture above: Monitoring your status as UP means that the steps are correct!
3. Install Grafana
1. Install Grafana
Grafana official download address
wget https://dl.grafana.com/enterprise/release/grafana-enterprise-9.4.1-1.x86_64.rpm
sudo yum install grafana-enterprise-9.4.1-1.x86_64.rpm -y

systemctl enable grafana-server.service --now
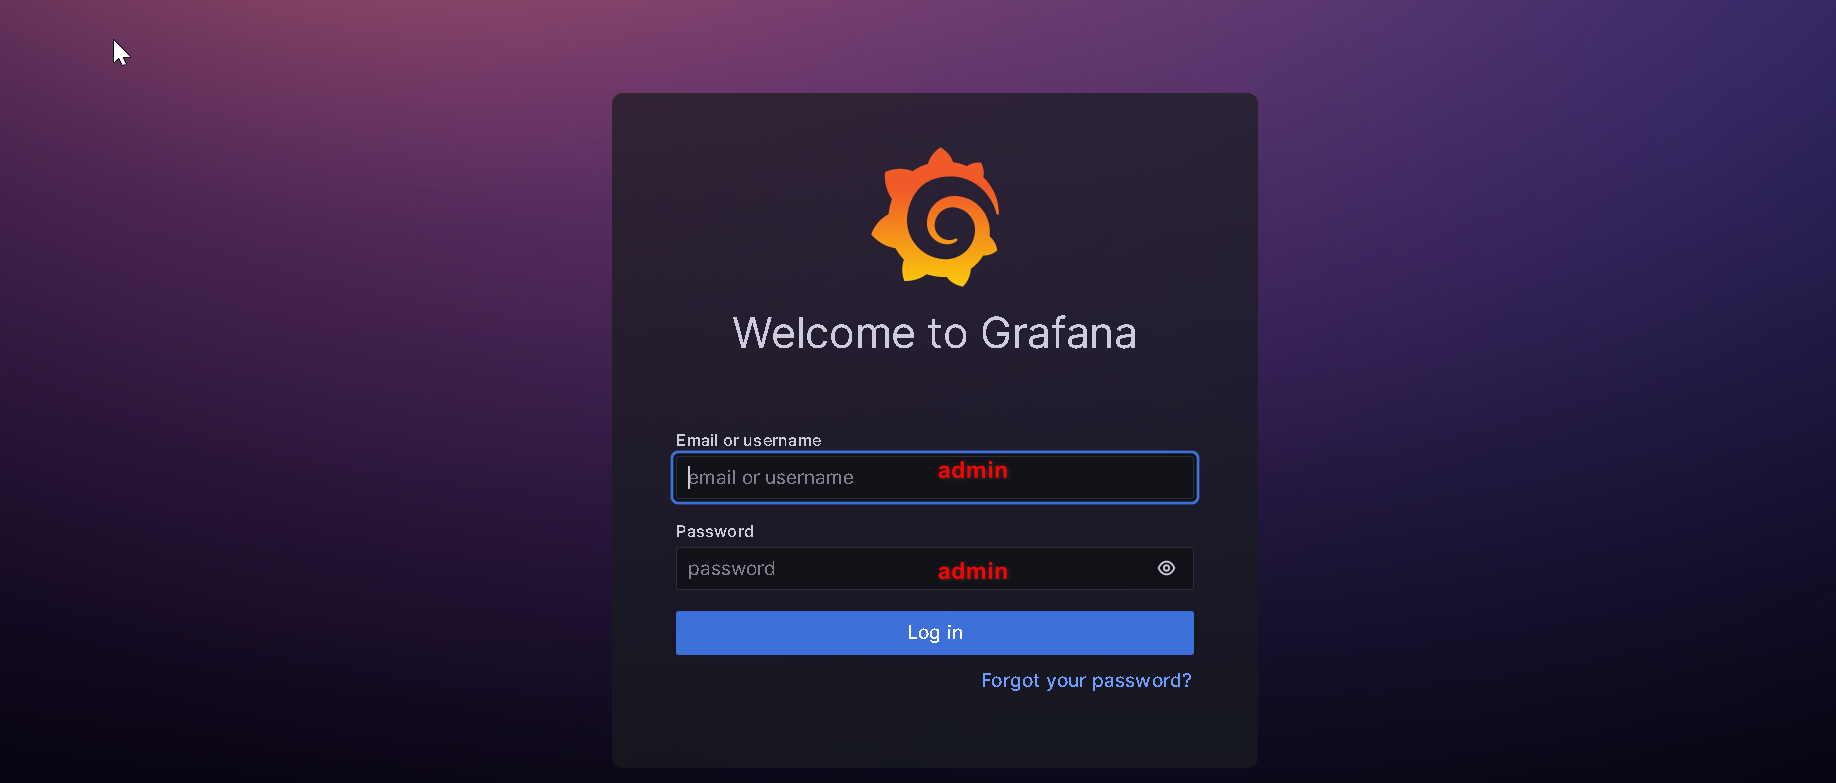
2. WEB page verification. The first time
you access IP: 3000 through the browser , you need to change the password. Just operate normally.
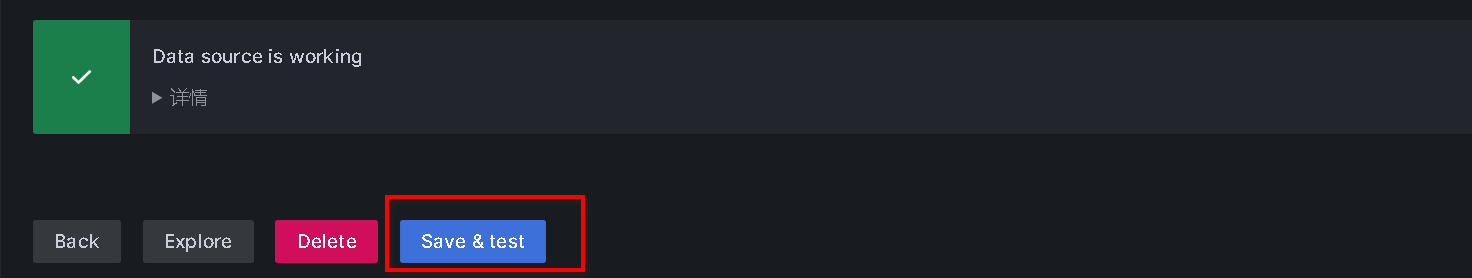
4. Pronetheus and Grafana are related
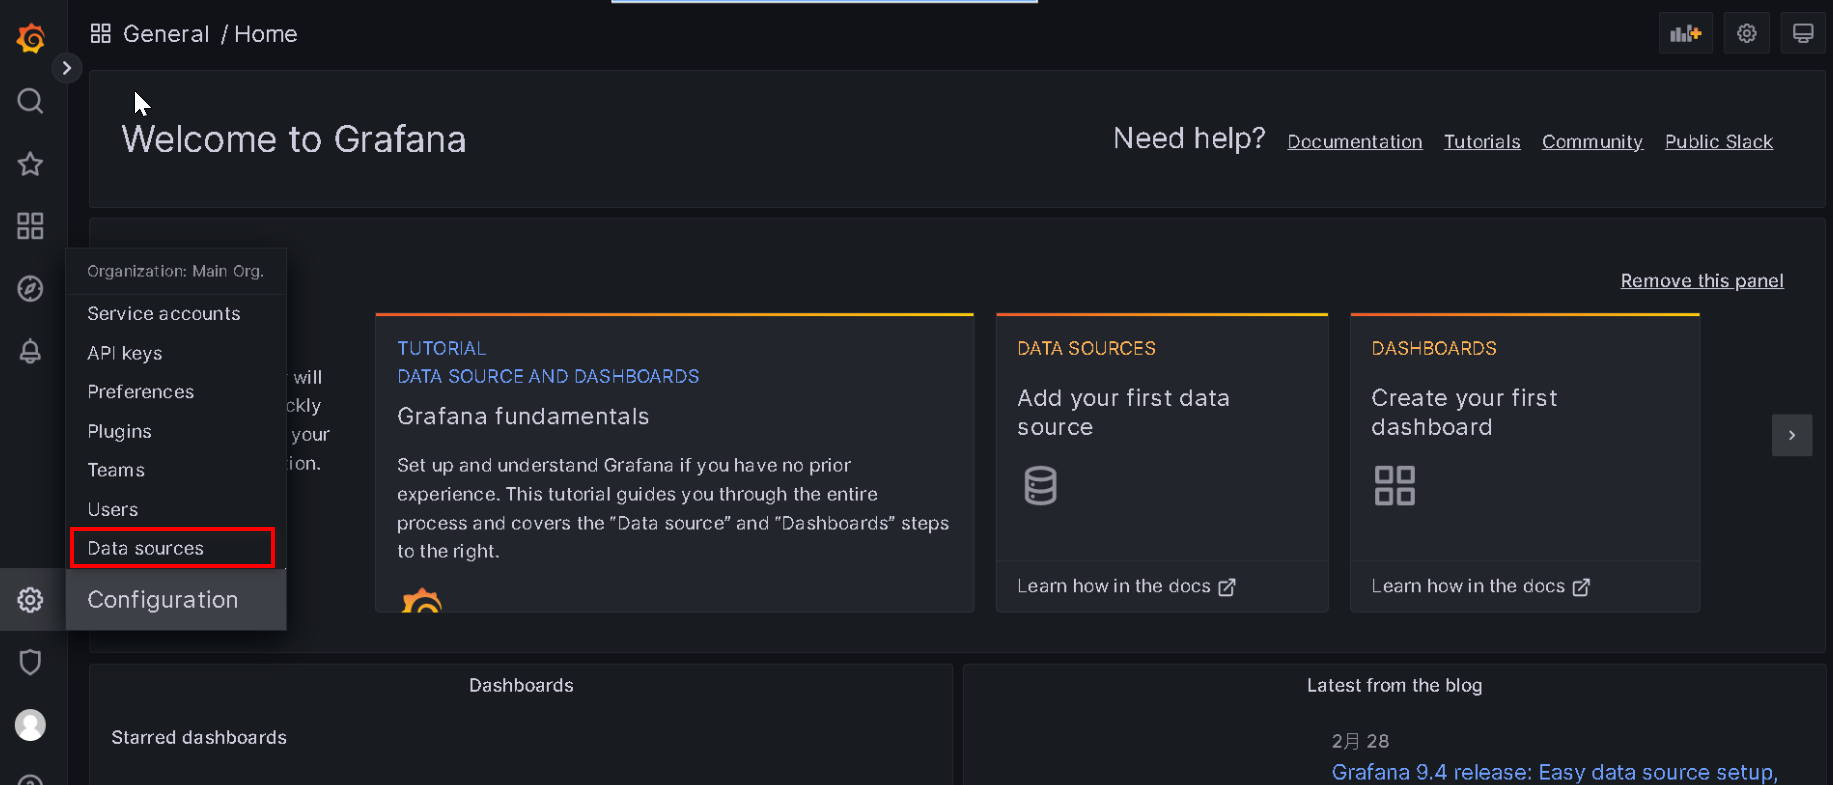
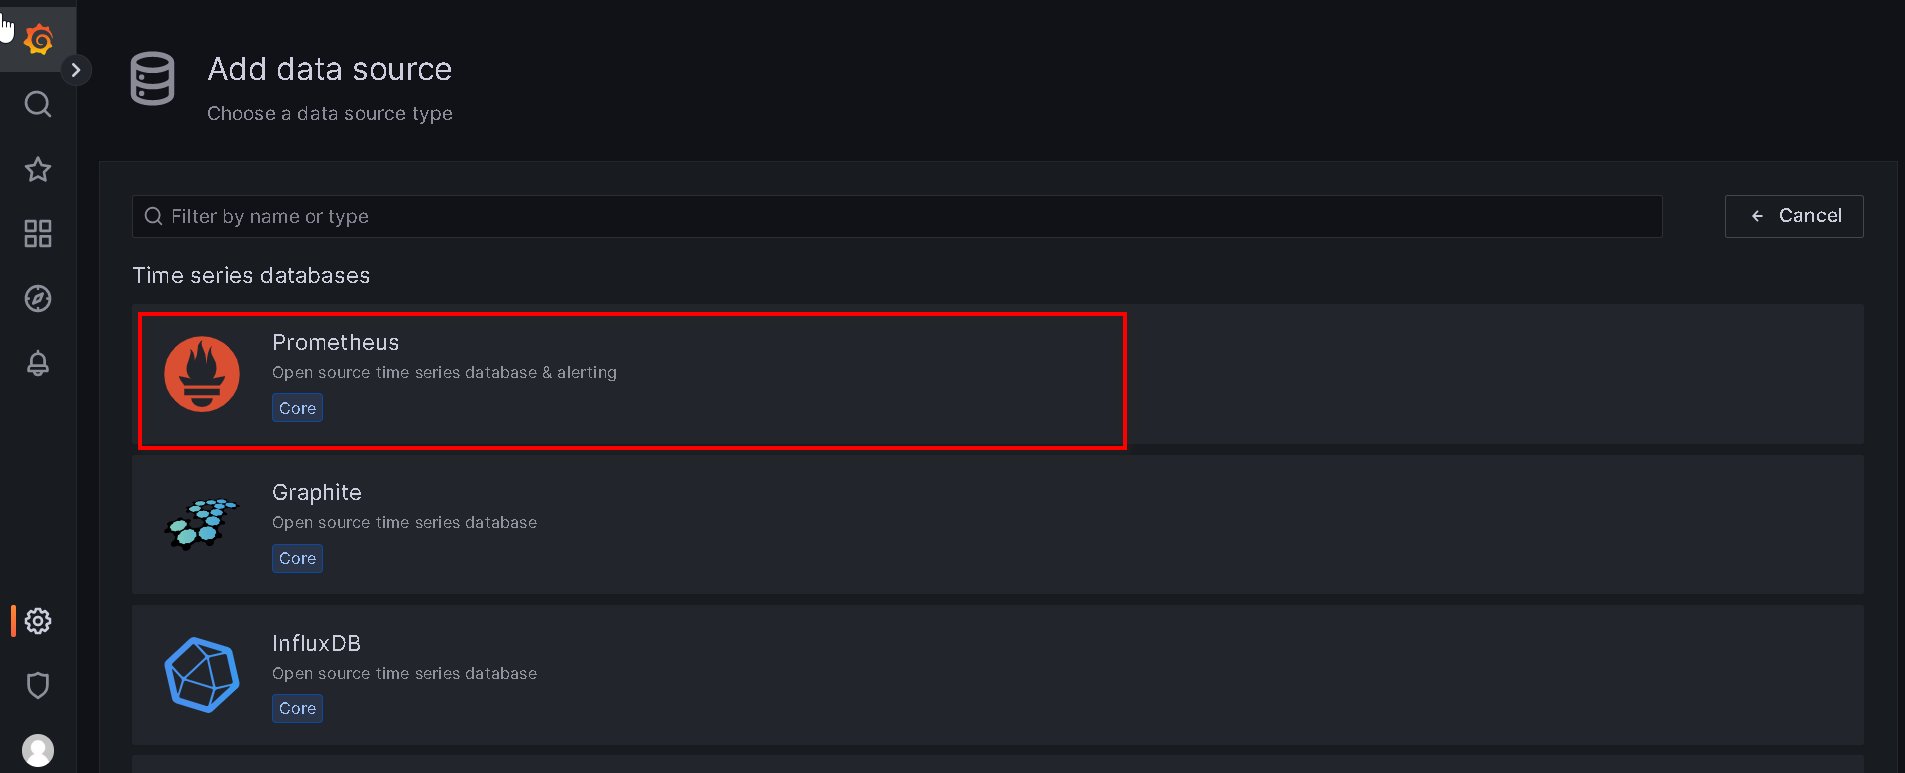
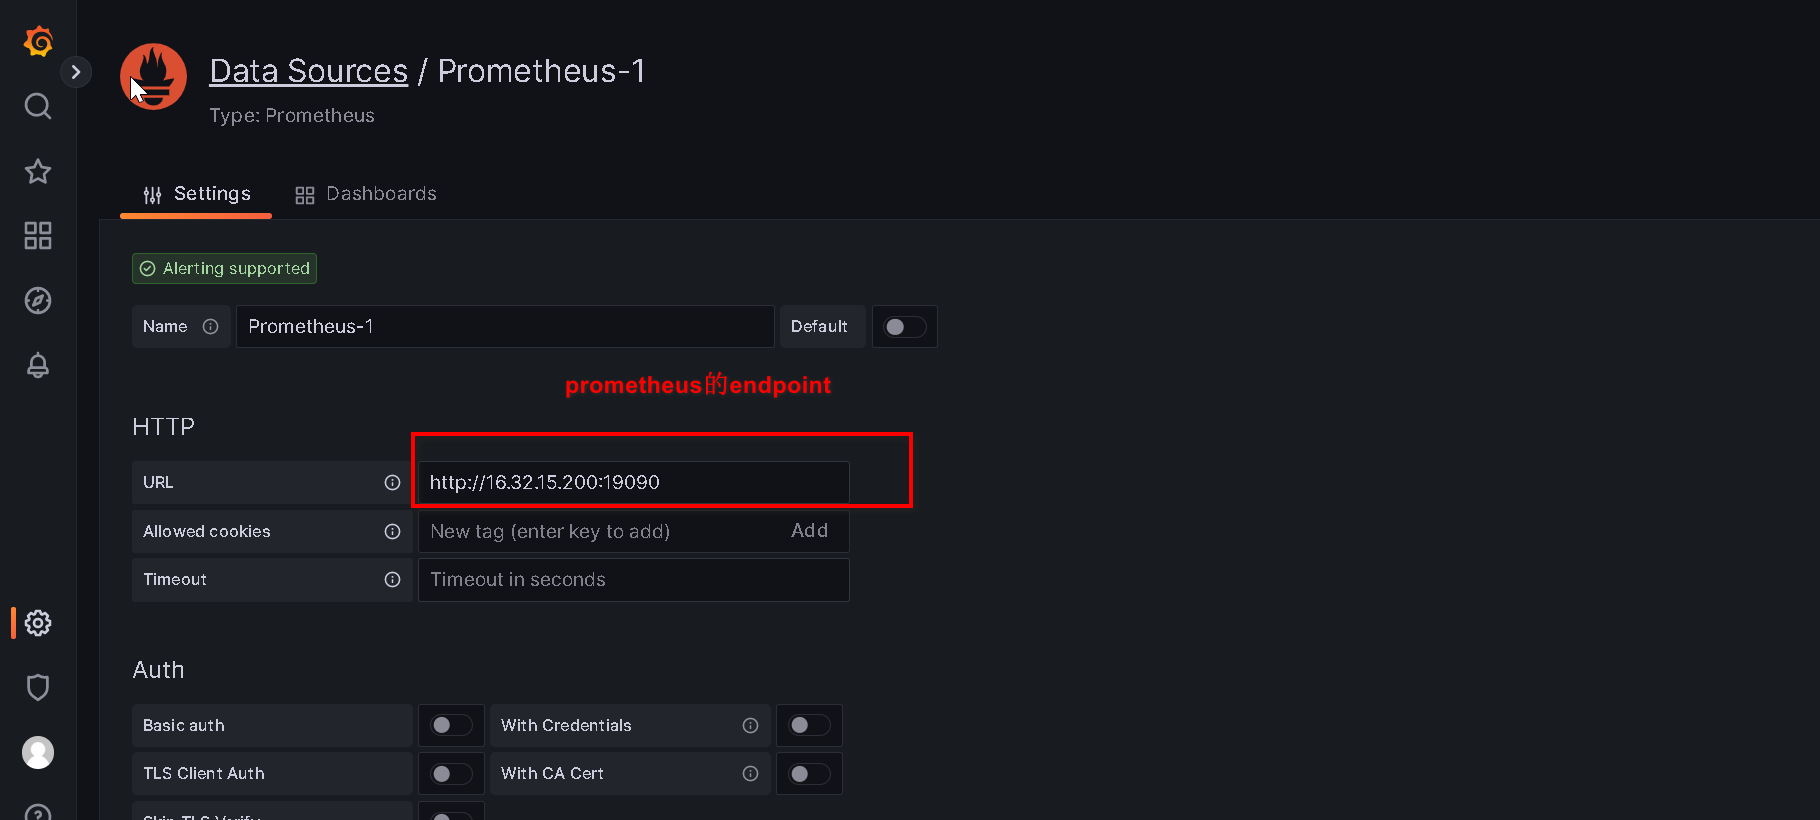
Stroke to the end and click "Save & test"
5. Monitor server status
1. Install node_exporter component.
node_exporter is a Prometheus indicator collection component. Different from the traditional indicator data collection component, it is only responsible for collecting data and does not send data to the server. Instead, it waits for Prometheus Server to actively capture it.
wget https://github.com/prometheus/node_exporter/releases/download/v1.5.0/node_exporter-1.5.0.linux-amd64.tar.gz
tar zxf node_exporter-1.5.0.linux-amd64.tar.gz
mv node_exporter-1.5.0.linux-amd64 /usr/local/prometheus/node_exporter
cd /usr/local/prometheus/node_exporter/

./node_exporter
2. Configure systemd to manage node_exporter
cat > /usr/lib/systemd/system/node_exporter.service << EOF
[Unit]

[Service]
ExecStart=/usr/local/prometheus/node_exporter/node_exporter
ExecReload=/bin/kill -HUP \$MAINPID

[Install]
WantedBy=multi-user.target
Alias=dbus-org.fedoraproject.FirewallD1.service
EOF
Start and join auto-start at boot
systemctl start node_exporter.service
systemctl enable node_exporter.service
Listens to port 9100 by default
netstat -anput |grep 9100
tcp6       0      0 :::9100                 :::*                    LISTEN      3372/./node_exporte
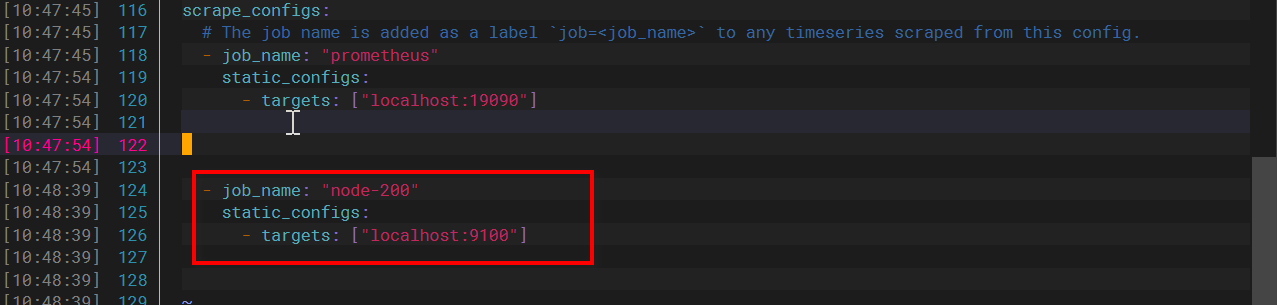
2. Prometheus adds monitoring host configuration
vim /usr/local/prometheus/prometheus.yml
# 末尾添加一下配置,注意缩进要遵守yml格式
  - job_name: "node-200"
    static_configs:
      - targets: ["localhost:9100"]
Restart Prometheus
systemctl restart prometheus.service
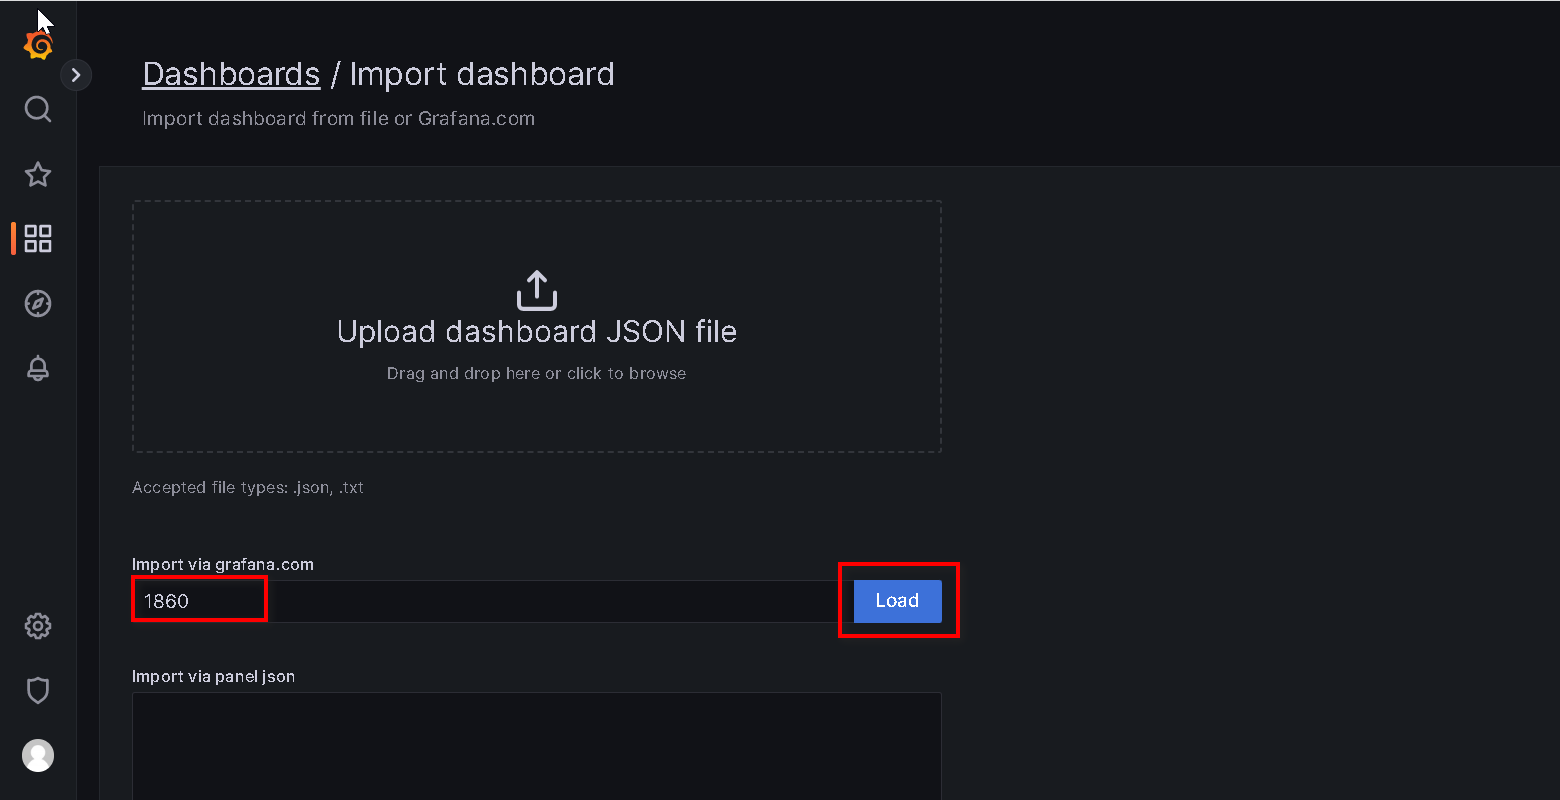
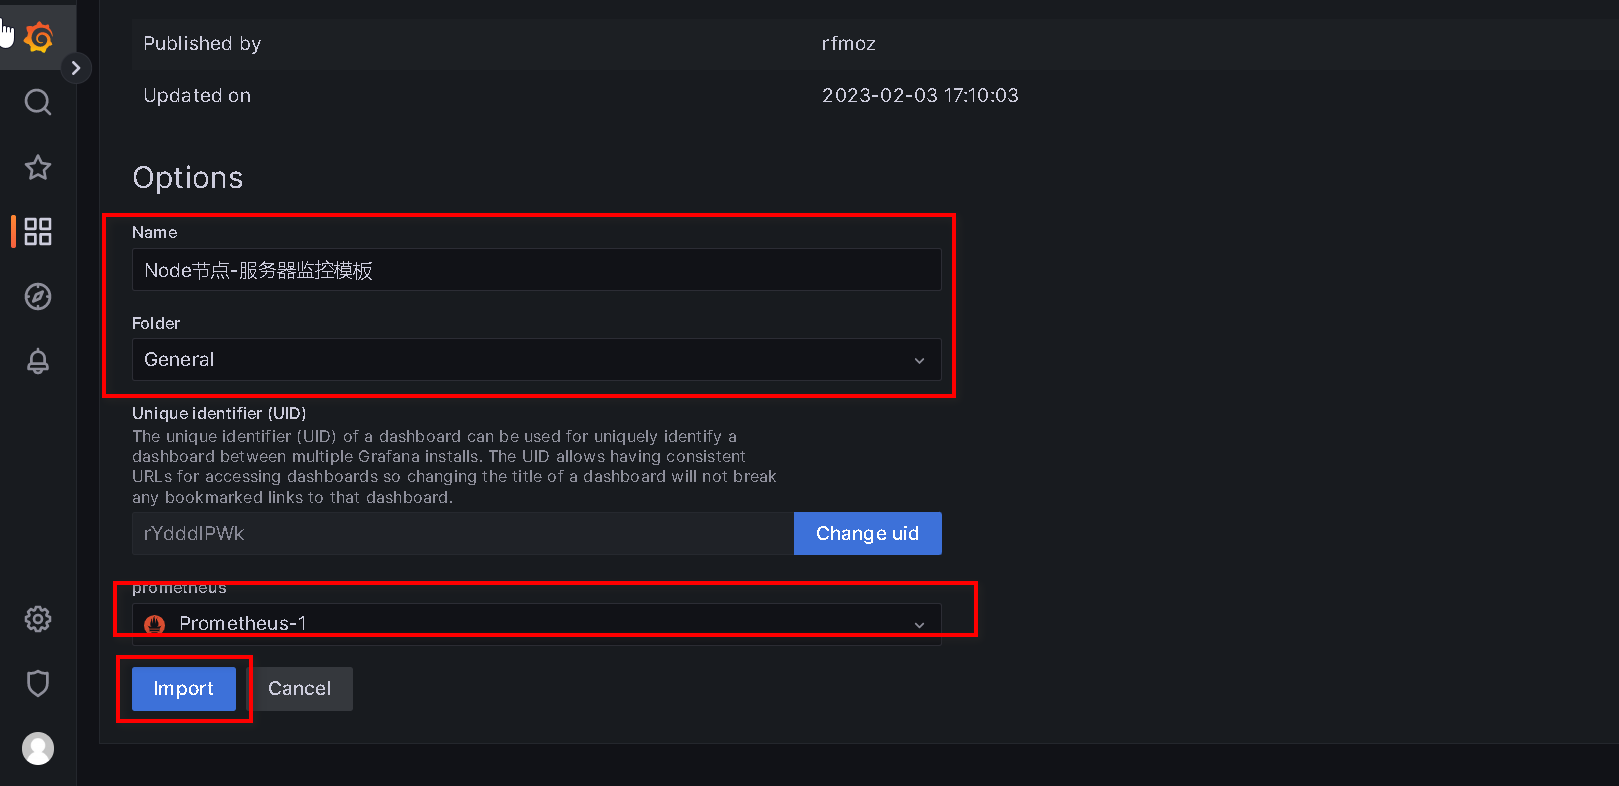
3. Import the Node monitoring template
template address:
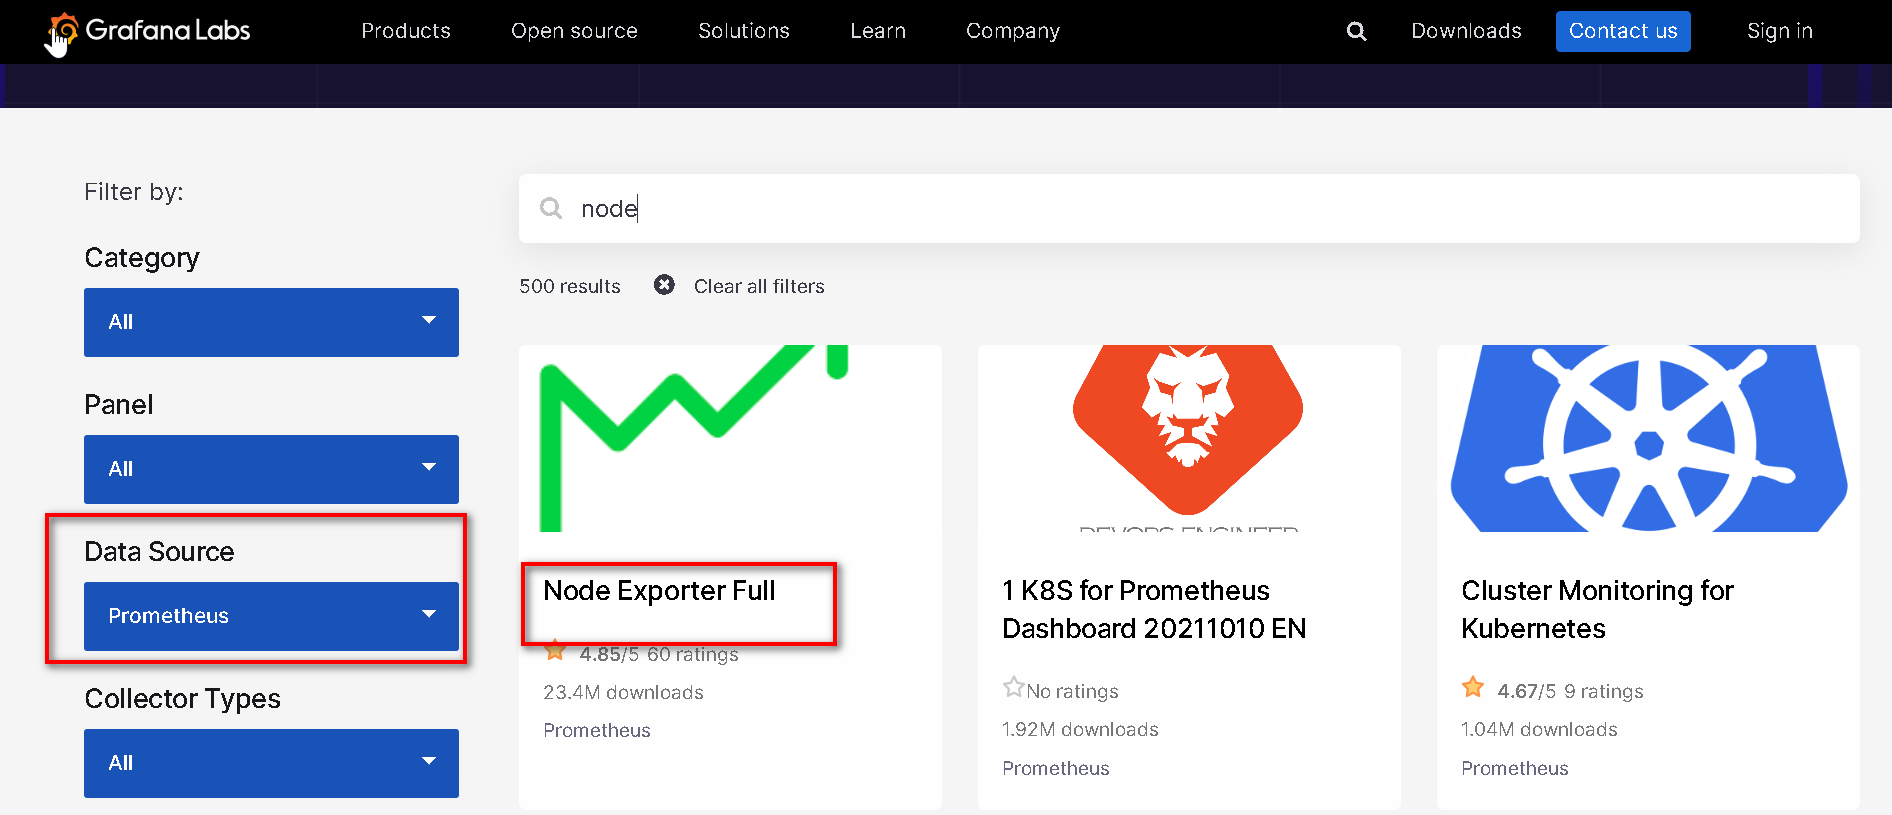
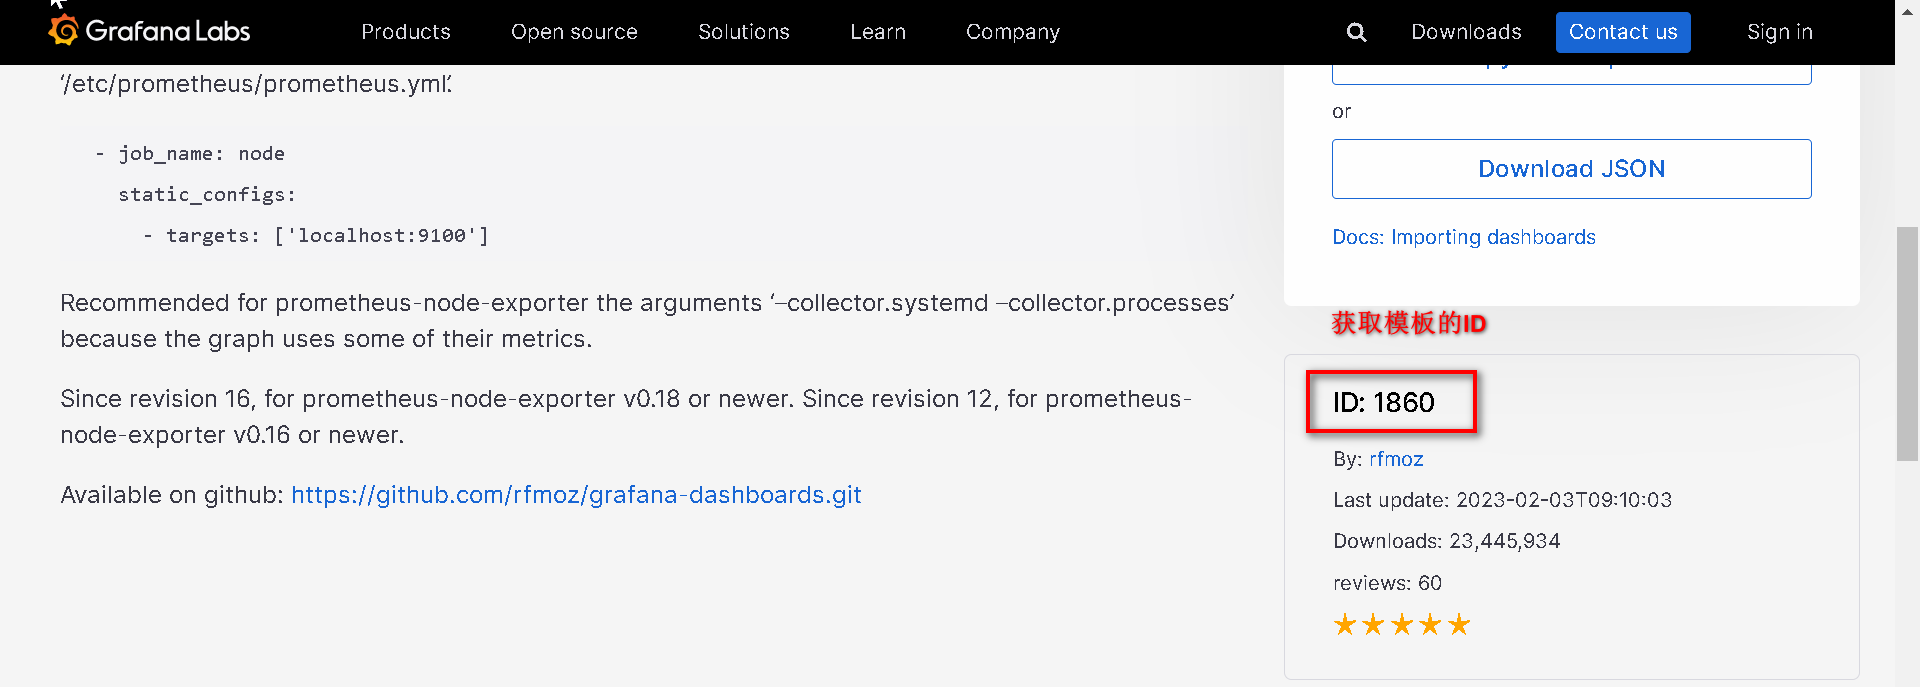
Open the Grafana platform and configure the following:

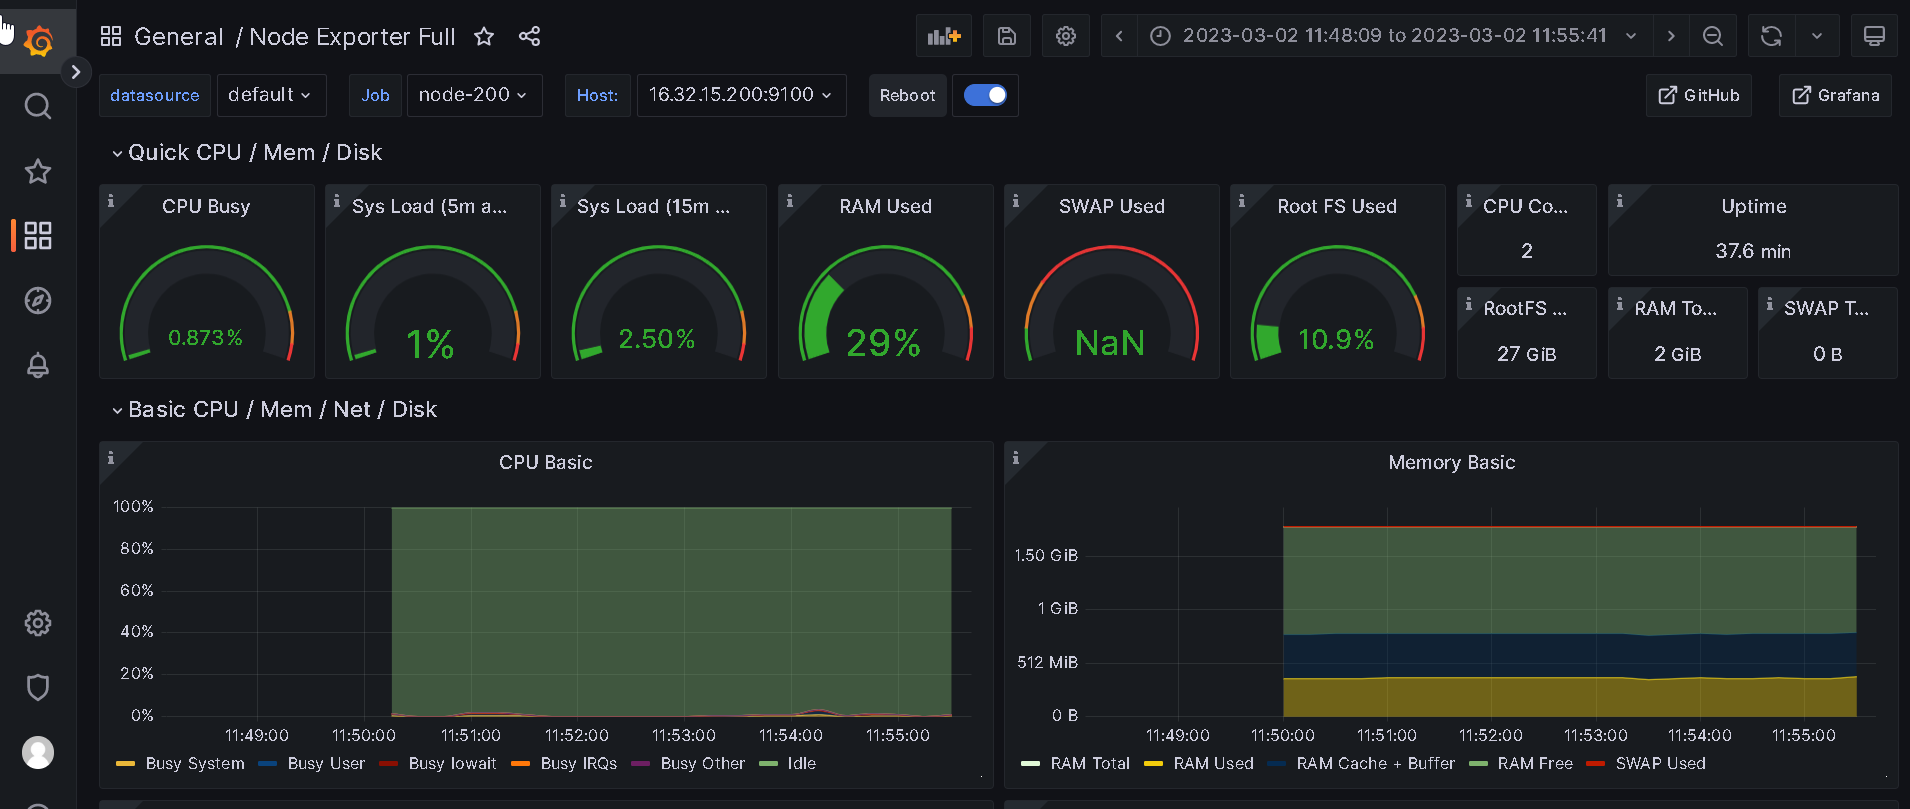
The final effect is as follows:
6. Frequently Asked Questions
1. Restart prometheus Error on ingesting samples that are too old or are too far into the futureto solve the problem
# 清空Prometheus data目录之后重启
mv data data_bak
mkdir data
systemctl restart prometheus.service