1.Abstract
Fine-grained bird image recognition is dedicated to achieving accurate classification of bird images and is a basic work in robot visual tracking. Given the importance of monitoring and conservation of endangered birds in protecting endangered birds, automated methods are needed to facilitate the monitoring of birds. In this work, we propose a new bird monitoring method based on robot visual tracking, which adopts an affinity-aware model called TBNet, which combines CNN and Transformer architectures with Novel feature selection (FS) module. Specifically, CNN is used to extract surface information. Use Transformers to develop abstract semantic affinities. The FS module is introduced to reveal identification features .
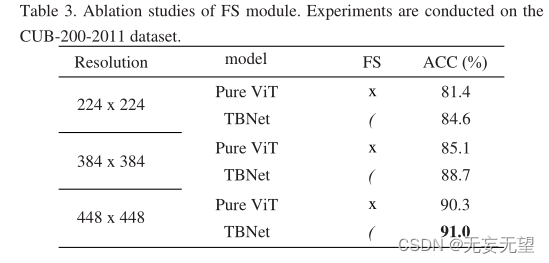
Comprehensive experiments show that the algorithm can achieve state-of-the-art performance on both the cub-200-201 data set (91.0%) and the nabbirds data set (90.9%).
2. Question
Fine-grained bird image recognition is a basic task for robot visual tracking and image processing [1-3]. Autonomous tracking of birds by robots without human interference is crucial for endangered bird conservation. Currently, some endangered birds are on the verge of extinction due to the threat of environmental degradation. Therefore, the monitoring and protection of endangered birds are of great significance to bird conservation. Given that nearly half of the world's bird populations are in decline, and 13% of them are "in a very serious situation" [4], the protection of endangered birds has attracted increasing attention. In order to strengthen bird protection, bird population monitoring has become a research hotspot. However, this has been a challenging task due to extreme field conditions, such as high temperatures in the tropics and high humidity in rainforests. Traditionally, bird researchers manually observe and record information about endangered birds in their habitats, which is a time-consuming and labor-intensive task. In recent years, with the development of artificial intelligence, many deep learning methods have been proposed for fine-grained bird image classification (FBIC). Therefore, downstream tasks such as bird monitoring fail.
Through careful observation of the appearance of birds, we discovered the affinity between various parts of birds, which is helpful for FBIC research. As shown in Figure 1, the combination of a bird's head and beak or the color pattern on a bird's head, wings and tail. These affinity relationships can be used as discriminant features of FBIC.

2.1 Discovery
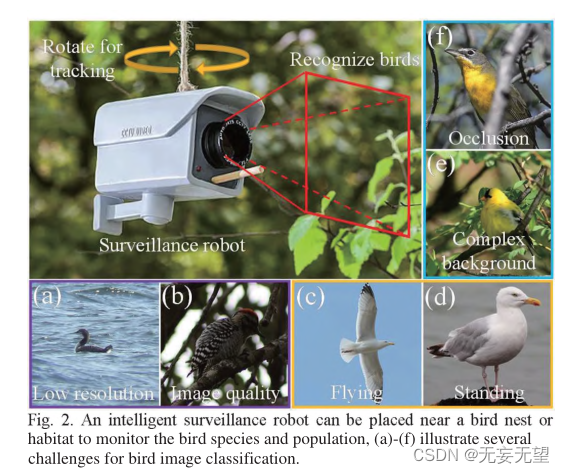
However, identifying birds in the wild also faces some challenges. First, image quality will vary due to the extreme wild environment. For example, images taken from a distance may result in low resolution (Figure 2(a)), or images taken under low illumination (Figure 2(a)). 2(b)), second, there are arbitrary bird poses. For example, as can be seen in Figure 2(e) and Figure 2(d), the first image shows a flying herring gull, while the second image shows a standing herring gull. In each image, the birds appear to have a different appearance, another source of difficulty for the FBIC. Third, due to the concealment and complexity of wild backgrounds, birds may be among branches and leaves (Figure 2(e)), or may be observed by branches (Figure 2(f)), which makes the classification of bird images brought difficulties.
2.2 Development
Since it is of great significance to identify the semantic long-term dependent affinities between bird images, Transformer is a language that is inherently good at exploring microscopic fine-grained details and microscopic long-term dependent semantic relationships in images. Transformer[5] was originally used for natural language processing. Then was inspired by the field of computer vision. Carion et al. [6] proposed an end-to-end target detection method based on Transformer. In [7], Dosovitskiy et al. proposed vision Transformer (ViT), which was applied for the first time and proved that pure Transformer is a method that can compete with CNN and The structure that occupies its place. Therefore, the ViT structure is used as the backbone of our model to exploit the affinities of FBIC tasks.
2.3 Innovation
In this work, we propose a method that can be used for smart bird monitoring robots (Fig. 2), which can be installed near feeders, bird nests, or bird habitats. The robot can rotate vertically and horizontally to provide a wider field of view to detect birds. The robot records images at regular intervals, increasing the frequency when a bird is detected in the image. A large robot is equipped with a large-capacity battery that allows for long-term monitoring. Our TBNet model program chip is also installed inside the robot, which can classify birds in real time.
During the monitoring period, the frequency of occurrence of study birds will be calculated and recorded. The information collected can then be used by bird researchers to estimate and conserve bird populations. The TBNet model classifies bird images by identifying affinity relationships in bird images, thereby facilitating downstream bird population estimation. In summary, the main contributions of this work are as follows:
1) A new robot visual tracking method for bird protection is proposed. The smart monitoring robot can rotate to different directions and record the number of birds.
2) An effective TBNet model was established. To our knowledge, this affinity has been revealed for the first time in bird imagery. Therefore, ViT is used to exploit these abstract semantic affinities. CNN is used to extract surface information, and the FS module is introduced to reveal discriminative features. For feature map generation of TBNet model, a feature extraction strategy (CPG strategy) is proposed.
3) Conduct experiments on two bird data sets, CUB-200-2011 and NABirds. The proposed TBNet achieves better performance compared to several existing state-of-the-art methods, thus validating its effectiveness.
3.Network
3.1 Overall structure
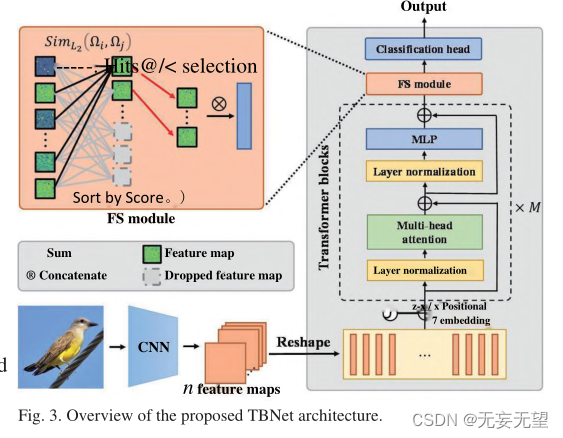
The pipeline of the TBNet model is shown in Figure 3. The method includes three parts: feature extraction backbone, FS module and classification head . The first part is the feature extraction backbone, which is used to extract fine-grained and multi-scale information of bird images. Generally speaking, several current backbones [1-3,7] can be considered as candidates. Since CNN has a strong ability to extract surface information, and Transformer is outstanding in mining abstract semantic affinity relationships, this study uses the combination of CNN and ViT as the backbone . Backbone was further modified to improve performance. To mitigate overfitting, the developed network has a dropout layer at the classification head of the backbone. The second part is the FS module, which extracts the discriminative features of specific birds. The third part is the classification head, in which the feature map is finally used for final classification.
1. Use the CNN network to extract preliminary features of the image, and then compress it into a patch and input it into the vit network, which can retain more of the global information of the image, but at the same time some low-level detailed information is ignored due to layer-by-layer convolution.
2. The FS module is equivalent to image enhancement. It increases the weight of significant areas by removing areas with small contributions in the transformer block.
3.2 Feature map generation
The bird images are processed through the feature extraction backbone and feature maps are generated. This process can be summarized into three steps: CNN processing, position embedding, and passing the Transformer block (CPG strategy). After the process is completed, the original input image is converted into a feature map for classification.
Step I:CNN processing. In this step, the original input image is initially processed through CNN to generate n feature maps. Then, each feature map t is planarized into a one-dimensional vector. Next, apply linear projection to project pt into p[. This process is expressed as follows:

In the formula, pt is the i-th patch, E is the linear projection, and i is the d-dimensional projected visual vector.
Step II: Position embedding. Since the Transformer layer is invariant to the arrangement of the input patch sequence, position embeddings are needed to encode the spatial positions and relationships of patches. Specifically, these patches are added via positional embedding into patch vectors. The embedding formula is as follows:

In the formula, represents a matrix composed of patch vectors, n represents the number of patches, and
represents position embedding. The type of position embedding can be chosen from several options, namely 2D sinusoidal, learnable and relative position embedding.
Step III: Go through the Transformer block. The positional embedding patch is then passed through M Transformer blocks. Each Transformer block is calculated as follows:

where l and
are the output patch vectors of the MSA module and MLP module of transformer block 1 respectively. LN(-) indicates layer normalization. MLP represents multiple fully connected layers. MSA means bulls watch themselves. These transformer blocks can be divided into N levels.
3.3 FS module
The original patch may introduce damaging features that are detrimental to classification. Figure 4 shows the list of attribute mappings in the Transformer block. The final stage sorts the feature maps based on their discrimination scores. As shown in Figure 4, in lower levels, such as stage 1 and stage 2, the Hits@k features have almost no similarity to each other, while the features with worse scores are almost identical to each other. In higher layers, such as stage N, the Hits@k features are more similar and highly activated, while the features with worse scores appear to be noisy. In general, at each stage, salient features of high scores are more important than salient features of low scores . Therefore, we propose the FS module to further utilize the information provided by these unique features and effectively mitigate the damaging effects of destructive features.
Suppose in stage i, the output is n ID patch vectors, denoted as Qj,ie[1,2,3,…,]. First, the FS module calculates the similarity between n vectors. Select similarity from cosine similarity or the inverse of L2 distance. Cosine similarity is defined as follows

Where F ” and G ” are two vectors, Sc (F,G) ∈[0,1]. The value of Sc represents the similarity between F and g, and its L2 distance is constructed as follows:

Where "F" and "G" represent two feature vectors. The calculation formula of similarity is as follows:
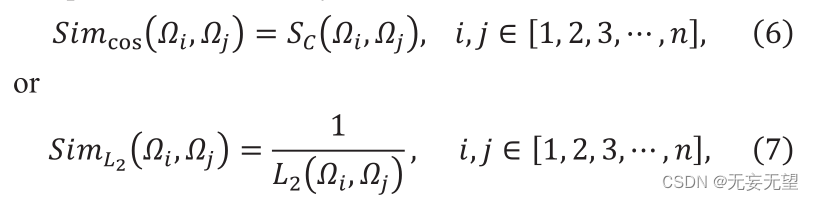
Among them, and
represent the i-th and j-th patch vectors respectively. Sc represents cosine similarity,
which represents
distance. By calculating the similarity, the similarity matrix can be obtained. The similarity matrix containing the similarities between all patches can be expressed as:

Secondly, each patch vector obtains a discriminant score by adding its similarity to other patch vectors and performing a round-trip operation. The operating formula is as follows:
 Finally, the Hits@k (k) patch vector with the highest score is selected and input to the next layer. The remaining patch vectors are discarded because they are less discriminative.

4. Experiment
4.1 Experimental setup
4.1.1 Dataset
CUB-200-2011,NABirds
4.1.2 Experimental details
The proposed model is implemented in the following way. First, resize the input image resolution to 448 to 448 for a fair comparison. To improve efficiency, the batch size is set to 8. The AdamW optimizer is used, and the weight attenuation is 0.05. The learning rate is initialized to 0.0001. All experiments were performed on an Nvidia TITAN GPU using the PyTorch toolbox.
4.2 Comparative test


4.3 Ablation experiment
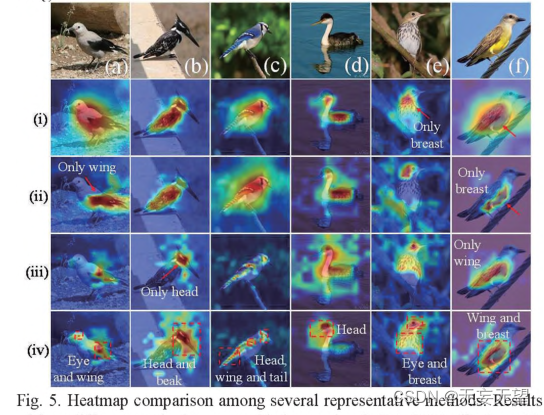
4.4 Visualization
5 Conclusion
In this work, we propose a new visual tracking method for bird protection robots. The smart monitoring robot can rotate to different directions and record the number of birds. On this basis, an effective TBNet model is established. To our knowledge, affinities in bird images have been revealed for the first time. CNNs are used to extract superficial information. Use ViT to mine abstract semantic affinity relationships. The FS module is introduced to reveal identification features. For feature map generation of TBNet model, a feature extraction strategy (CPG strategy) is proposed. We tested TBNet on two FBIC datasets. Experimental results show that this method can identify affinity relationships and discriminative features in bird images. With the promising results achieved by TBNet, it is reasonable to believe that visual tracking of birds by robots has great potential.