Image segmentation is the technology and process of dividing an image into several specific regions with unique properties and proposing objects of interest. It is a key step from image processing to image analysis. Existing image segmentation methods are mainly divided into the following categories: threshold-based segmentation methods, region-based segmentation methods, edge-based segmentation methods, and segmentation methods based on specific theories. From a mathematical perspective, image segmentation is the process of dividing a digital image into disjoint regions. The process of image segmentation is also a labeling process, that is, pixels belonging to the same area are assigned the same number.
Segmentation in HSI color space
The HSI color space is oriented to color processing, using hue (H) and saturation (S) to describe color, and brightness (I) to describe the intensity of light.
The establishment of the HSI model is based on two important facts: ① The I component has nothing to do with the color information of the image; ② The H and S components are closely related to the way people experience color. These characteristics make the HSI model very suitable for color feature detection and analysis.
Assume the region of interest is the red color in the original RGB image. Observing the H component reveals that the region of interest has a higher hue value. Observing the S component image, you can find that the color saturation in the area of interest is higher. In the saturation image, the selection threshold is equal to 30% of the maximum saturation. Any pixel larger than the threshold is assigned a value of 1 (white), and the others are assigned a value of 0 (black). Can produce split image effect.
from skimage import data,io
from matplotlib import pyplot as plt
import math
import numpy as np
import sys


# 定义RGB图像转换为HSI图像函数
def rgb2hsi(r, g, b):
    r = r / 255
    g = g / 255
    b = b / 255
    num = 0.5 * ((r - g) + (r - b))
    den = ((r - g) * (r - g) + (r - b) * (g - b)) ** 0.5
    if b <= g:
        if den == 0:
            den = sys.float_info.min
        h = math.acos(num / den)
    elif b > g:
        if den == 0:
            den = sys.float_info.min
        h = (2 * math.pi) - math.acos(num / den)
    s = 1 - (3 * min(r, g, b) / (r + g + b))
    i = (r + g + b) / 3
    return int(h), int(s * 100), int(i * 255)


img=io.imread("F.jpg")

hsi = np.zeros(img.shape, dtype='uint8')
for ii in range(img.shape[0]):
    for jj in range(img.shape[1]):
        r, g, b = img[ii, jj, :]
        h, s, i = rgb2hsi(r, g, b)
        hsi[ii, jj:] = (h, s, i)
H = hsi[:, :, 0]
S = hsi[:, :, 1]
I = hsi[:, :, 2]
# 生成二值饱和度模板
S_template = np.zeros(S.shape, dtype='uint8')
for i in range(S.shape[0]):
    for j in range(S.shape[1]):
        if S[i, j] > 0.3 * S.max():
            S_template[i, j] = 1
# 色调图像与二值饱和度模板相乘可得分割结果F
F = np.zeros(H.shape, dtype='uint8')
for i in range(F.shape[0]):
    for j in range(F.shape[1]):
        F[i, j] = H[i, j] * S_template[i, j]
# 显示结果
plt.figure()
plt.axis('off')
plt.imshow(img)
# 显示H S I分量
plt.figure()
plt.axis('off')
plt.imshow(H, cmap='gray')
plt.figure()
plt.axis('off')
plt.imshow(S, cmap='gray')
plt.figure()
plt.axis('off')
plt.imshow(I, cmap='gray')
plt.figure()
plt.axis('off')
plt.imshow(S_template, cmap='gray')  # 二值饱和度模板
plt.figure()
plt.axis('off')
plt.imshow(F, cmap='gray')  # 分割结果
plt.show()
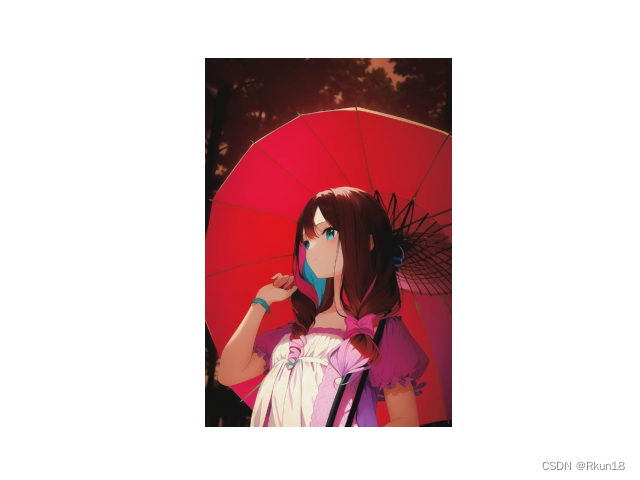
RGB image:
H component:
S component:
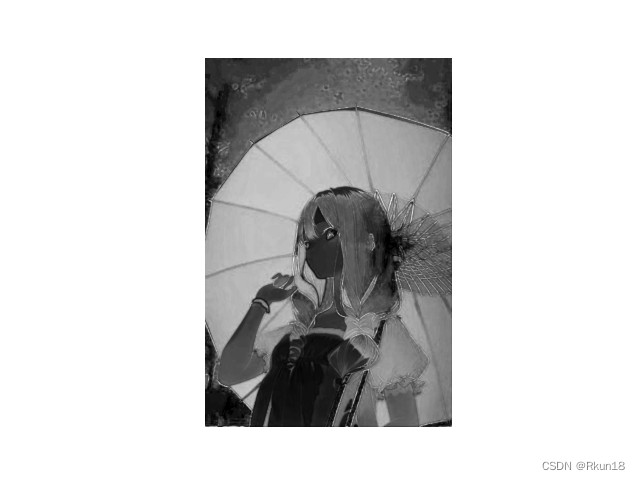
I component:
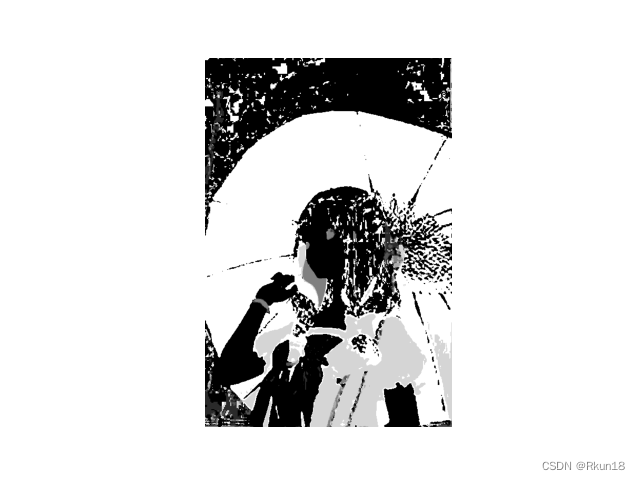
Binary saturation template:

Segmentation results:

Segmentation in RGB color space
RGB is a color space commonly used to describe color images. RGB is the most direct segmentation algorithm in color space, and the obtained segmentation effect is usually better. Assuming that the area of interest is a red umbrella, you can select some pixels that can represent the red umbrella to form a sample set, and estimate the "average" of the color to be segmented through the sample set. Use vector a to represent the average color, and vector z to represent the color characteristics of any pixel in RGB space. If the Euclidean distance between z and a is less than a given threshold
, z and a are considered similar. The Euclidean distance requires the square root. In order to simplify the calculation, a bounding box is used. The center of the box is at a, and the length of the box in the three dimensions of RGB is proportional to the standard deviation of the sample set in each dimension. If z is inside the box, the color feature z is in the area of interest, otherwise it is in the area of no interest.
from skimage import io
from matplotlib import pyplot as plt
import math
import numpy as np

img = io.imread("F.jpg")
r = img[:, :, 0]
g = img[:, :, 1]
b = img[:, :, 2]
# RGB颜色空间分割
# 选择样本区域
r1 = r[128:255, 85:169]
# 计算该区域彩色点平均向量a的红色分量
r1_u = np.mean(r1)
# 计算样本红色分量标准差
r1_d = 0.0
for i in range(r1.shape[0]):
    for j in range(r1.shape[1]):
        r1_d = r1_d + (r1[i, j] - r1_u) * (r1[i, j] - r1_u)
r1_d = math.sqrt(r1_d / r1.shape[0] / r1.shape[1])
# 寻找符合条件的点 r2为红色分割图像
r2 = np.zeros(r.shape, dtype='uint8')
for i in range(r.shape[0]):
    for j in range(r.shape[1]):
        if r[i, j] >= (r1_u - 1.25 * r1_d) and r[i, j] <= (r1_u + 1.25 * r1_d):
            r2[i, j] = 1
# img2根据红色分割后图像
img2 = np.zeros(img.shape, dtype='uint8')
for i in range(r.shape[0]):
    for j in range(r.shape[1]):
        if r2[i, j] == 1:
            img2[i, j, :] = img[i, j, :]
plt.subplot(121)
plt.title("RGB")
plt.imshow(img)
plt.subplot(122)
plt.title("R")
plt.imshow(r, cmap='gray')
plt.show()
plt.subplot(121)
plt.title("G")
plt.imshow(g, cmap='gray')
plt.subplot(122)
plt.title("B")
plt.imshow(b, cmap='gray')
plt.show()
plt.subplot(121)
plt.title("RED")
plt.imshow(r2, cmap='gray')
plt.subplot(122)
plt.title('split RGB')
plt.imshow(img2)
plt.show()
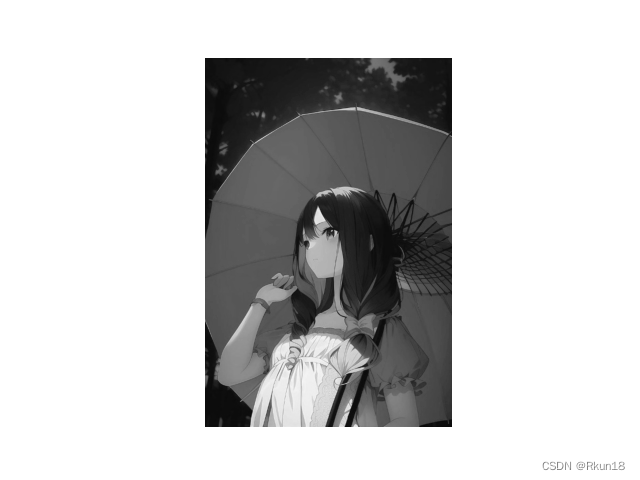
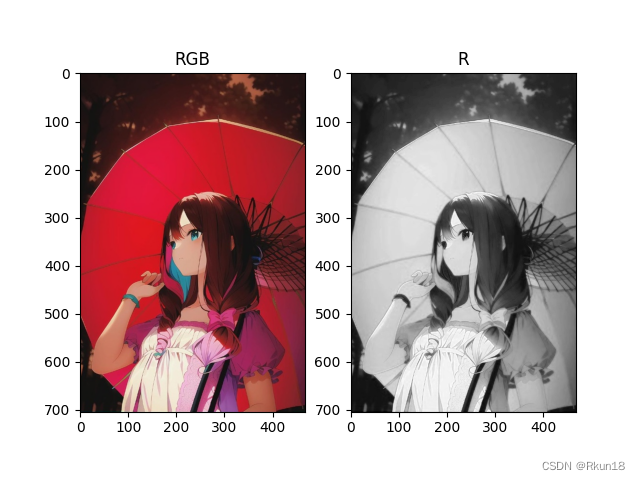
RGB and R components:
G and B components:
Red segmented image and segmented RGB image:
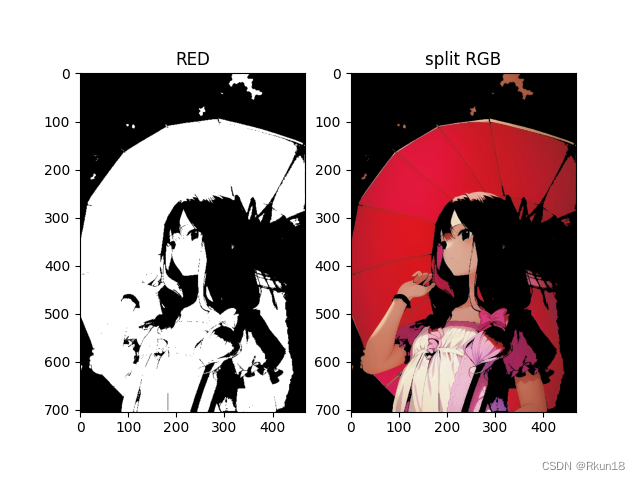
Observation shows that the brightness value of the red area of the R component is higher, and the red umbrella area and the background are more obvious in the R component, so the R component is selected as the analysis object. Select a small area of the red umbrella as a sample set, and calculate the red component of the average vector a in this area. When the difference between the red component of z and the red component of the average vector is within a certain range, the pixel of z is determined to be an interesting pixel, otherwise it is an uninteresting pixel. Keep the original brightness value of the pixels of interest, set the brightness of the uninteresting pixels to 0 (black), display a red umbrella, and weaken the background.
Use skimage library functions
skimage is a Python image processing library that provides many tools for image analysis and processing. You can use skimage to do color segmentation, which means separating different colors in an image for further processing.
To perform color segmentation, you can use the color module from skimage. This module provides many functions that can be used to convert color spaces, extract color features, perform color correction, etc.
from skimage import io, color
from skimage.filters import threshold_otsu
from matplotlib import pyplot as plt

# 读取RGB图像
image = io.imread('demo.jpg')

# 将图像转换为灰度图像
gray_image = color.rgb2gray(image)

# 对灰度图像进行二值化处理
threshold = threshold_otsu(gray_image)
binary_image = gray_image > threshold

# 将二值图像保存到文件
io.imsave('binary_image.jpg', binary_image)

# 读取RGB图像
img = io.imread('demo.jpg')
img1=io.imread("binary_image.jpg")
plt.subplot(121)
plt.title("RGB")
plt.imshow(img)
plt.subplot(122)
plt.title("Binary")
plt.imshow(img1,cmap='gray')
plt.show()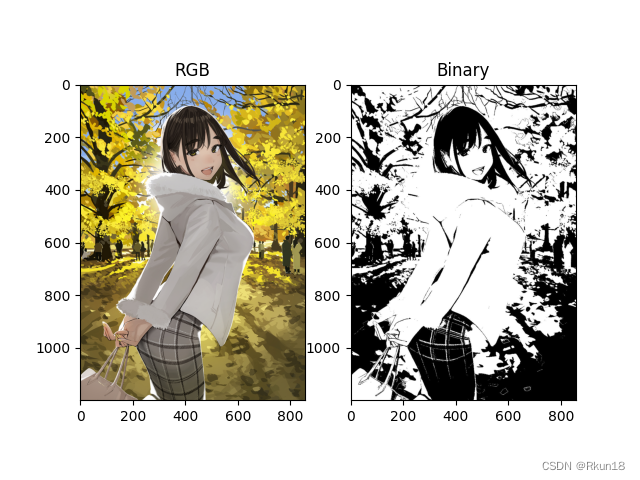
Among them, you can use the rgb2gray function to convert the RGB image into a grayscale image, and then use the threshold_otsu function to binarize the grayscale image for color segmentation.