How to use chatGPT to assist in developing a complex D3 chart
First, let’s briefly introduce the implemented form.
Online address: https://2guliang.top/temperature/timeChat
introduction
What is D3
D3 (Data-Driven Documents) is a data-driven JavaScript library for creating interactive data visualization charts. D3 helps us transform data into meaningful graphics that can be interacted with and dynamically updated by the user. D3 can be used to create various types of charts, including line charts, bar charts, scatter plots, maps, and more.
Basic usage
The core of D3 is Selection and Data Binding. Selection sets refer to selecting elements in the document, and data binding refers to associating data with elements. D3 can add, delete, update, etc. elements through selection sets and data binding to achieve interactive data visualization.
Here is a simple D3 code example for creating a line chart with axes:
<!DOCTYPE html>
<html>
  <head>
    <meta charset="utf-8" />
    <title>折线图</title>
    <script src="https://d3js.org/d3.v6.min.js"></script>
  </head>
  <body>
    <button id="update">更新</button>
    <svg width="800" height="400"></svg>
    <script>
      // 定义数据
      var data = [
        {

       date: '2022-01-01', value: 10 },
        {

       date: '2022-02-01', value: 20 },
        {

       date: '2022-03-01', value: 15 },
        {

       date: '2022-04-01', value: 25 },
        {

       date: '2022-05-01', value: 18 },
        {

       date: '2022-06-01', value: 30 },
        {

       date: '2022-07-01', value: 22 },
        {

       date: '2022-08-01', value: 35 },
        {

       date: '2022-09-01', value: 27 },
        {

       date: '2022-10-01', value: 40 },
        {

       date: '2022-11-01', value: 32 },
        {

       date: '2022-12-01', value: 45 },
      ]

      // 创建 SVG 画布
      var svg = d3.select('svg'),
        margin = {

       top: 20, right: 20, bottom: 30, left: 50 },
        width = +svg.attr('width') - margin.left - margin.right,
        height = +svg.attr('height') - margin.top - margin.bottom,
        g = svg
          .append('g')
          .attr(
            'transform',
            'translate(' + margin.left + ',' + margin.top + ')'
          )

      // 定义 x 轴比例尺
      var x = d3.scaleTime().rangeRound([0, width])

      // 定义 y 轴比例尺
      var y = d3.scaleLinear().rangeRound([height, 0])
      // 定义时间格式化函数
      const timeFormat = function name(d) {


        return d3.timeFormat('%m-%d')(d)
      }
      // 定义 x 轴
      var xAxis = d3.axisBottom(x).tickFormat(timeFormat)

      // 定义 y 轴
      var yAxis = d3.axisLeft(y)

      // 定义线条生成器
      var line = d3
        .line()
        .x(function (d) {


          return x(new Date(d.date))
        })
        .y(function (d) {


          return y(d.value)
        })

      // 加载数据
      x.domain(
        d3.extent(data, function (d) {


          return new Date(d.date)
        })
      )
      y.domain([
        0,
        d3.max(data, function (d) {


          return d.value
        }),
      ])

      // 添加 x 轴
      g.append('g')
        .attr('transform', 'translate(0,' + height + ')')
        .call(xAxis)
        .attr('class', 'axis')

      // 添加 y 轴
      g.append('g').call(yAxis).append('text')
      // 添加折线
      g.append('path')
        .datum(data)
        .attr('class', 'line')
        .attr('fill', 'none')
        .attr('stroke', 'green')
        .attr('stroke-width', 1.5)
        .attr('d', line)

      // 添加y轴刻度指示
      g.append('g')
        .attr('class', 'grid')
        .call(d3.axisLeft(y).tickSize(-width).tickFormat('').ticks(5))

      // 添加标题
      svg
        .append('text')
        .attr('x', (width + margin.left + margin.right) / 2)
        .attr('y', margin.top)
        .attr('text-anchor', 'middle')
        .style('font-size', '20px')
        .text('折线图')

      var zoom = d3
        .zoom()
        .scaleExtent([1, 4])
        .translateExtent([
          [0, 0],
          [width, height],
        ])
        .extent([
          [0, 0],
          [width, height],
        ])
        .on('zoom', zoomed)

      // 将缩放行为应用于SVG画布
      svg.call(zoom)

      function zoomed(event) {


        // 获取缩放比例
        var transform = event.transform

        // 更新 x 轴
        var newX = transform.rescaleX(x)
        g.select('.axis').call(xAxis.scale(newX))

        // 更新折线和折线数据点的位置
        g.select('.line').attr(
          'd',
          line.x(function (d) {


            return newX(new Date(d.date))
          })
        )
        g.selectAll('.dot').attr('cx', function (d) {


          return newX(new Date(d.date))
        })
      }
      document.getElementById('update').addEventListener('click', update)
      function update() {


        // 添加新数据
        data.push({

       date: '2023-03-21', value: 15 })

        // 更新 x 坐标轴比例尺
        x.domain(
          d3.extent(data, function (d) {


            return new Date(d.date)
          })
        )
        g.select('.axis').call(xAxis.scale(x))
        // 更新折线图
        svg
          .select('.line')
          .datum(data)
          .transition()
          .duration(750)
          .attr('d', line)
      }
    </script>
  </body>
</html>
In this example, we use D3 to create an SVG element and draw a scalable line chart with x, y axes. We created a scale with d3.scaleTime()x **d3.scaleLinear**
, y axes using the and methods, and added the axes to the SVG using the and methods. We also created a polyline using the method and added it to the SVG.d3.axisBottom()d3.axisLeft()d3.select()d3.append()d3.line()
How to implement dynamic updates
D3 can dynamically update charts based on changes in data, such as adding new data, deleting data, updating data, etc. Here is an example showing how to dynamically add data and update a line chart:
// 添加新数据
data.push({ date: '2023-03-21', value: 15 })

// 更新 x 坐标轴比例尺
x.domain(
  d3.extent(data, function (d) {
    return new Date(d.date)
  })
)
g.select('.axis').call(xAxis.scale(x))
// 更新折线图
svg
  .select('.line')
  .datum(data)
  .transition()
  .duration(750)
  .attr('d', line)
In this example, we first add a new data point, then update the scale of the x-axis, and finally use the method to d3.select()select the previously drawn line chart, datum()associate data with it using the method, and then update its path properties d.
Requirements introduction
patient timeline

The main functions are
- Scalable timeline
- tooltip display
- Display of point charts and line charts
- Charts can be zoomed in and out through the API
- Updates to chart data
- Boundary case processing such as label text adaptive line wrapping, X-axis time text adaptation, etc.
chatGPT function development
When developing D3 data visualization applications, ChatGPT can provide fast, accurate, and intelligent code tips and suggestions to help developers quickly complete development tasks. The following are some advantages of ChatGPT in developing D3 data visualization applications:
- Intelligent code prompts: ChatGPT can automatically prompt code based on the developer's input content, greatly improving development efficiency.
- Quick question answering: ChatGPT can quickly respond to developers' questions, provide accurate answers, and help developers solve problems.
- Visualization support: ChatGPT can automatically generate charts and data displays based on developers’ input, helping developers quickly understand data structures and visualization methods.
This is
Smart code prompts
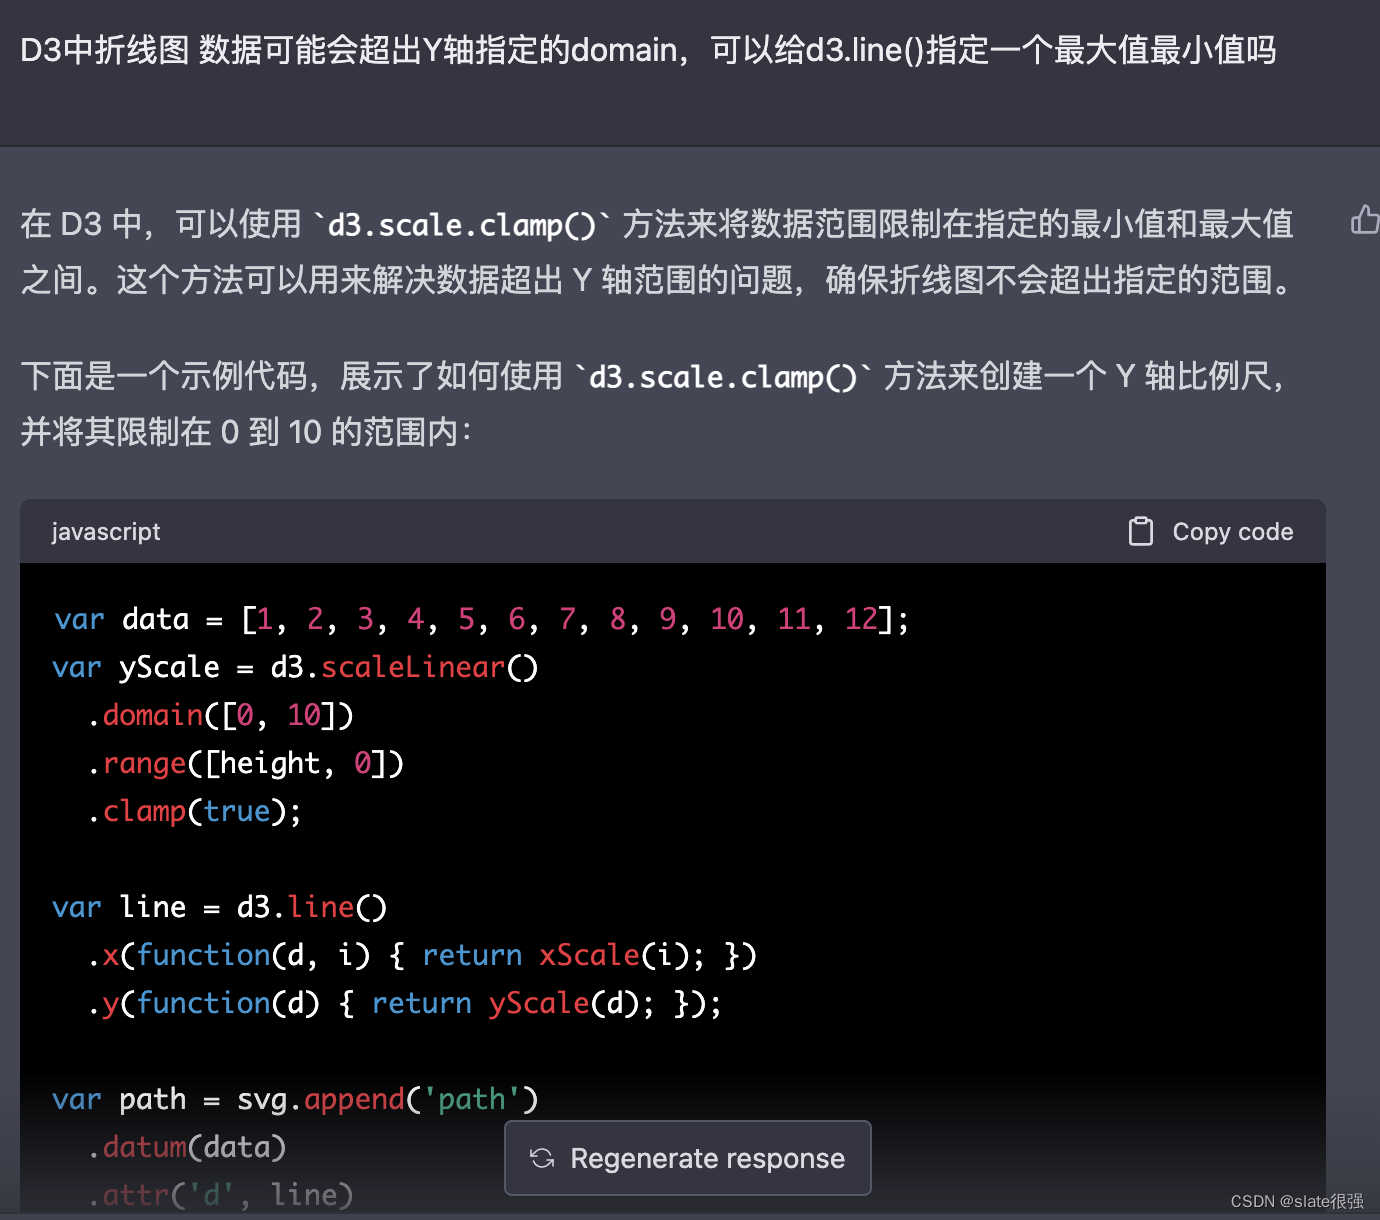
The framework has extensive documentation, and it is impossible for a developer to remember all the API interfaces and function implementations. At this time, you can directly ask in human language chatGPTand let it give the corresponding apiexplanation. as follows:
- The line chart data in D3 may exceed the domain specified by the Y-axis. Can you specify a maximum and minimum value for d3.line()?
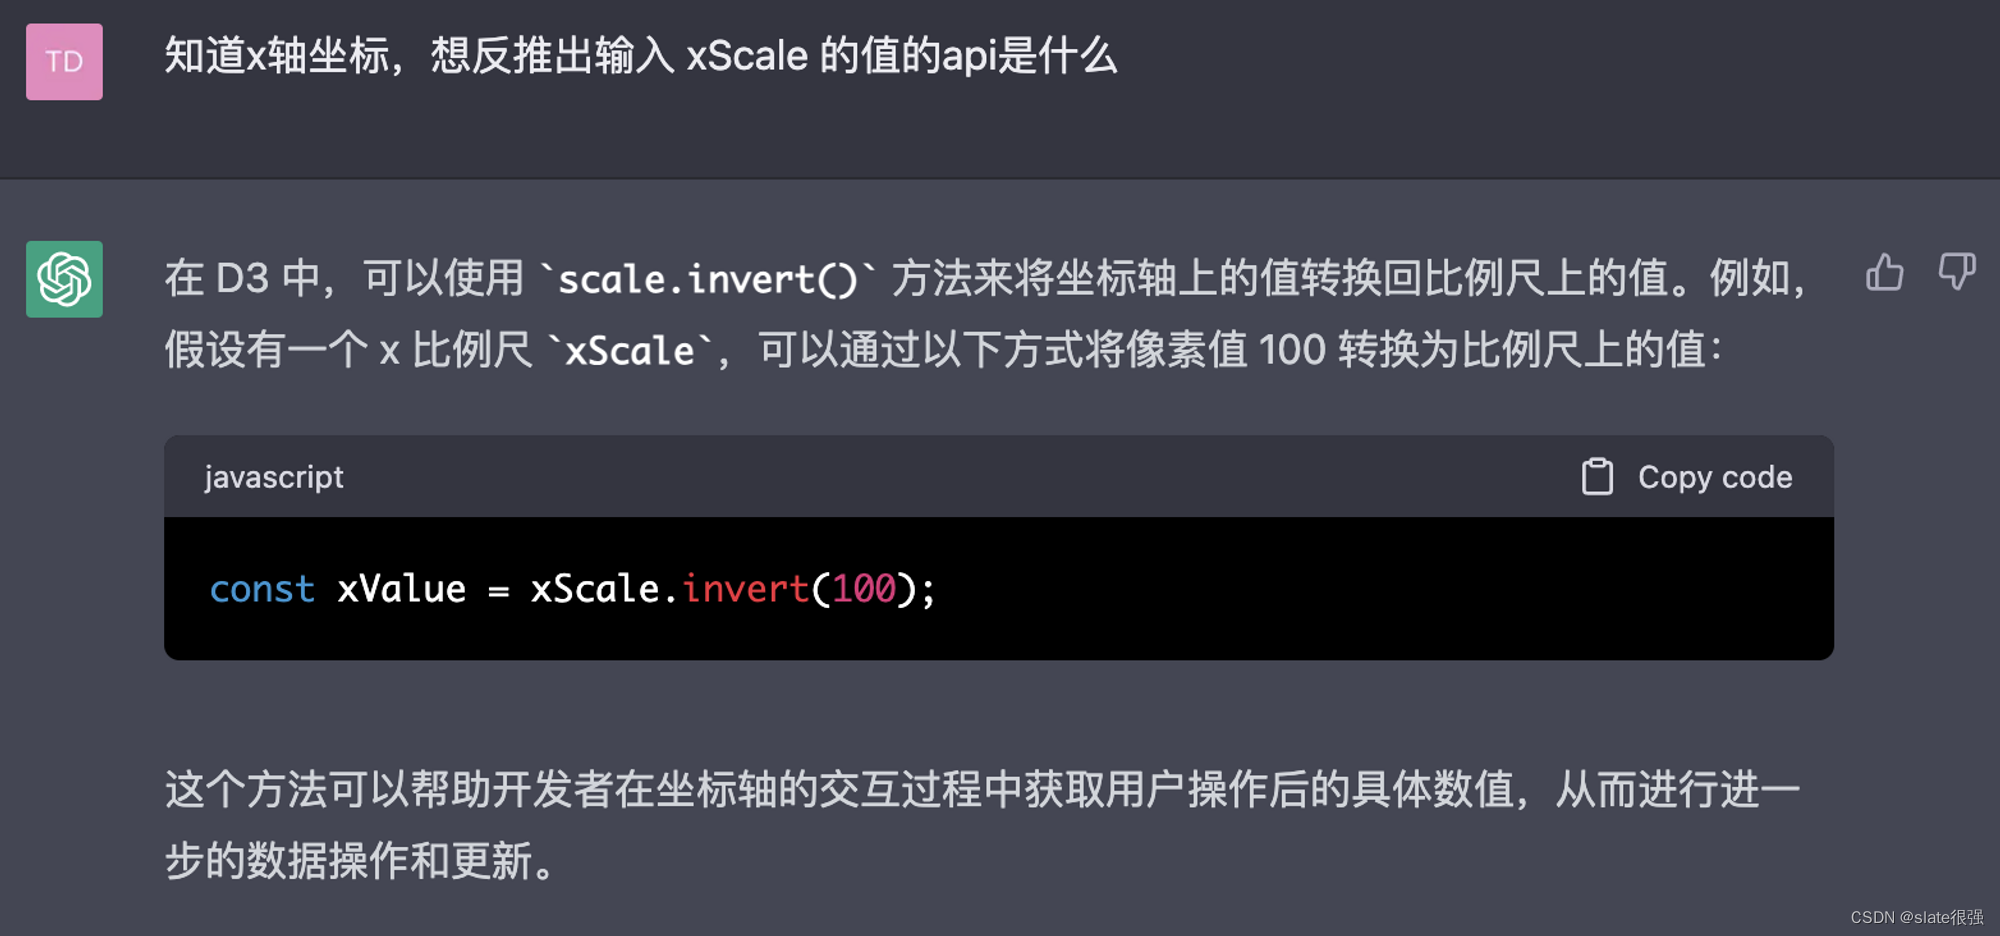
- Knowing the x-axis coordinate, what is the API for deriving the input xScale value?
Quick Q&A
Taking the actual function as an example, during lablethe text display process, the long text will cover the chart, causing the display to be unsightly. How to achieve adaptive line wrapping of text?
In svg, you cannot specify the container width like CSS, so that the text exceeds the automatic line wrapping, and the text will be drawn all the way down according to the x and y point coordinates.
![[The external link image transfer failed. The source site may have an anti-leeching mechanism. It is recommended to save the image and upload it directly (img-RIfWBSNY-1677462843681)(https://s3-us-west-2.amazonaws.com/secure.notion -static.com/3063a6e4-d682-4d1c-a3cb-12d967594ada/Untitled.png)]](https://img-blog.csdnimg.cn/0b149bc5cbb346199afa485deec5e3f3.png)
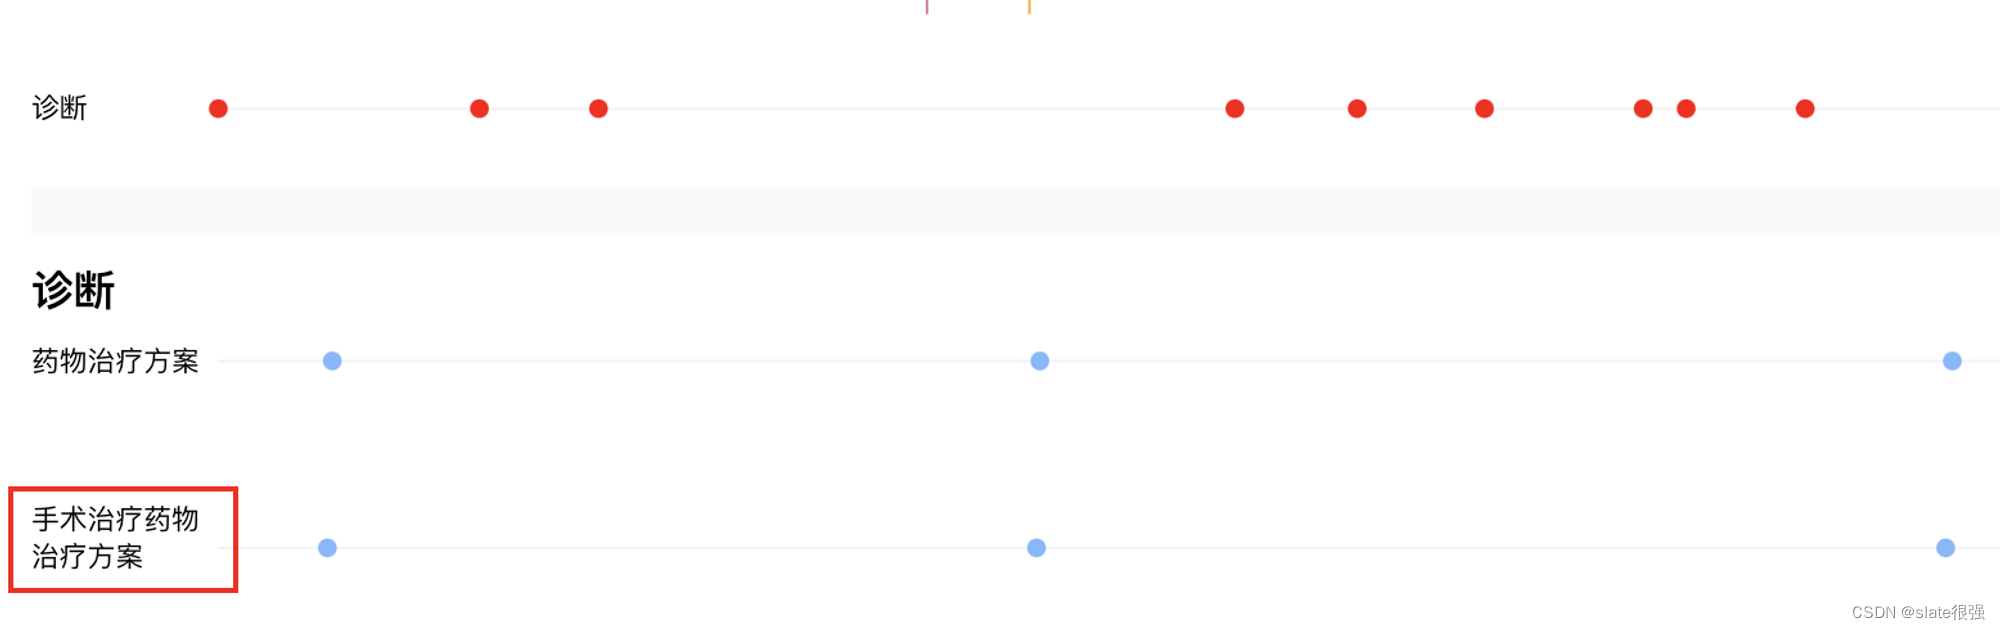
How does D3 control multi-line text to exceed the automatic line wrapping and enable the line-wrapped text to be displayed vertically and centered?
![[External link image transfer failed. The source site may have an anti-leeching mechanism. It is recommended to save the image and upload it directly (img-AT5INAa6-1677462843682)(https://s3-us-west-2.amazonaws.com/secure.notion -static.com/105aa6c5-b395-4536-b309-27b34ba59f98/Untitled.png)]](https://img-blog.csdnimg.cn/930278fdc95c4282800103a8de7fd2c7.png)
![[External link image transfer failed. The source site may have an anti-leeching mechanism. It is recommended to save the image and upload it directly (img-NuSwh9CZ-1677462843682)(https://s3-us-west-2.amazonaws.com/secure.notion -static.com/89637d6e-bb88-4c89-94f4-fd2d6dca6d13/Untitled.png)]](https://img-blog.csdnimg.cn/97dde09793b14f19afc113b0e9f959d1.png)
Finally, with the reference of chatGPT, the line break code is as follows
/**
 * 定义wrap函数,用于将文本自动换行
 * @param {svg select} text
 */
function wrap(text) {
  text.each(function () {
    var text = d3.select(this)
    var words = text.text().split('').reverse()
    var lineHeight = 16
    var width = parseFloat(text.attr('width'))
    var y = parseFloat(text.attr('y'))
    var x = text.attr('x')
    var anchor = text.attr('text-anchor')

    var tspan = text
      .text(null)
      .append('tspan')
      .attr('x', x)
      .attr('y', y)
      .attr('text-anchor', anchor)
    var lineNumber = 0
    var line = []
    var word = words.pop()

    while (word) {
      line.push(word)
      tspan.text(line.join(''))
      if (tspan.node().getComputedTextLength() > width) {
        lineNumber += 1
        line.pop()
        tspan.text(line.join(''))
        line = [word]
        tspan = text
          .append('tspan')
          .attr('x', x)
          .attr('y', y + lineNumber * lineHeight)
          .attr('anchor', anchor)
          .text(word)
      }
      word = words.pop()
    }
    if (lineNumber) {
      d3.select(this).attr(
        'transform',
        'translate(0,' + (-lineNumber * lineHeight) / 2 + ')'
      )
    }
  })
}
The answer given by chatGPT is correct, but some details, such as join('') and split(/\s+/) are wrong. It can be used with slight modifications.