Article directory
0.Preface
Usually when we write code under the Windows operating system, we often write bugs. At this time, we must use the debugging tool of our VS compiler. When we use the gcc compiler on the Linux operating system, when bugs occur, we should How to debug it? Next, let’s learn about the Linux debugger—gdb!
1.gdb debugging
Things to know before class
① There are two ways to publish programs,
debugmode andreleasemode.Linux gcc/g++For compiled binary programs, the defaultreleasemode is to usegdbdebugging. You must add the option when generating binary programs from source code.-g② Generally, executable program files are delivered Products that are tested by testers inreleasemode or released to users do not need to include debugging information, so we need to use-goptions to add debugging information.
The code we wrote in the test.c file is as follows:
#include<stdio.h>
int AddNum(int num)
{


    int sum=0;

    for(int i=0;i<=num;i++)
    {


        sum+=i;
    }

    return sum;
}
int main()
{


    printf("debug begin\n");

    int ret=AddNum(100);

    printf("%d\n",ret);

    printf("debug end\n");

    return 0;
}
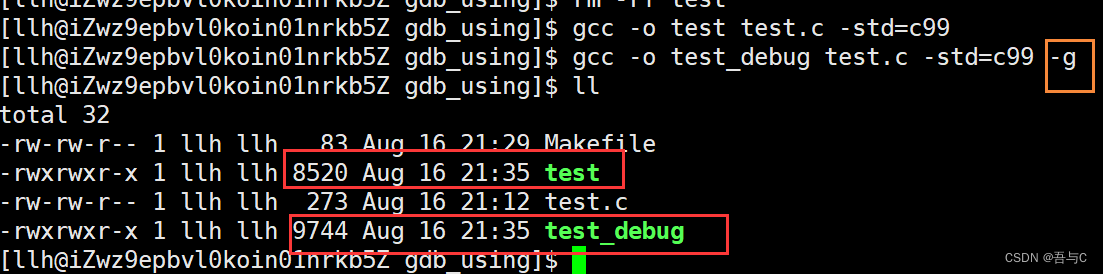
The gcc compilation instructions we use are as follows:
gcc -o test_debug test.c -std=c99 -g
Or we create a Makefile and define the following instructions:
test:test.c
    gcc -o $@ $^ -std=c99 -g
.PHONY:clean
clean:
    rm -rf test_debug
gccIn the compilation instructions, because we use a for loop in the code, which requiresC99the support of the standard library, we need to add-std=c99;-gthe option compiles to generate debugging information, andgdbthe tool can use this information for debugging
. As can be seen from the above, the debugging information cantest_debugbe The executable filetestis larger than the executable program file without debugging information .
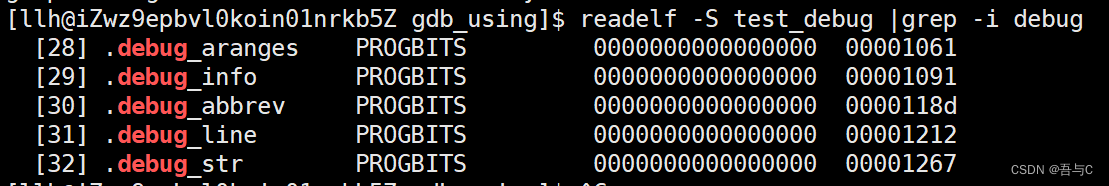
LInux instructions:
readelf -S 可执行文件名 | grep -i debug
//查询可执行文件是否包含调试信息
gdb command
Install using yum:
yum install gdb -y
gdb usage syntax:
gdb 可执行文件名
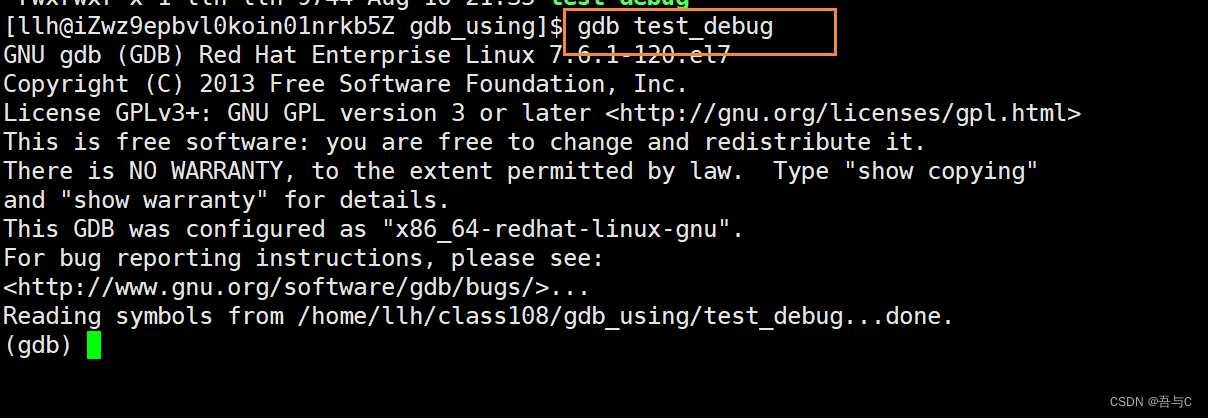
This indicates that we have entered the debugging state, please see the following instructions:
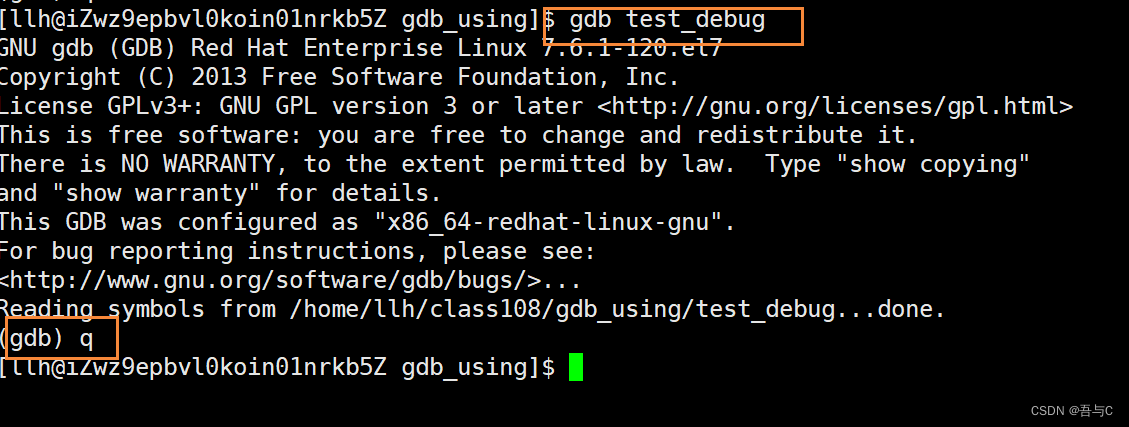
1. Press and hold
ctrl+dthe key orquit(q): to exitgdbdebugging
2.
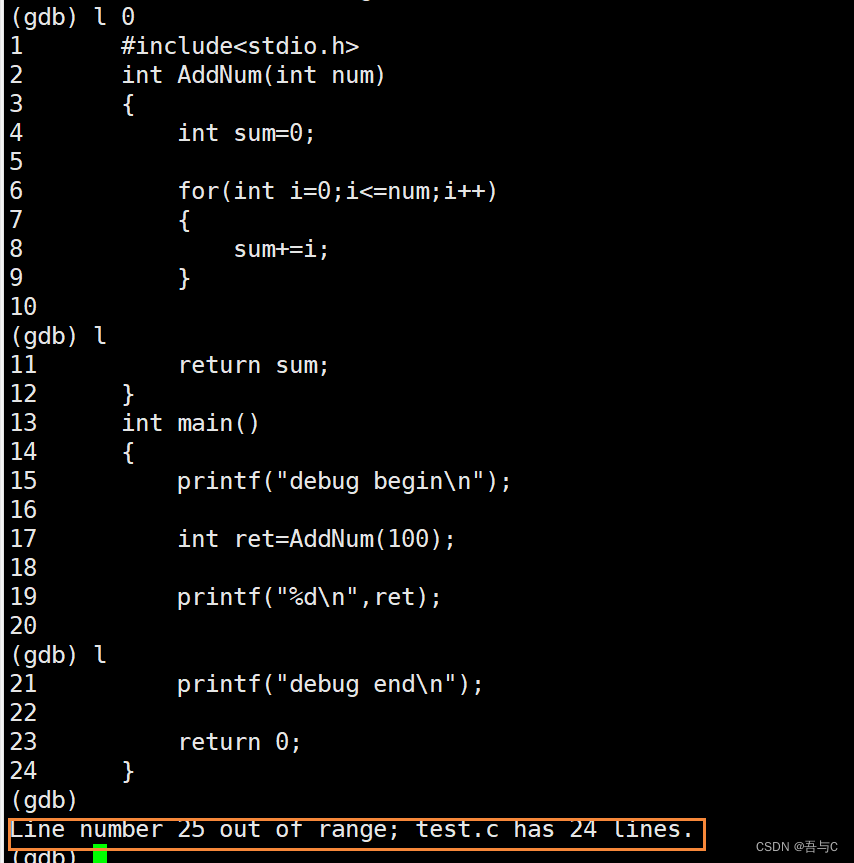
list/lLine number: DisplaybinFilethe source code. Keeplpressing the key to scroll down from the last position, 10 lines at a time, until the end! (Use the Enter key to automatically call the most recent historical commands)
list/l+源文件名:行号. Use this when working with multiple files.
3.
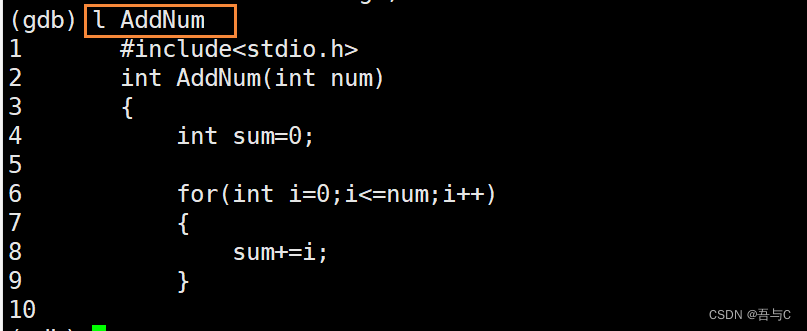
list/lFunction name: List the source code of a function.
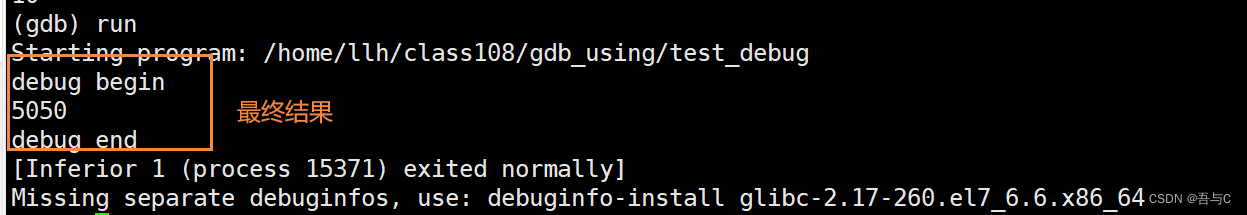
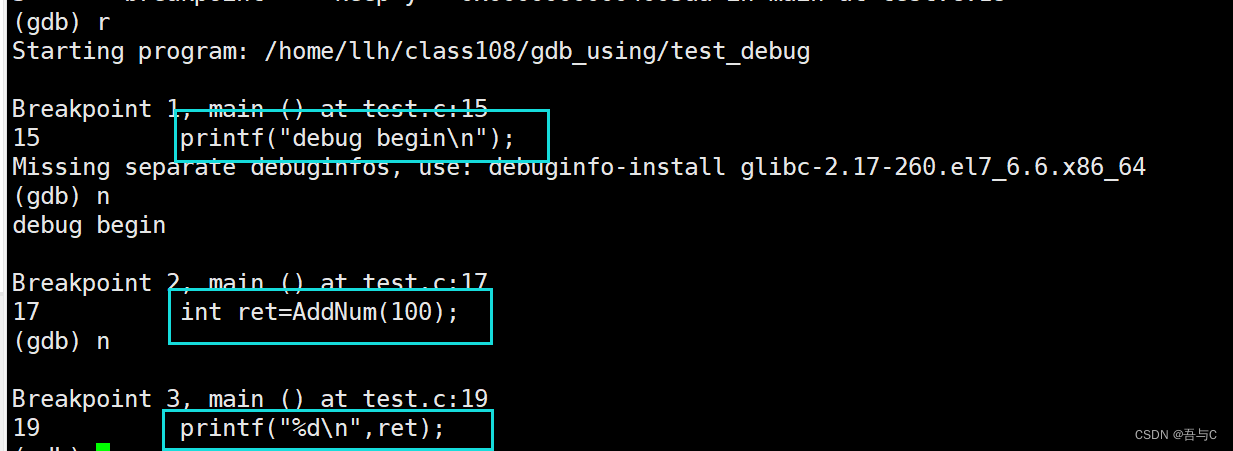
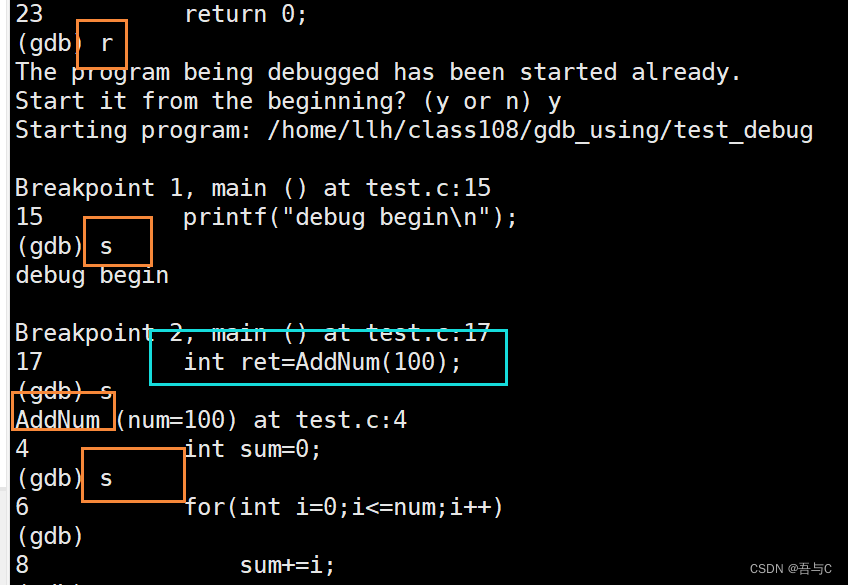
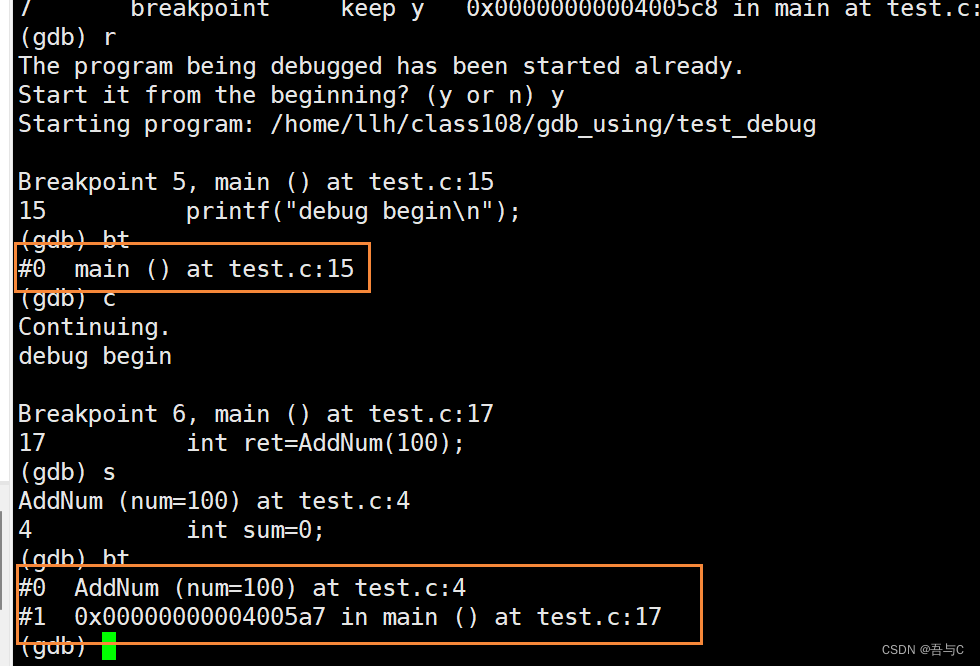
4.:run(或r)Execute the program continuously from the beginning instead of single step
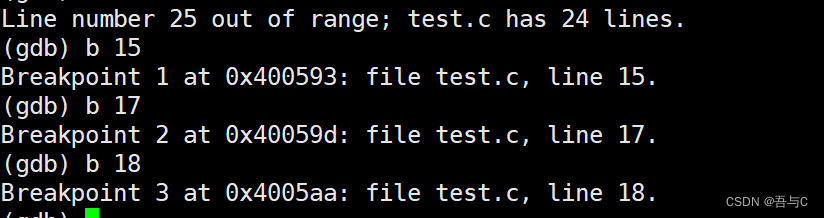
5break(b) 行号.: Set a breakpoint on a certain line
6.
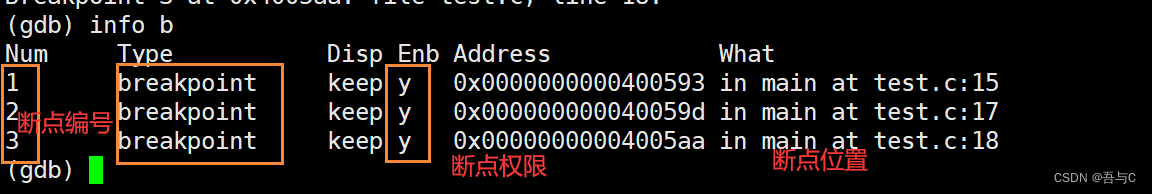
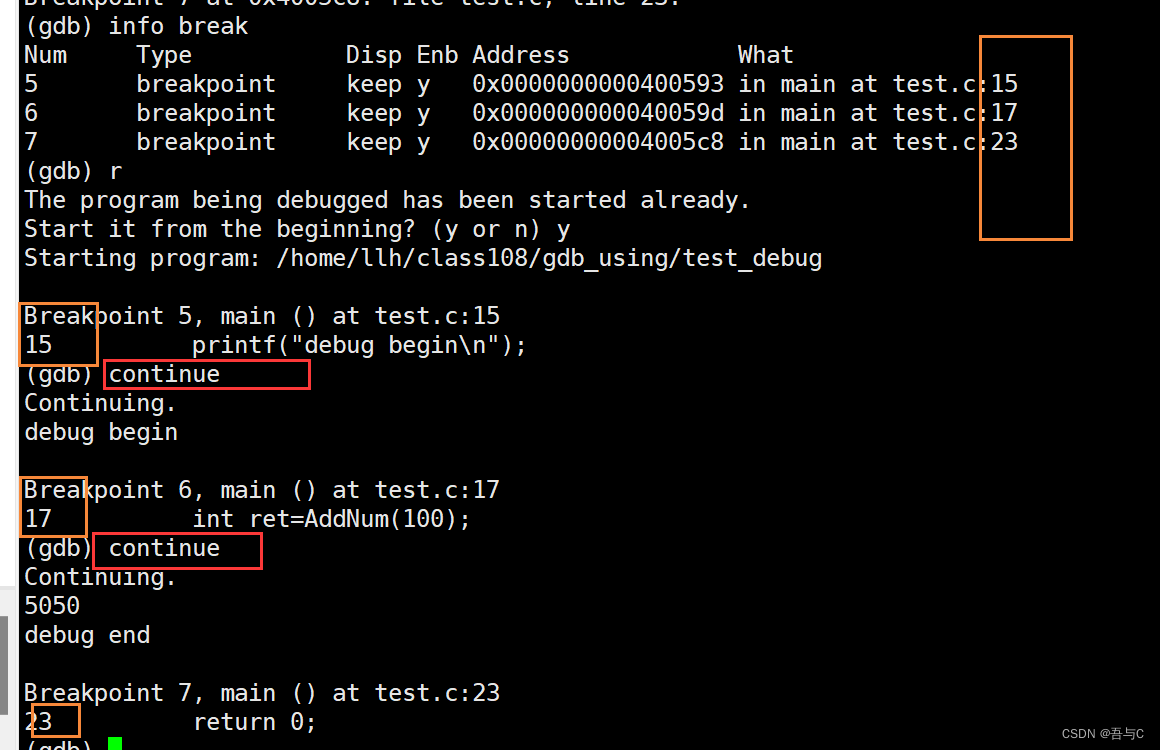
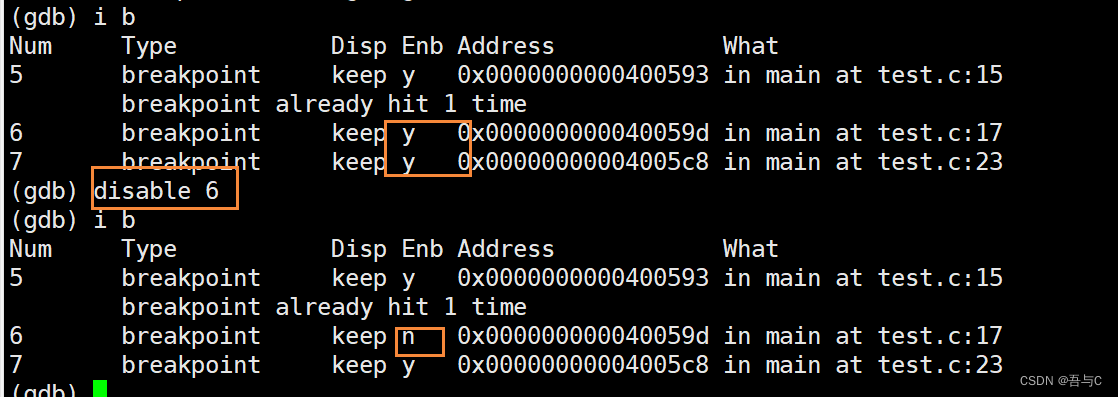
info(或i) break(breakpoints或b): View endpoint information.
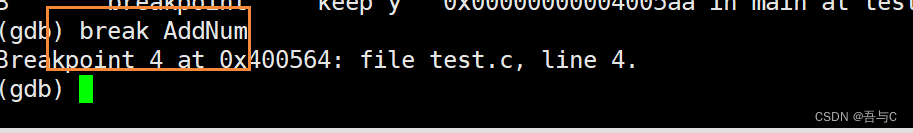
7.:break(或b) 函数名Set a breakpoint at the beginning of a function
8.
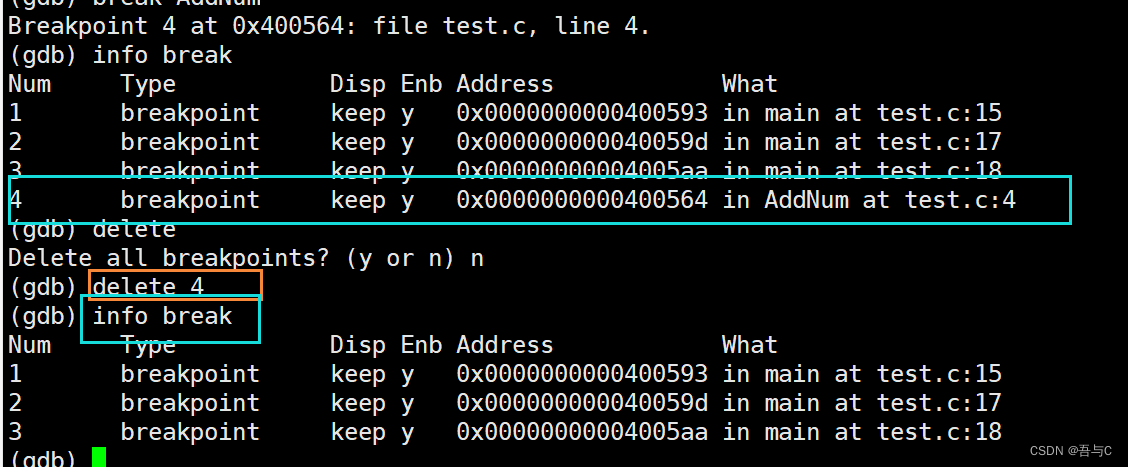
delete(或d) breakpoints(或b):Delete all breakpoints.
delete breakpoints n:Delete the breakpoint with breakpoint number n.
9n 或 next.: Single execution, do not enter the function (execution step by step)
10.:
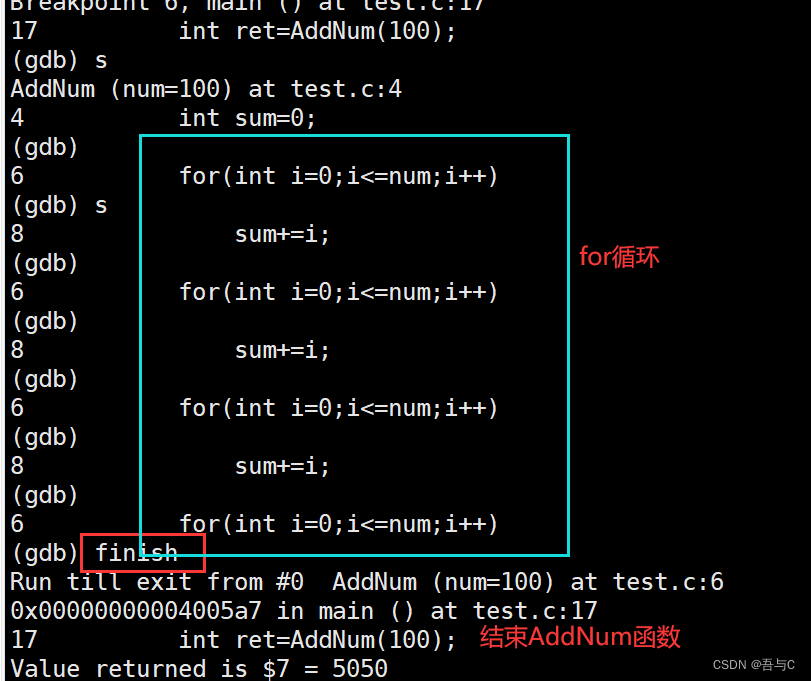
step(或s)Enter the function call and execute the statement step by step
. 11.:continue(或c)Execute the program continuously from the current position instead of single step, and can run from one endpoint to the next endpoint.
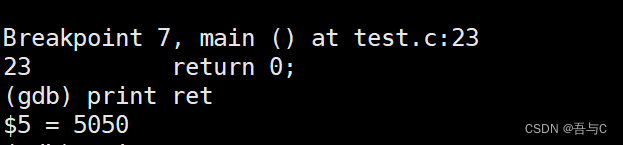
12.:print(或p)Print the value of the expression. You can modify the value of the variable or call the function through the expression
p +变量/地址: print the variable value/address value.
13.finish:Execute until the current function returns, and then wait for the command.
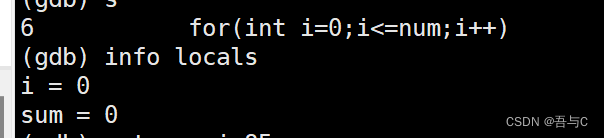
14.info(i) locals: View the value of the local variable of the current stack frame
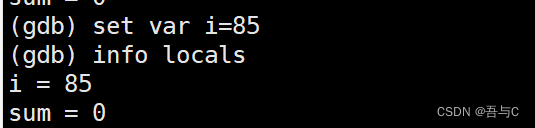
15.set var+修改的值: Modify the value of the variable
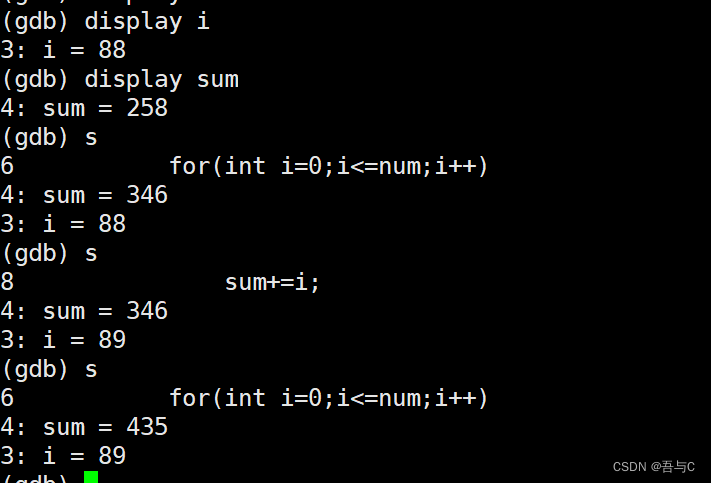
16.display 变量名: Track and view a variable, and display its value every time you stop
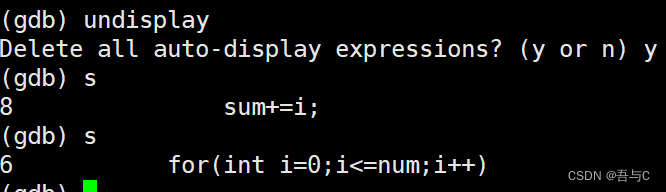
17.undisplay:Cancel tracking of those variables that were previously set
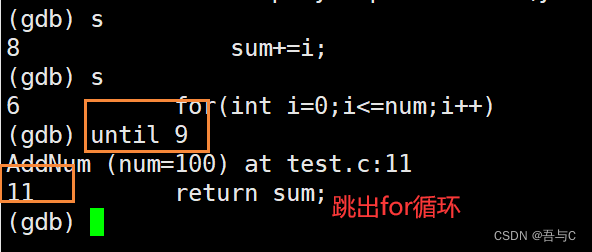
18.until X行号: Jump To line X, if line X is a blank line, it will jump to the next valid line!
19. disable breakpoints(端点编号):Disable breakpoints. The breakpoints still exist but the endpoints no longer work.
20.
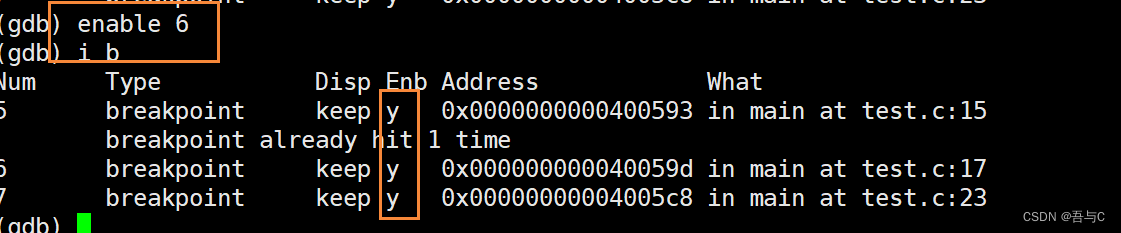
enable breakpoints:Enable breakpoints
21.
breaktrace(或bt): View function calls and parameters at all levels, that is, function call stack information.
2. Summary
Through the above learning, we can find that Linuxsystem gcccompiler gdbdebugging is similar to windowssystem compiler debugging:VS
Command 1:
run---ctrl+F5执行程序
Command 2:break---F9打断点
Command 3:delete+断点编号---F9+光标指定行数,取消指定行数断点
Command 4:delete+break(breakpoints)---ctrl+shift+F9,取消所有断点
Command 5:finish---shfit+F11跳出执行当前执行点所处函数的剩余行
Command 6:quit---shift+F5取消调试
Commandnext---F10逐过程调试
7: Command 8:step---F11逐语句调试
Command 9:display+变量---监视窗口