Table of contents
(3). View the current debugging location (where)
(4). Breakpoint (b, info b, d, c, disable, enable)
4. Debug to the next breakpoint
(5). Print variables and arrays (p, display, undisplay)
(6). Statement-by-statement and process-by-process debugging (s, n)
1. Step by statement debugging (step)
2. Debugging step by step (next)
(7). Function (bt, finish, until)
1. View the current stack call
2. Run the current function directly
3. Execute to the specified line
(8). Disassemble (disassemble)
(9). Execute linux commands (shell) on the gdb interface
1. Preparations
First, we need to compile the file to a debug version . Because under the Linux system, the executable program generated by default is the release version, but the debug version is required for debugging.
We need to add the qualifier -g after the gcc or g++ command. The program generated in this way is the debug version.
The way is as follows:
gcc/g++ -g test.c/test.cpp -o test
2. Debug command
* gdp will automatically record the latest command, if you do not enter other commands, you can press the enter key to continue to execute the latest command.
(1). View code content (l)
The l command is used to view the code content. Use as
l Line number Generate 10 lines by default. When specifying a line number, a total of 10 lines of code will be generated with the specified line number as the middle
When no line number is specified by default:
(gdb) l
1	#include<iomanip>
2	#include<stdio.h>
3	#include<string.h>
4	#include<iostream>
5	#include<stdlib.h>
6	#include<unistd.h>
7	using namespace std;
8	int main()
9	{
10	  char arr[102] = { 0  };
(gdb)
Specify line number:
(gdb) l 10
5	#include<stdlib.h>
6	#include<unistd.h>
7	using namespace std;
8	int main()
9	{
10	  char arr[102] = { 0  };#会以第10行为中心
11	  const char* Lop = "|/-\\";
12	  memset(arr, 0, sizeof(arr));
13	  int i = 0;
14	  for(i = 0; i <= 100; i++)
(gdb)
(2). Start debugging (r)
The r command is used to start code debugging. The usage is as follows:
r Start debugging until the program ends or a breakpoint is encountered. During debugging, using the r command again will restart debugging.
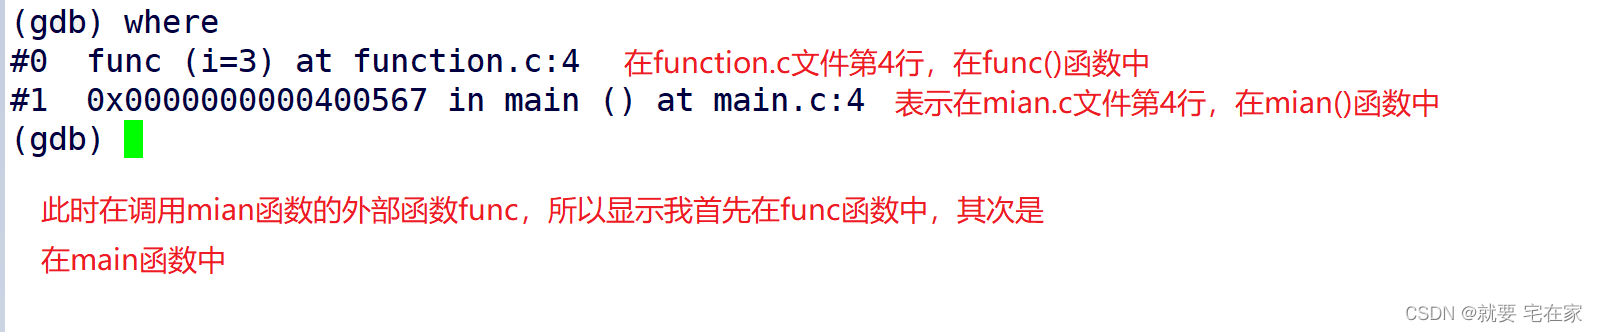
(3). View the current debugging location (where)
where to view the execution location at this time
(4). Breakpoint (b, info b, d, c, disable, enable)
1. Interrupt point
b line number to break at the specified line
2. Show breakpoints
info b Display all breakpoint information , you can also add a number after b to display the specified breakpoint
(gdb) b 10  #打断点
Breakpoint 3 at 0x400ac8: file cdl.cpp, line 10.
(gdb) b 15
Breakpoint 4 at 0x400b23: file cdl.cpp, line 15.
(gdb) info b  #显示断点
Num     Type           Disp Enb Address            What
3       breakpoint     keep y   0x0000000000400ac8 in main() at cdl.cpp:10
4       breakpoint     keep y   0x0000000000400b23 in main() at cdl.cpp:15
(gdb)
3. Delete the breakpoint
d Breakpoint number Delete the specified breakpoint , if no number is added, all will be deleted
Note that the breakpoint number is not the line number, you can use info to view it.

(gdb) info b
Num     Type           Disp Enb Address            What
5       breakpoint     keep y   0x0000000000400ac8 in main() at cdl.cpp:7
6       breakpoint     keep y   0x0000000000400ac8 in main() at cdl.cpp:10
7       breakpoint     keep y   0x0000000000400b23 in main() at cdl.cpp:15
8       breakpoint     keep y   0x0000000000400b39 in main() at cdl.cpp:17
(gdb) d 5   #删除指定断点
(gdb) d     #删除全部断点
Delete all breakpoints? (y or n) y
(gdb) info b
No breakpoints or watchpoints.
(gdb)
4. Debug to the next breakpoint
c Execute directly from the current debugging position to the next breakpoint
#断点为10、17、18行
Num     Type           Disp Enb Address            What
1       breakpoint     keep y   0x0000000000400ac8 in main() at cdl.cpp:10
2       breakpoint     keep y   0x0000000000400b39 in main() at cdl.cpp:17
3       breakpoint     keep y   0x0000000000400c04 in main() at cdl.cpp:20
(gdb) r  #执行到第10行暂停

Breakpoint 1, main () at cdl.cpp:10
10	  char arr[102] = { 0  };
(gdb) c   #执行到第17行暂停
Continuing.

Breakpoint 3, main () at cdl.cpp:17
17	    cout << '[' << setw(100) << arr << ']' << '[' << i << '%' << ']' << Lop[i % 4] << '\r';
(gdb)
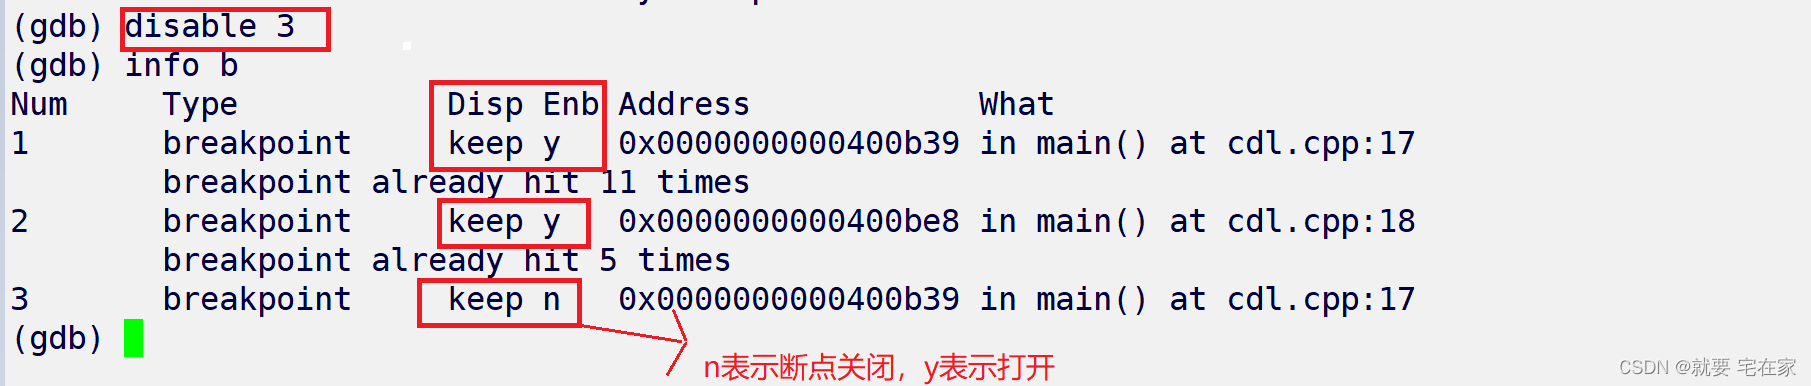
5. Close the breakpoint
disable breakpoint number disable breakpoint
Note that closing a breakpoint does not delete the breakpoint. It's just that it won't pause there when debugging, but the breakpoint still exists.
Use info b to see whether the breakpoint is closed or not.
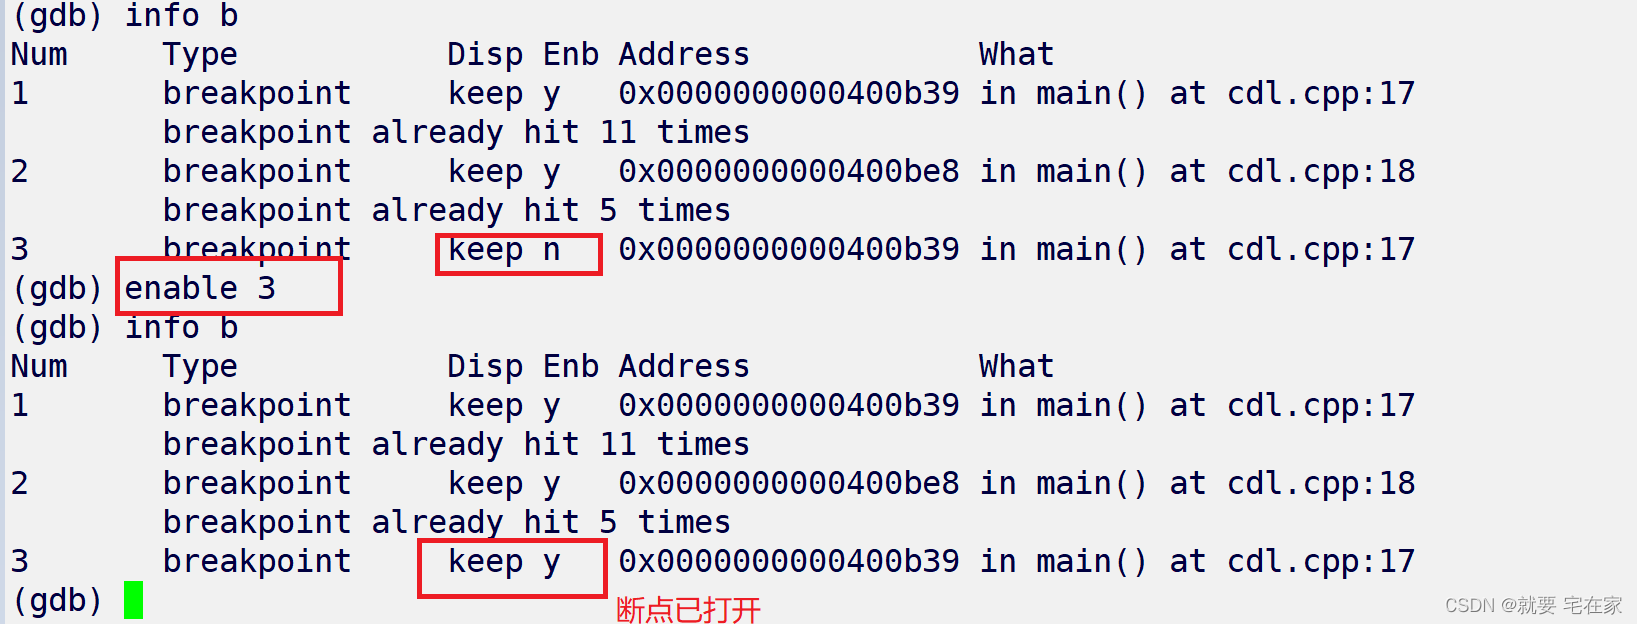
 6. Open the breakpoint
enable variable number Turn on breakpoint
Similarly, the command needs to input the breakpoint number
(5). Print variables and arrays (p, display, undisplay)
1. Print a variable value
p variable Print the corresponding variable value, print the address and directly add the address character &
It should be noted that this method can only display the variable value once, and the variable will no longer be displayed when debugging continues.
(gdb) p i
$5 = 4
(gdb) n
14	  for(i = 0; i <= 100; i++)
(gdb)     #变量i没有再次显示
If we need to print the value of the array, just enter the array name.

2. Often display a variable
If we need to always display the value of a variable during debugging, then the display command is needed.
display variable often displays the value of the specified variable, the usage is consistent with p
(gdb) display arr
3: arr = "---------", '\000' <repeats 92 times>
(gdb) c
Continuing.
[---------                                                                 ][9%]/
Breakpoint 1, main () at cdl.cpp:17
#arr数组常显示
3: arr = "----------", '\000' <repeats 91 times>
(gdb)
3. Delete the often displayed
undisplay Always display the variable number Delete the specified always display variable
It should be noted that the variable name cannot be written directly, and the variable number can be known by using the info display.

(6). Statement-by-statement and process-by-process debugging (s, n)
1. Step by statement debugging (step)
s Debug statement by statement. Equivalent to F11 in vs
2. Debugging step by step (next)
n Debug process by process. Equivalent to F10 in vs
(7). Function (bt, finish, until)
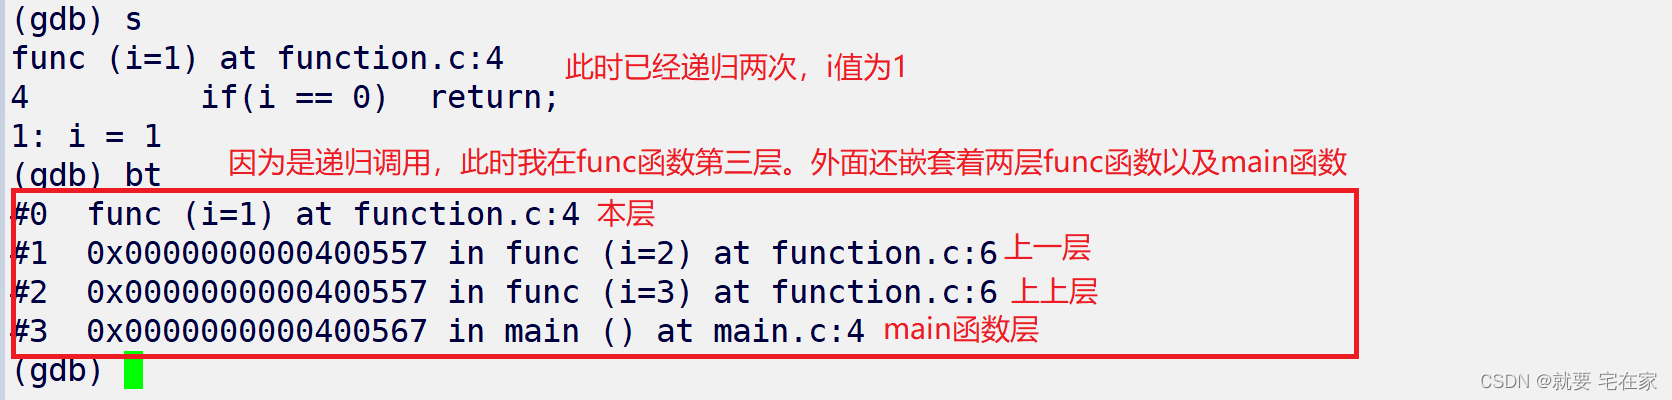
1. View the current stack call
bt view the current stack calls
Mainly used when debugging into a function or recursively calling a function.
Let's take a recursive program as an example:
#include<stdio.h>
void func(int i);
void func(int i)
{
  if(i == 0)  return;
  printf("hello world\n");
  func(i - 1);
}

int main()
  3 {
  4   func(3);
  5   return 0;
  6 }
When we execute until i == 1:
2. Run the current function directly
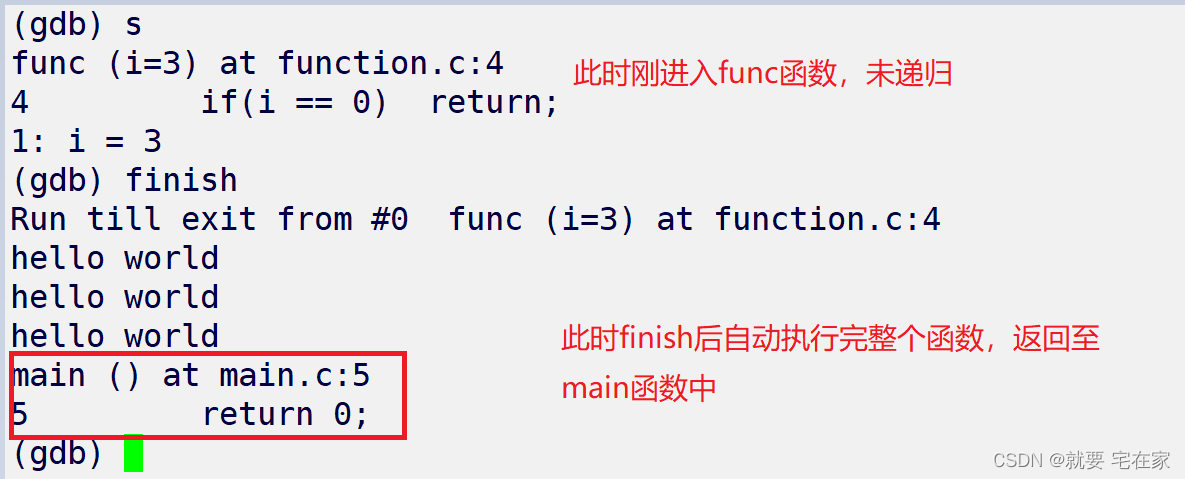
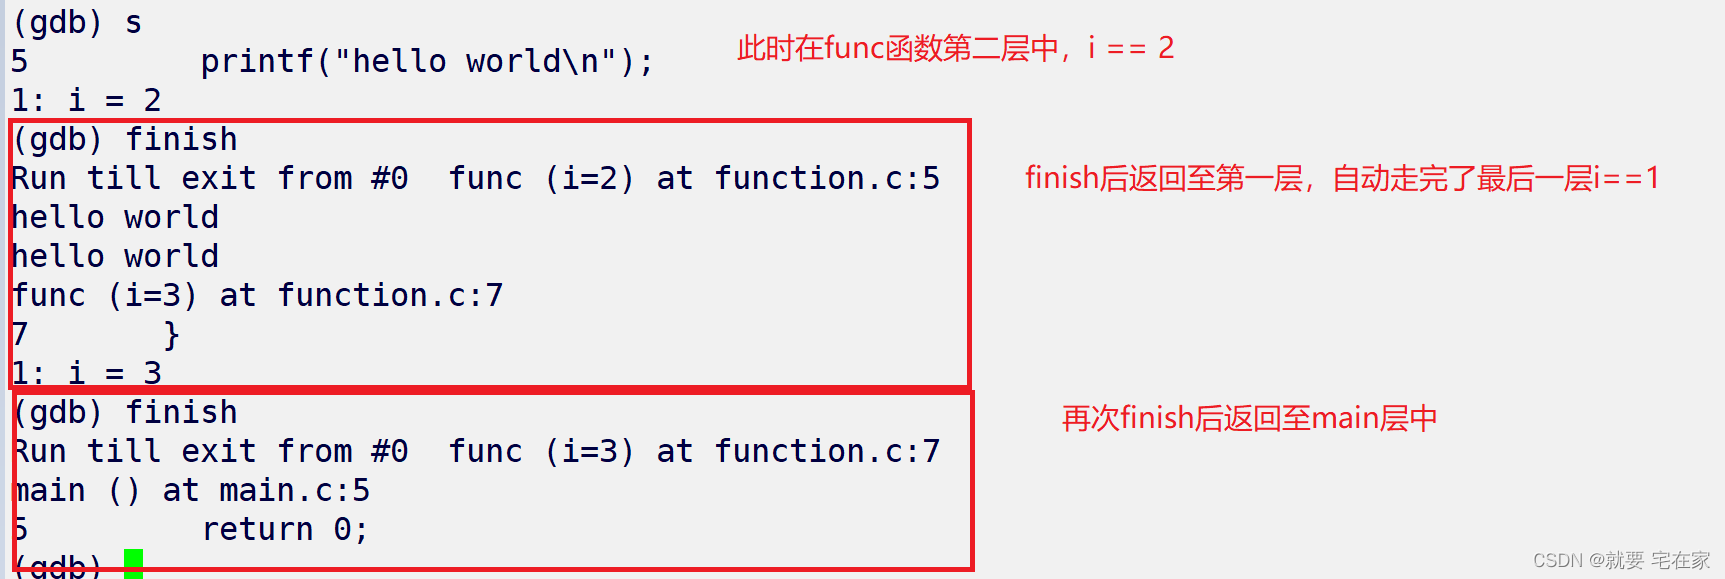
finish can directly finish the current function, if the function has only one layer, it will directly finish the function.
If it is a function recursive call, when the recursion has not started, finish will execute the entire function and automatically complete the entire recursive process (the premise is that there is no breakpoint).
When the recursive call has been made, the recursive finish at which level will return to its previous level.
Let's still take the above recursive program as an example:
 3. Execute to the specified line
until line number Execute to the specified line
1	#include"head.h"
2	 void func(int i)
3	{
4	  if(i == 0)  return;
5	  printf("hello world\n");
6	  func(i-1);
7	}
(gdb) until 5
func (i=3) at function.c:5
5	  printf("hello world\n");
1: i = 3
(gdb)
until can also be used in the main function, but generally until is used for small-scale jumps.
(8). Disassemble (disassemble)
disassemble View the disassembly of the area around the instruction

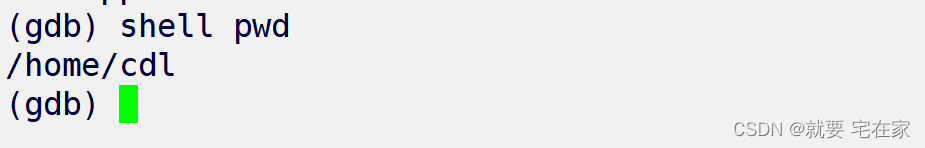
(9). Execute linux commands (shell) on the gdb interface
shell command Execute linux command in gdb interface
(10). Exit gdb (quit)
(gdb) quit
(gdb) quit
A debugging session is active.

	Inferior 1 [process 10341] will be killed.

Quit anyway? (y or n) y
[cdl@VM-16-9-centos ~]$
- "A good programmer crosses a one-way street and checks for traffic in both directions." - Doug Linder
Please correct me if there is any mistake