An article to learn the principle and use of GDB debugging tool
Reference article: https://blog.csdn.net/weixin_55953651/article/details/126908125
1. The principle of GDB debugging tool
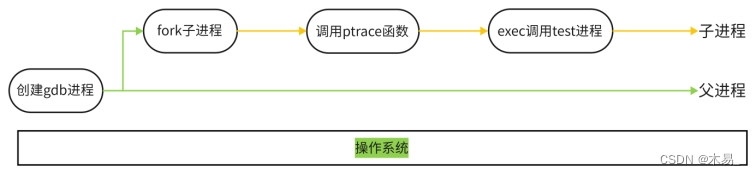
1.1 Process debugging is not performed
When gdb debugging is enabled and gdb ./test is run, many complicated things happen in the operating system. The system will first start the gdb process, which will call the system function fork() to create a child process. This child process does two things matter:
- Call the system function ptrace(PTRACE_TRACEME, [other parameters]);
- The executable program test is loaded and executed through exec, then the test program starts to execute in this sub-process.
1.2 Debugging during execution
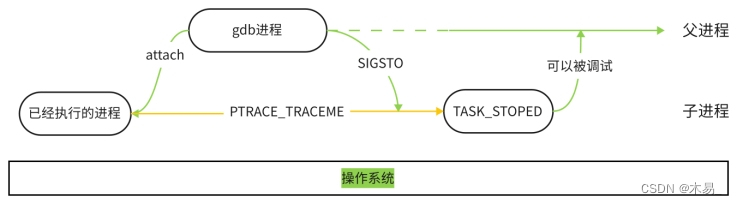
If you want to debug an already executed process, you must call ptrace(PTRACE_ATTACH, [other parameters]) in the parent process of gdb. At this time, the gdb process will attach (bind) to the already executed process B, gdb Adopt process B as its own child process, and the behavior of child process B is equivalent to a PTRACE_TRACEME operation. At this time, the gdb process will send a SIGSTO signal to the child process B. After the child process B receives the SIGSTOP signal, it will suspend execution and enter the TASK_STOPED state, indicating that it is ready to be debugged.
1.3 Introduction to gdb system call prototype
#include <sys/ptrace.h>

long ptrace(enum __ptrace_request request, pid_t pid, void *addr, void *data);
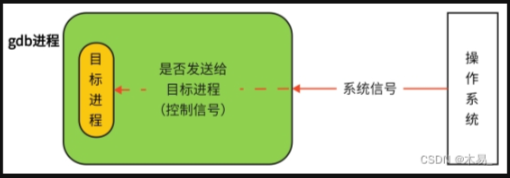
The ptrace system function is a system call provided by the Linux kernel for process tracking. Through it, a process (gdb) can read and write the instruction space, data space, stack and register values of another process (test). Moreover, the gdb process takes over all the signals of the test process, that is to say, all the signals sent by the system to the test process are received by the gdb process. In this way, the execution of the test process is controlled by gdb, so as to achieve the purpose of debugging.
Each parameter is explained below:
enum __ptrace_request request: is an enumerated type used to specify the type of operation to be performed. This parameter tellsptracethe function what kind of tracking operation will be performed on the process, such as read register, write type, which defines a series of constants of the type of tracking request. For example,PTRACE_ATTACHmeans to attach to a new process,PTRACE_GETREGSmeans to get register value. The main types of requests are as follows:
PTRACE_TRACEME:用于将当前进程标记为被跟踪的目标。调用进程使用这个类型请求后,它的父进程可以使用 PTRACE_ATTACH 来附加到它,对其进行调试和跟踪。
PTRACE_ATTACH:用于将一个进程附加到另一个进程上进行调试和跟踪。调试器进程可以使用这个类型请求,通过指定目标进程ID来附加到目标进程。
PTRACE_DETACH:用于从一个已经被附加和调试的进程上分离调试器。这个请求会停止对目标进程的跟踪,并将其恢复为正常运行状态。
PTRACE_PEEKDATA:用于从目标进程的内存中读取数据。可以使用该请求来读取目标进程的内存值,例如寄存器、栈帧等。
PTRACE_POKEDATA:用于向目标进程的内存中写入数据。可以使用该请求来修改目标进程的内存值,例如修改寄存器、改变变量值等。
PTRACE_GETREGS:用于获取目标进程的寄存器值。通过这个请求,可以获得目标进程的 CPU 寄存器的当前值,用于调试和跟踪。
PTRACE_SETREGS:用于设置目标进程的寄存器值。通过这个请求,可以将特定的寄存器值设置为目标进程中的特定值。
PTRACE_CONT:用于继续执行已附加的目标进程。调试器进程可以使用这个请求来继续目标进程的执行,直到下一个断点或者其他事件触发。
pid_t pid: It is an integer type, indicating the process ID (PID) of the target process to be operated.pidSpecifies which process to track, which can be the current process, other running processes or child processes, etc.void *addr: It is a pointer type, used to specify the memory address, and the specific use depends on differentrequestparameters. For example, for some requests to read and write memory,addrthe memory address to be read or written is specified.void *data: It is a pointer type, used to transfer data, and the specific use depends on differentrequestparameters. For some requests to read and write memory or registers,datathe data storage location to be read or written is specified.
ptraceThe function returns a longvalue of type indicating the result of the operation or an error code. Typically, a return value greater than or equal to 0 indicates success, and less than 0 indicates an error occurred.
If there is no gdb debugging, the operating system and the target process interact directly; if gdb is used to debug the program, then the signal sent by the operating system to the target process will be intercepted by gdb, and gdb will decide according to the attribute of the signal: continue to run Whether the target program transfers the currently intercepted signal to the target program, so that the target program performs corresponding actions under the command of the signal sent by gdb.
Second, the use of GDB debugging tools
2.1 Start debugging
Before the program starts debugging, make sure that the program has the following -g option to add debugging information when compiling with gcc and g++
gcc -g test.c -o test
1. Start a program that is not running
To start a program that is not running, just use the following command in the corresponding program directory
gdb test
2. Debug the program process that has started running
To debug a running program process, first use the top command to view the pid of the running program process as follows:
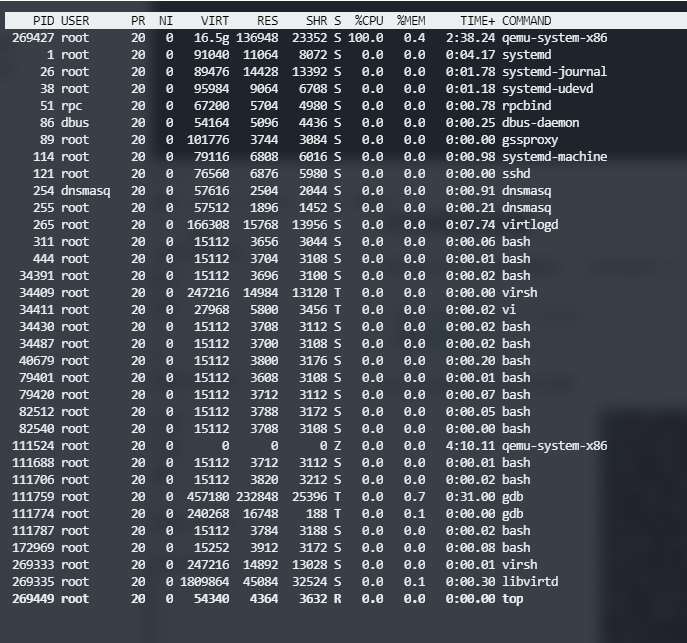
For example, the pid of the program qemu-system-x86 I want to load is 269427, then use the following command to attach the process to GDB debugging
gdb attach 269427#gdb attach [进程号]
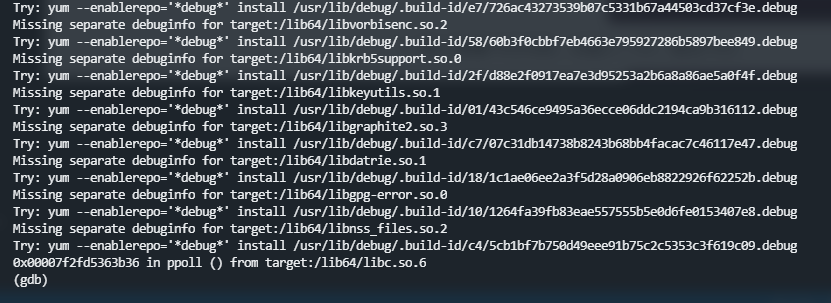
Or open gdb first, and enter attach 269427 in gdb. The effect is as follows
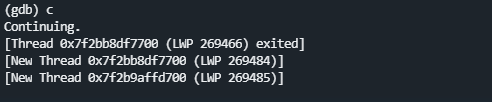
At this time, the program is in a paused state, use the following command to make the program continue to run
#前面是缩写,#后是全写,两者皆可
(gdb) c#continue
The effect is as follows:
2.2 Breakpoint Management
add breakpoint
- method one
#源程序只有一个文件
b [行号]#break [行号]
- Method Two
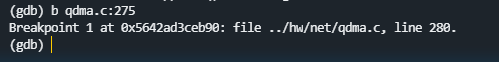
#源程序多个个文件
b [文件名.c]:[行号]#break [文件名.c]:[行号]
After adding a breakpoint it looks like this:
view all breakpoints
info b#info break
The effect is as follows:
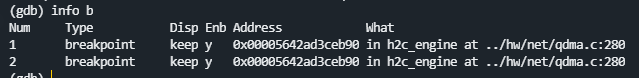
We can see all breakpoints and breakpoint numbers
delete breakpoint
delete#删除所有断点
delete [断点编号]#删除指定断点
2.3 Interrupting Debug Execution
s#step 单步执行,进入函数调用
n#next 逐行执行当前线程的代码,不进入函数调用
c#continue 执行代码到下一个断点
f#finish 执行完当前函数并跳出
ignore [断点号] [次数]#设置或修改运行时断点的忽略计数
2.4 Operating parameter monitoring
p [变量名]#print [变量名] 输出该变量的值
display [变量名]#调试运行的每一步自动输出该变量的值
bt#显示当前的函数调用堆栈情况
list [行数]#显示当前执行的代码,默认10行
watch [变量名]#设置变量监视点,在变量值改变时暂停程序。

info breakpoints#显示当前已设置的断点列表。
info watchpoints#显示当前已设置的监视点(观察点)列表。
info functions#显示程序中定义的所有函数列表。
info variables#显示程序中定义的所有全局变量和静态变量列表。
info locals#显示当前函数的局部变量信息。
info args#显示当前函数的参数信息。
info threads#显示当前正在运行的所有线程信息。
info registers#显示当前线程的寄存器值。
info frame#显示当前的调用帧信息。
info sharedlibrary#显示加载的共享库信息。
info inferior#显示当前程序的执行状态信息。
info record#显示反复执行的命令数量。
info breakpoints location <address>#显示指定地址上设置的断点信息。
info break <breakpoint_number>#显示指定编号的断点信息。
info line <filename>:<line>#显示指定文件和行号的源代码信息。
2.5 Multi-thread debugging
info thread#命令查看当前线程的信息
info threads#命令查看当前所有线程
frame [栈帧号] #命令切换到指定的栈帧
thread [线程号]#切换到指定线程