1. Introduction to GDB
GDB is: a debugging tool under UNIX and UNIX-like . Perhaps, you prefer the graphical interface method, such as VC, BCB and other IDE debugging, but if you are doing software under the UNIX platform, you will find that the advantage of the GDB debugging tool compared with VC and z is that it can repair Functions such as network breakpoints and link recovery are more powerful than BCB's graphical debugger. The so-called "the ruler is short, the inch is long" is the truth.
Two, function
Generally speaking, GDB mainly helps you complete the following four functions:
1. Start your program, and you can run the program as you like according to your custom requirements.
2. Allow the program being debugged to stop at the breakpoint you specify. (Breakpoints can be conditional expressions )
3. When the program is stopped, you can check what happened in your program at this time.
4. You can change your program to correct the impact of a BUG to test other BUGs.
3. Manual
When using GDB to debug a program, there are two points to note:
1. To use GDB to debug a program, the program must be compiled with the compile option -g, otherwise the program does not contain debugging information;
2. The GCC compiler supports -O and -g to participate in compilation together.
1. GDB debugging mainly has three methods:
- Debug the target program directly: gdb ./hello_server
- Attach process id: gdb attach pid
- Debug core file: gdb filename corename
2. Exit GDB
- You can use the command: q (abbreviation for quit) or Ctr + d to exit GDB.
- If GDB attaches a process, use the command detach to detach the attached process before exiting GDB.
3. Common commands
Frequently used commands are usually abbreviated.
| command name | command abbreviation | command description |
|---|---|---|
| run | r | run a program to be debugged |
| continue | c | Resume a suspended program |
| next | n | run to the next line |
| step | s | Single-step execution, when encountering a function, it will enter |
| until | u | Run to the specified line and stop |
| finish | fi | End the current calling function and return to the previous calling function |
| return | return | End the current calling function and return the specified value to the previous function call |
| jump | j | Jump the current program execution flow to the specified line or address |
| p | print variable or register value | |
| backtrace | bt | View the call stack of the current thread |
| frame | f | switch to the specified stack of the current calling thread |
| thread | thread | Switch to the specified thread |
| break | b | add breakpoint |
| tbreak | tb | Add a temporary breakpoint |
| delete | d | delete breakpoint |
| enable | enable | enable a breakpoint |
| disable | disable | disable a breakpoint |
| watch | watch | Monitor whether the value of a variable or memory address changes |
| list | l | show source code |
| info | i | View information such as breakpoints/threads |
| ptype | ptype | View variable type |
| disassemble | dis | View assembly code |
| set args | set args | Set program startup command line parameters |
| show args | show args | View the command line parameters set |
4. Example of use
1. Use gdb+ program name to directly start GDB debugging
gdb test
2. Use set args to set the startup parameters because there are multiple startup parameters, so it is args
set args parameter1 parameter2 parameter3 ...

3. Use the b command to break the point
b avformat_find_stream_info (directly hit the function name breakpoint)
b 2440 (hit the specified line number breakpoint in the current file)
b main (set a breakpoint at the main function)

The b command will automatically find the corresponding function name, and tell you how many lines in which file to set a breakpoint
4. Use the r command to run the program
r (the program will run to the breakpoint)
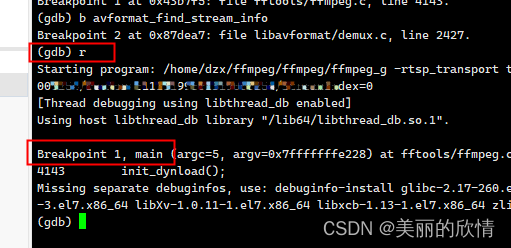
Run to the first breakpoint Breakpoint 1
5. Use the c command to run to the next breakpoint
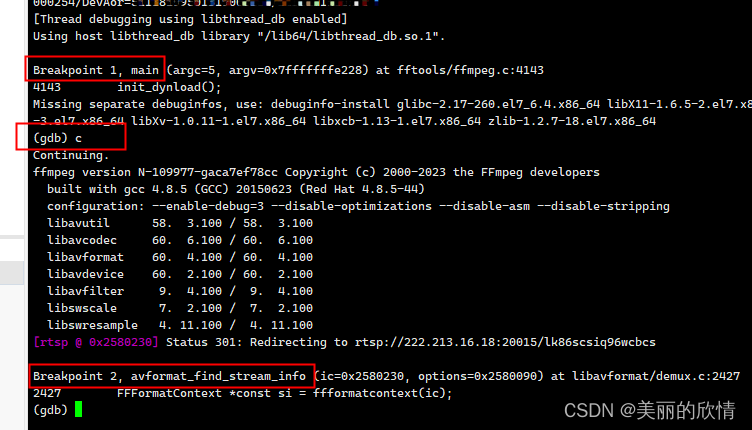
Breakpoint 2, avformat_find_stream_info
6. Use the s and n commands to execute step by step or to the next line
s
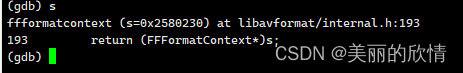
n

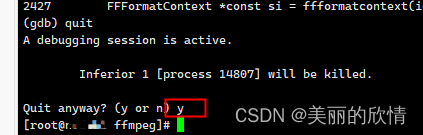
7. Use quit to exit GDB debugging
(If the GDB program is running, use ctrl+C to interrupt)
quit
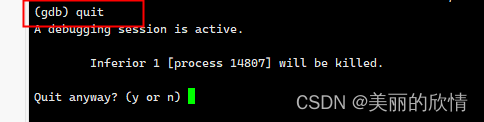
The program is exited by kill, enter y (yes) to exit GDB debugging!
That's it.
If you find it useful, remember to like and collect + follow. thanks thanks