The resource monitoring system is an essential component of the container orchestration system and one of the cores of service governance. Prometheus is essentially an open source service monitoring system and time series database. It is the second project started by CNCF and has become the core of the monitoring system in the Kubernetes ecosystem .

The core component of Prometheus, the Prometheus server, periodically pulls monitoring indicator data (Metrics) from statically configured monitoring objects or automatically configured targets based on service discovery, and then persists them into TSDB.
Each monitored target can provide an interface to output monitoring indicator data through a dedicated exporter program, and wait for the Prometheus server to periodically pull it.
- The monitoring data of the host machine is collected by node_exporter, such as the average load of a single node, CPU, memory, disk, network and so on.
- kubelet (cAdvisor): collect container indicator data, CPU usage and quota, memory usage and quota, network packet sending/receiving/discarding rate, etc.
- API server: Collect API server performance index data, including Controller work queue length, requested QPS and delay time, etcd cache work queue and cache performance.
- etcd: Collect related indicator data of etcd storage cluster, including leader node and domain change rate, number of submitted/applied/suspended/wrong proposals, disk write performance, network and grpc counters, etc.
Metrics Server Deployment
The core monitoring data of Kubernetes needs to be obtained through the /apis/metrics.k8s.io/ path of the API server. This API is only available after the Metrics Server application is deployed.
Metrics Server is an aggregator of resource utilization data at the cluster level and directly replaces the Heapster project. The Metrics Server is not part of the API server, but is registered on the main API server through the Aggregator plug-in mechanism, and then collects the metric data of each node based on the kubelet's Summary API, and stores them in the memory and provides them in the format of the metric API.

First clone the warehouse https://github.com/kubernetes-sigs/metrics-server :
$ git clone https://github.com/kubernetes-sigs/metrics-server.git
$ cd ./metrics-server
$ ll ./deploy/1.8+/
total 28
-rw-r--r--. 1 root root  397 Jan 29 19:09 aggregated-metrics-reader.yaml
-rw-r--r--. 1 root root  303 Jan 29 19:09 auth-delegator.yaml
-rw-r--r--. 1 root root  324 Jan 29 19:09 auth-reader.yaml
-rw-r--r--. 1 root root  298 Jan 29 19:09 metrics-apiservice.yaml
-rw-r--r--. 1 root root 1183 Jan 29 19:09 metrics-server-deployment.yaml
-rw-r--r--. 1 root root  297 Jan 29 19:09 metrics-server-service.yaml
-rw-r--r--. 1 root root  532 Jan 29 19:09 resource-reader.yaml
The metrics-server application will obtain the indicator data from the kubelet port 10250 by default based on the HTTP API. If it is not modified, the data may not be obtained normally after the deployment is completed. So we need to manually modify the container startup parameter content of the deploy/1.8+/metrics-server-deployment.yaml file:
args:
  - --cert-dir=/tmp
  - --secure-port=4443
  - --kubelet-insecure-tls
  - --kubelet-preferred-address-types=InternalIP
plus--kubelet-insecure-tls
Then create related resources:
$ kubectl apply -f ./deploy/1.8+/
clusterrole.rbac.authorization.k8s.io/system:aggregated-metrics-reader created
clusterrolebinding.rbac.authorization.k8s.io/metrics-server:system:auth-delegator created
rolebinding.rbac.authorization.k8s.io/metrics-server-auth-reader created
apiservice.apiregistration.k8s.io/v1beta1.metrics.k8s.io created
serviceaccount/metrics-server created
deployment.apps/metrics-server created
service/metrics-server created
clusterrole.rbac.authorization.k8s.io/system:metrics-server created
clusterrolebinding.rbac.authorization.k8s.io/system:metrics-server created
Then confirm that the relevant Pods are running correctly:
$ kubectl get po -n kube-system | grep metrics
metrics-server-694db48df9-6vmn2   1/1     Running   0          3m57s
$ kubectl logs metrics-server-789c77976-w7dzh -n kube-system
I0129 12:33:27.461161       1 serving.go:312] Generated self-signed cert (/tmp/apiserver.crt, /tmp/apiserver.key)
I0129 12:33:27.793251       1 secure_serving.go:116] Serving securely on [::]:4443
Verify that the relevant API group metrics.k8s.io appears in the list of API groups:
$ kubectl api-versions | grep metrics
metrics.k8s.io/v1beta1
Finally check the availability of the resource metrics API:
$ kubectl get --raw "/apis/metrics.k8s.io/v1beta1/nodes" | jq .
{
  "kind": "NodeMetricsList",
  "apiVersion": "metrics.k8s.io/v1beta1",
  "metadata": {
    "selfLink": "/apis/metrics.k8s.io/v1beta1/nodes"
  },
  "items": [
    {
      "metadata": {
        "name": "kube",
        "selfLink": "/apis/metrics.k8s.io/v1beta1/nodes/kube",
        "creationTimestamp": "2020-01-29T12:42:08Z"
      },
      "timestamp": "2020-01-29T12:41:25Z",
      "window": "30s",
      "usage": {
        "cpu": "256439678n",
        "memory": "2220652Ki"
      }
    }
  ]
}
kubectl get --rawThe command can directly specify the API, that is, the URL path.
Prometheus manual deployment
Because the latest version officially separates https://github.com/coreos/prometheus-operator/tree/master/contrib/kube-prometheus into the kube-prometheus project, so the deployment process is divided into two steps:
prometheus-operator deployment
Clone the https://github.com/coreos/prometheus-operator repository:
$ git clone https://github.com/coreos/prometheus-operator.git
$ cd ./prometheus-operator
$ git checkout release-0.35
$ kubectl apply -f bundle.yaml
clusterrolebinding.rbac.authorization.k8s.io/prometheus-operator created
clusterrole.rbac.authorization.k8s.io/prometheus-operator created
deployment.apps/prometheus-operator created
serviceaccount/prometheus-operator created
service/prometheus-operator created
Then confirm that the relevant Pods are running correctly:
$ kubectl get po | grep prometheus-operator
prometheus-operator-79fb6fb57d-hs7hk   1/1     Running   0          104s
Check the relevant CRD resources:
$ kubectl get crd | grep monitoring
alertmanagers.monitoring.coreos.com     2020-01-29T14:55:41Z
podmonitors.monitoring.coreos.com       2020-01-29T14:55:41Z
prometheuses.monitoring.coreos.com      2020-01-29T14:55:41Z
prometheusrules.monitoring.coreos.com   2020-01-29T14:55:41Z
servicemonitors.monitoring.coreos.com   2020-01-29T14:55:41Z
Monitoring Suite Deployment
$ git clone https://github.com/coreos/kube-prometheus.git
$ cd ./kube-prometheus
$ ll manifests/
total 1620
-rw-r--r--. 1 root root     384 Jan 29 18:52 alertmanager-alertmanager.yaml
-rw-r--r--. 1 root root     792 Jan 29 18:52 alertmanager-secret.yaml
-rw-r--r--. 1 root root      96 Jan 29 18:52 alertmanager-serviceAccount.yaml
# ...
Before deploying we need to create a namespace called monitoring kubectl create ns monitoring.
Then create related resources:
$ kubectl apply -f manifests/
alertmanager.monitoring.coreos.com/main created
secret/alertmanager-main created
service/alertmanager-main created
# ...
We can see that many objects are created, including kube-state-metrics, node-exporter, alertmanager, grafana, prometheus.
Then confirm that the relevant Pods are running correctly:
$ kubectl get po -n monitoring
NAME                                  READY   STATUS    RESTARTS   AGE
alertmanager-main-0                   2/2     Running   0          3m29s
alertmanager-main-1                   2/2     Running   0          3m29s
alertmanager-main-2                   2/2     Running   0          3m29s
grafana-76b8d59b9b-2zkfr              1/1     Running   0          3m29s
kube-state-metrics-959876458-kxbwp    3/3     Running   0          3m28s
node-exporter-kt59s                   2/2     Running   0          3m28s
prometheus-adapter-5cd5798d96-xblsg   1/1     Running   0          3m29s
prometheus-k8s-0                      3/3     Running   1          3m29s
prometheus-k8s-1                      3/3     Running   1          3m29s
$ kubectl get svc -n monitoring
NAME                    TYPE        CLUSTER-IP       EXTERNAL-IP   PORT(S)                      AGE
alertmanager-main       ClusterIP   10.103.188.104   <none>        9093/TCP                     8m10s
alertmanager-operated   ClusterIP   None             <none>        9093/TCP,9094/TCP,9094/UDP   8m10s
grafana                 ClusterIP   10.103.137.213   <none>        3000/TCP                     8m9s
kube-state-metrics      ClusterIP   None             <none>        8443/TCP,9443/TCP            8m9s
node-exporter           ClusterIP   None             <none>        9100/TCP                     8m9s
prometheus-adapter      ClusterIP   10.100.219.119   <none>        443/TCP                      8m9s
prometheus-k8s          ClusterIP   10.105.64.90     <none>        9090/TCP                     8m9s
prometheus-operated     ClusterIP   None             <none>        9090/TCP                     8m9s
To access prometheus and grafana outside the cluster, the easiest way is to expose them through NodePort type services:
$ kubectl patch svc prometheus-k8s -n monitoring --patch '{"spec": {"type": "NodePort"}}'
$ kubectl patch svc grafana -n monitoring --patch '{"spec": {"type": "NodePort"}}'
$ kubectl get svc -n monitoring
NAME                    TYPE        CLUSTER-IP       EXTERNAL-IP   PORT(S)                      AGE
grafana                 NodePort    10.103.137.213   <none>        3000:31959/TCP               17m
prometheus-k8s          NodePort    10.105.64.90     <none>        9090:31228/TCP               17m
View the target page of prometheus:
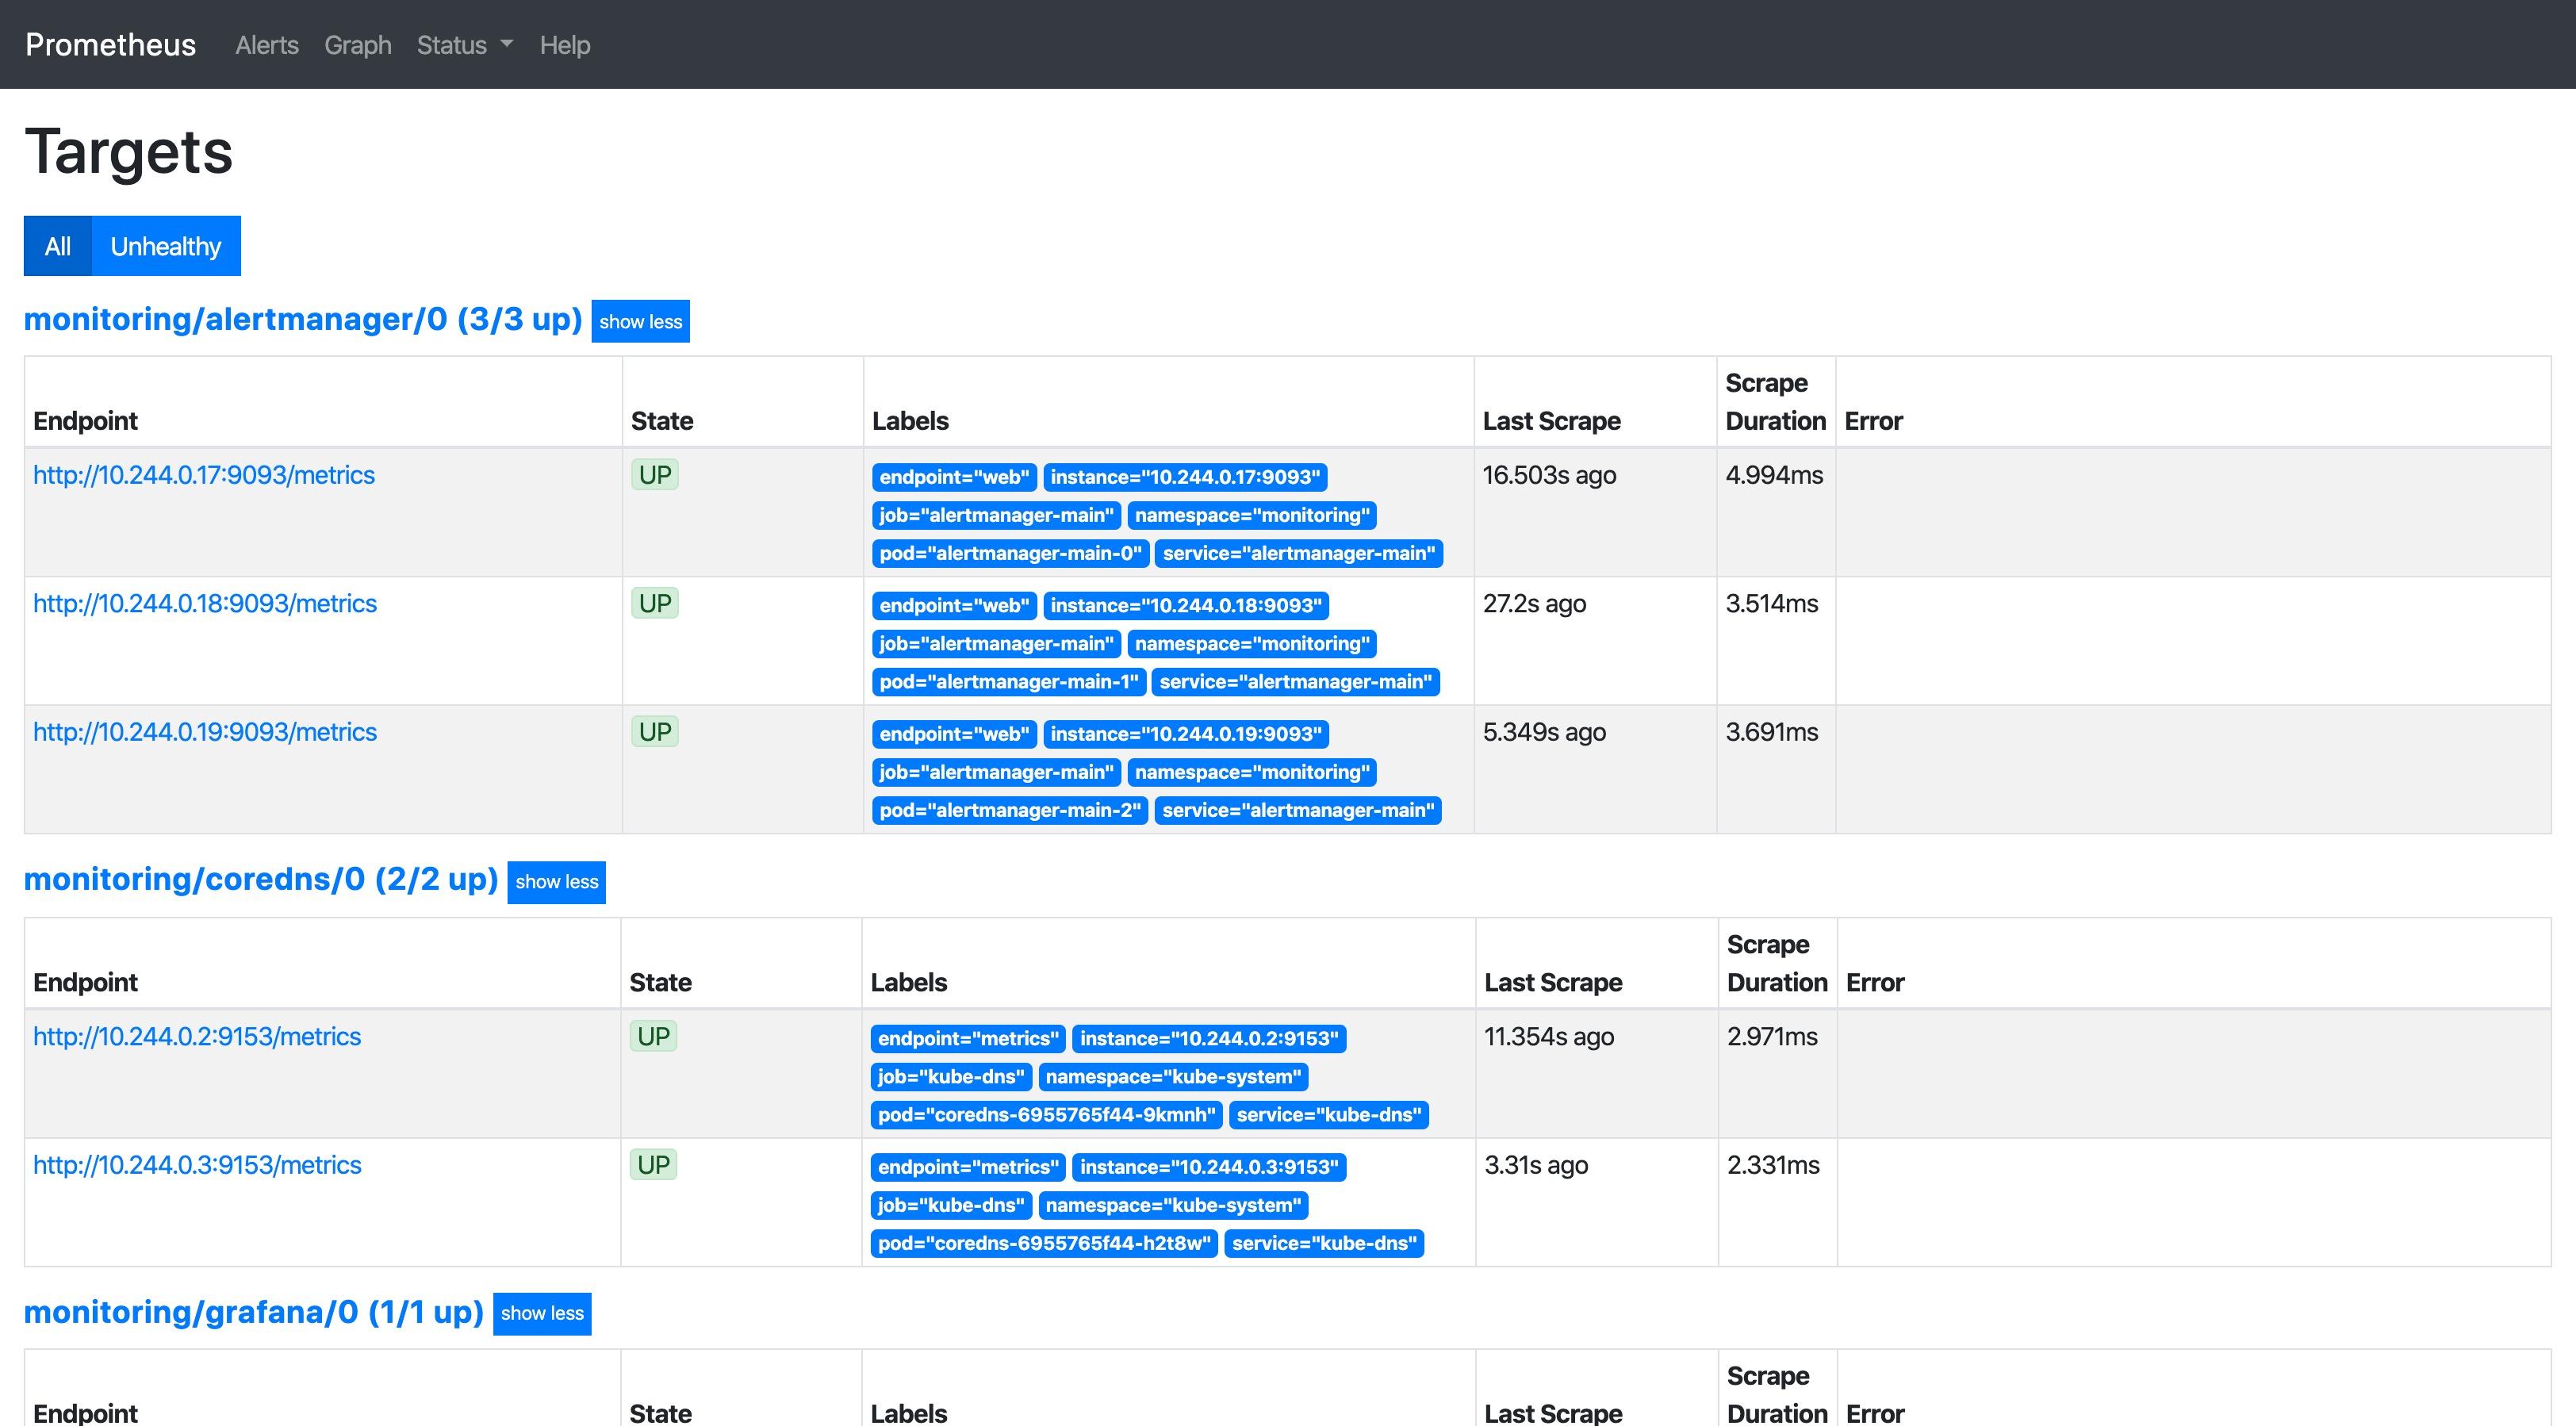
PromQL (Prometheus Query Language) is Prometheus's proprietary data query language (DSL), which provides a concise and natural language syntax to realize the analysis and calculation capabilities of time series data.
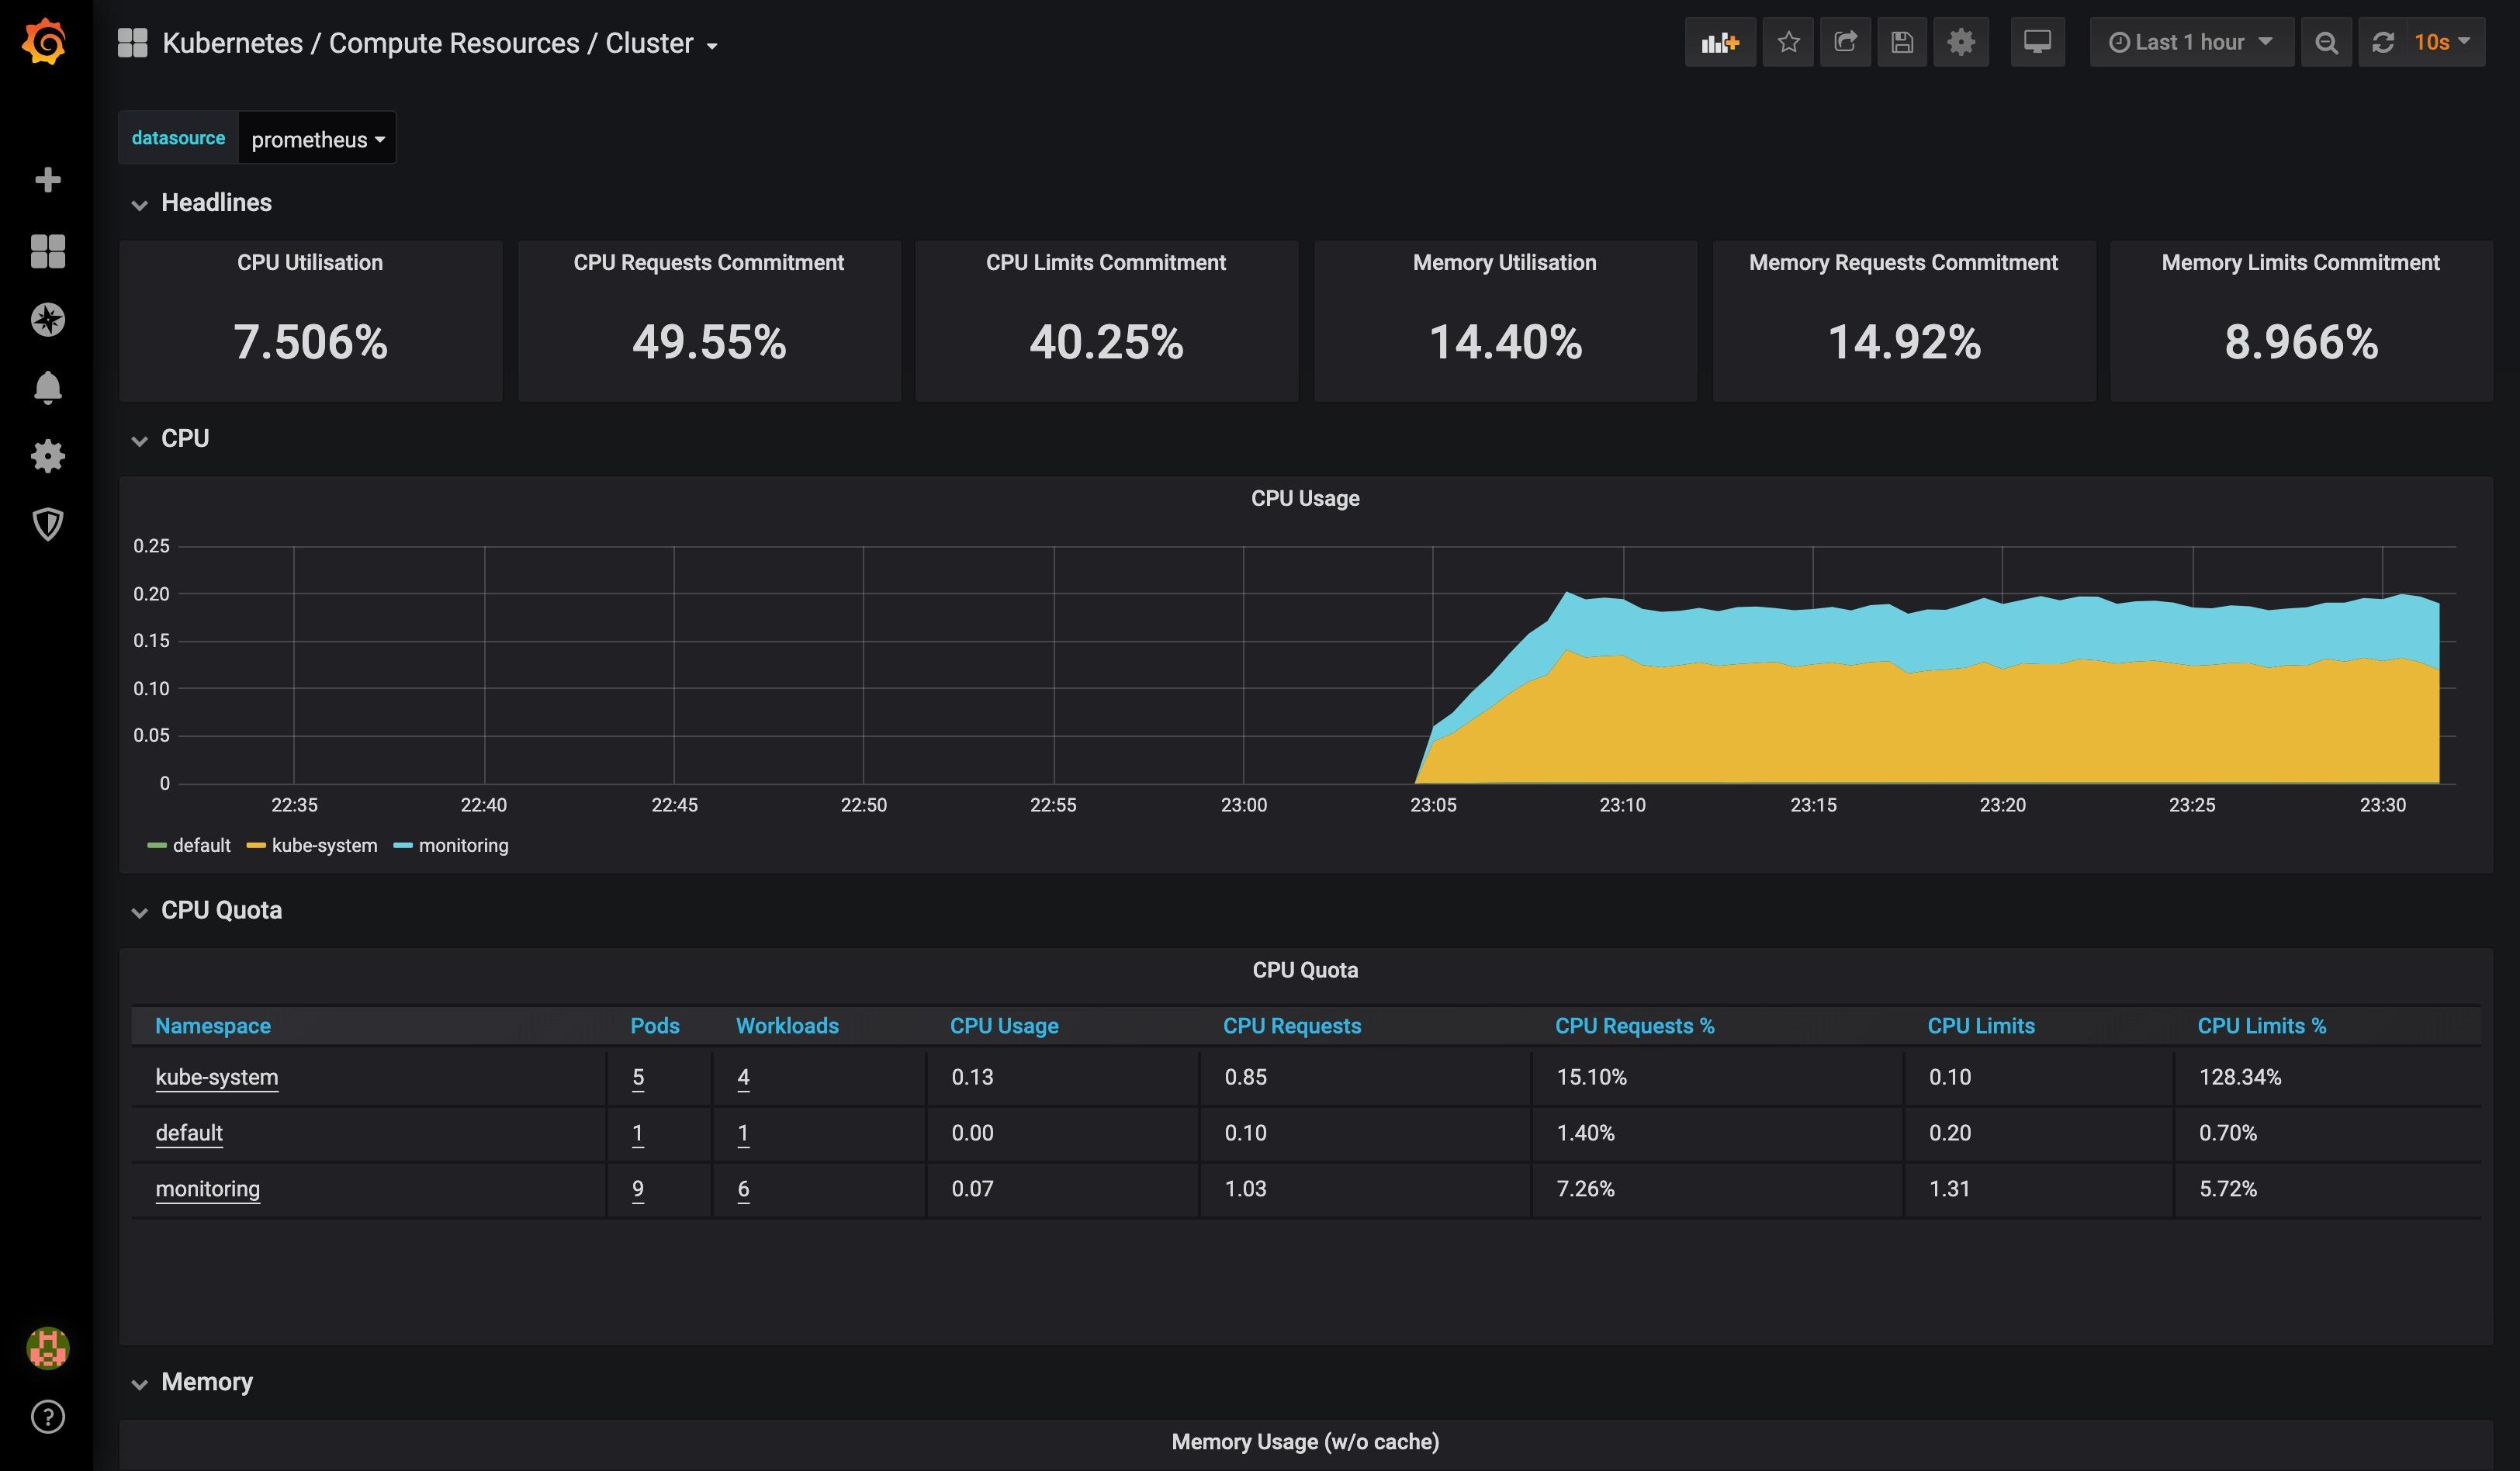
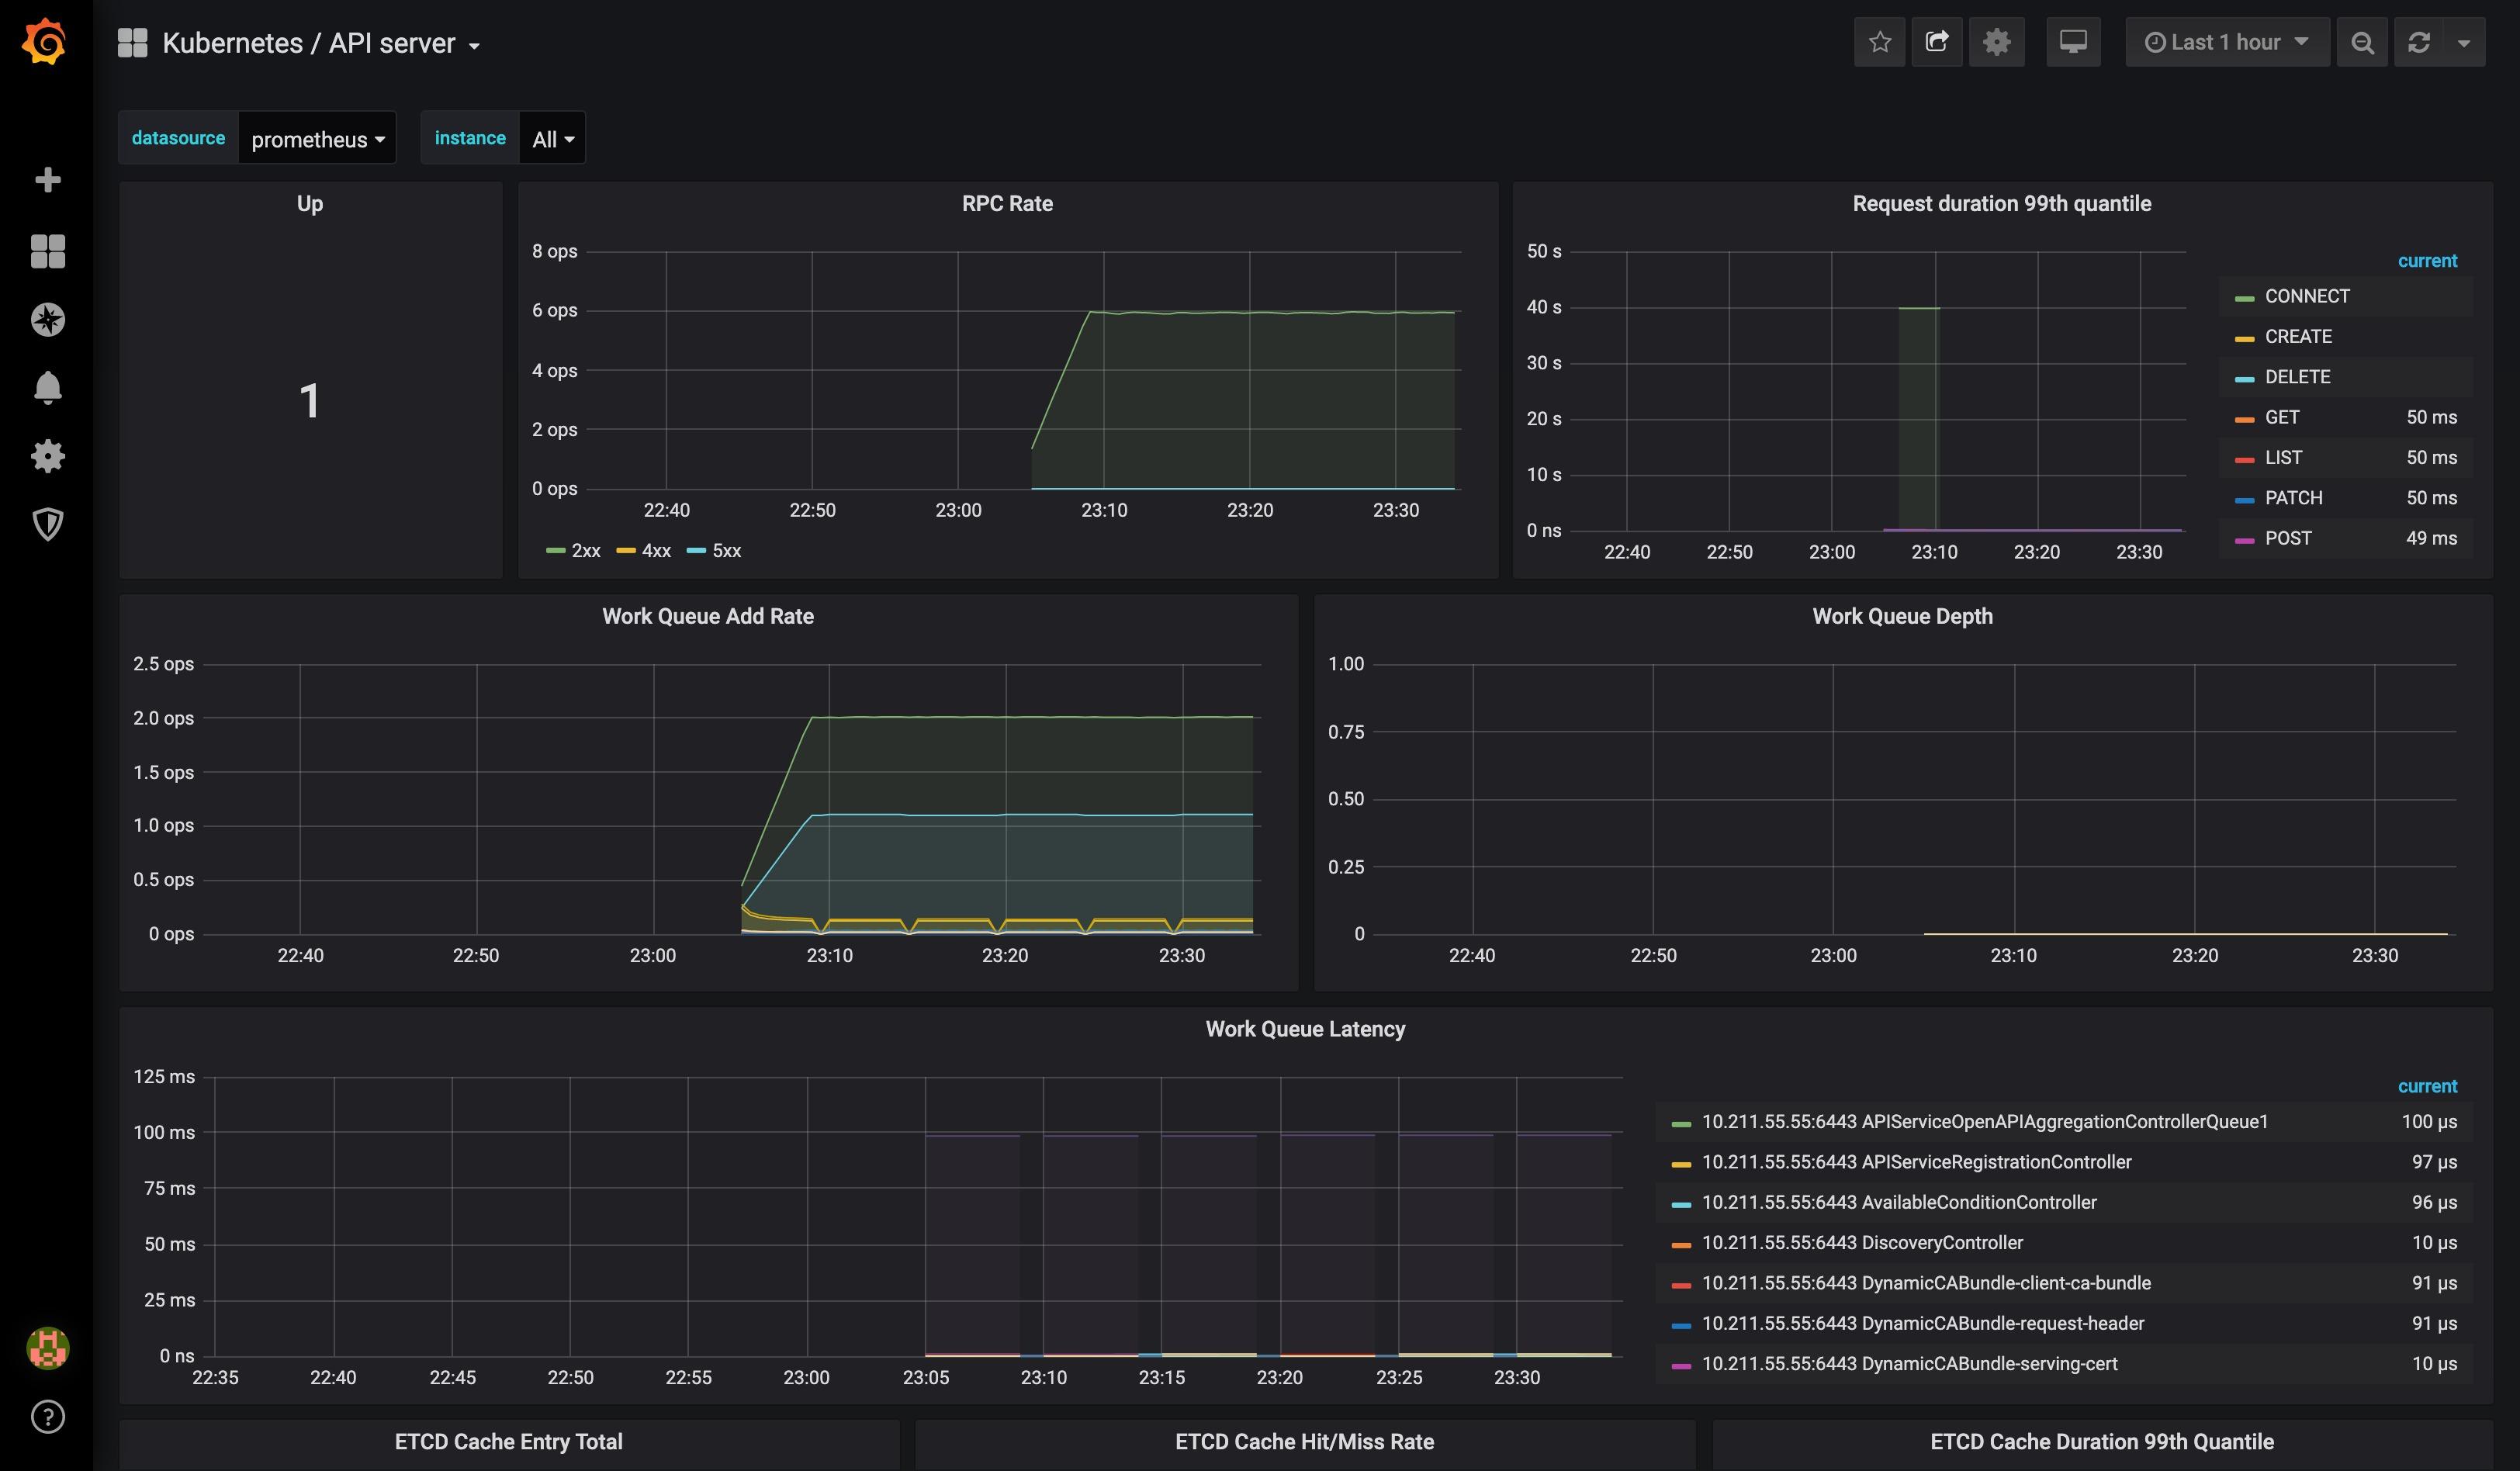
View grafana related pages:

Log in to grafana for the first time using admin:admin.
Prometheus Helm Deployment
Install Helm
- Select the target version according to the operating system: https://github.com/helm/helm/releases
- decompress
tar -zxvf helm-v3.0.0-linux-amd64.tar.gz - Move the helm binary executable file to the /usr/local/bin/ path
mv linux-amd64/helm /usr/local/bin/helm - Initialize the Chart repository
helm repo add stable https://kubernetes-charts.storage.googleapis.com/
$ helm search repo stable
NAME                                 	CHART VERSION	APP VERSION            	DESCRIPTION
stable/acs-engine-autoscaler         	2.2.2        	2.1.1                  	DEPRECATED Scales worker nodes within agent pools
stable/aerospike                     	0.3.2        	v4.5.0.5               	A Helm chart for Aerospike in Kubernetes
stable/airflow                       	5.2.5        	1.10.4                 	Airflow is a platform to programmatically autho...
stable/ambassador                    	5.3.0        	0.86.1                 	A Helm chart for Datawire Ambassador
# ...
Monitoring Suite Deployment
As with manual deployment, we will deploy the monitoring suite under the monitoring namespace:
$ kubectl create ns monitoring
namespace/monitoring created
$ helm install prometheus-operator stable/prometheus-operator -n monitoring
manifest_sorter.go:175: info: skipping unknown hook: "crd-install"
manifest_sorter.go:175: info: skipping unknown hook: "crd-install"
manifest_sorter.go:175: info: skipping unknown hook: "crd-install"
manifest_sorter.go:175: info: skipping unknown hook: "crd-install"
manifest_sorter.go:175: info: skipping unknown hook: "crd-install"
NAME: prometheus-operator
LAST DEPLOYED: Thu Jan 30 13:44:20 2020
NAMESPACE: default
STATUS: deployed
REVISION: 1
NOTES:
The Prometheus Operator has been installed. Check its status by running:
  kubectl --namespace default get pods -l "release=prometheus-operator"

Visit https://github.com/coreos/prometheus-operator for instructions on how
to create & configure Alertmanager and Prometheus instances using the Operator.
Check the relevant CRD resources:
$ kubectl get crd
NAME                                    CREATED AT
alertmanagers.monitoring.coreos.com     2020-01-30T05:44:17Z
podmonitors.monitoring.coreos.com       2020-01-30T05:44:17Z
prometheuses.monitoring.coreos.com      2020-01-30T05:44:17Z
prometheusrules.monitoring.coreos.com   2020-01-30T05:44:17Z
servicemonitors.monitoring.coreos.com   2020-01-30T05:44:17Z
Then confirm that the relevant Pods are running correctly:
$ kubectl get po -n monitoring
NAME                                                      READY   STATUS    RESTARTS   AGE
alertmanager-prometheus-operator-alertmanager-0           2/2     Running   0          32s
prometheus-operator-grafana-65dc66c89d-ch5h9              2/2     Running   0          36s
prometheus-operator-kube-state-metrics-5d4b95c886-s4l7l   1/1     Running   0          36s
prometheus-operator-operator-6748799449-ssz4h             2/2     Running   0          36s
prometheus-operator-prometheus-node-exporter-krx7d        1/1     Running   0          36s
prometheus-prometheus-operator-prometheus-0               3/3     Running   1          22s
kubectl get svc -n monitoring
NAME                                           TYPE        CLUSTER-IP       EXTERNAL-IP   PORT(S)                      AGE
alertmanager-operated                          ClusterIP   None             <none>        9093/TCP,9094/TCP,9094/UDP   82s
prometheus-operated                            ClusterIP   None             <none>        9090/TCP                     72s
prometheus-operator-alertmanager               ClusterIP   10.107.102.113   <none>        9093/TCP                     86s
prometheus-operator-grafana                    ClusterIP   10.99.155.180    <none>        80/TCP                       86s
prometheus-operator-kube-state-metrics         ClusterIP   10.102.159.81    <none>        8080/TCP                     86s
prometheus-operator-operator                   ClusterIP   10.110.182.186   <none>        8080/TCP,443/TCP             86s
prometheus-operator-prometheus                 ClusterIP   10.103.25.36     <none>        9090/TCP                     86s
prometheus-operator-prometheus-node-exporter   ClusterIP   10.104.41.87     <none>        9100/TCP                     86s
Similarly, we expose prometheus and grafana to the outside world through NodePort type services:
$ kubectl patch svc prometheus-operator-prometheus -n monitoring --patch '{"spec": {"type": "NodePort"}}'
$ kubectl patch svc prometheus-operator-grafana -n monitoring --patch '{"spec": {"type": "NodePort"}}'
$ kubectl get svc -n monitoring
NAME                                           TYPE        CLUSTER-IP       EXTERNAL-IP   PORT(S)                      AGE
prometheus-operator-grafana                    NodePort    10.99.155.180    <none>        80:32055/TCP                 5m26s
prometheus-operator-prometheus                 NodePort    10.103.25.36     <none>        9090:32640/TCP               5m26s
The first login of grafana deployed through Helm uses admin:prom-operator.