What is Linux /proc?
- foreword
- 1.What's this ?
- 2. Files in the /proc/ directory
-
- /proc/process number/
-
- /proc/process number/statm
- /proc/process number/cmdline
- /proc/process number/mem
- /proc/process number/cwd
- /proc/process number/environ
- /proc/process number/comm
- /proc/process number/coredump_filter
- /proc/process number/exe
- /proc/process number/fd
- /proc/process number/fdinfo
- /proc/process number/limits
- /proc/process number/maps
- /proc/process number/mountinfo
- /proc/process number/mounts
- /proc/process number/mountstate
- /proc/process number/net
- /proc/process number/ns
- /proc/process number/oom* (ie oom mechanism)
- /proc/process number/personality
- /proc/process number/root
- /proc/process number/stat
- /proc/process number/statm
- /proc/process number/status
- /proc/process number/task
- /proc/process number/wchan
- /proc/
-
- /proc/approx
- /proc/buddyinfo
- /proc/cmdline
- /proc/consoles
- /proc/cpuinfo
- /proc/crypto
- /proc/devices
- /proc/diskstats
- /proc/filesystems
- /proc/interrupts
- /proc/iom
- /proc/ioports
- /proc/loadavg
- /proc/locks
- /proc/meminfo
- /proc/mounts
- /proc/modules
- /proc/partitions
- /proc/pci
- /proc/slabinfo
- /proc/stat
- /proc/swaps
- /proc/uptime
- /proc/version
- /proc/vmstat
- /proc/zoneinfo
- /proc/sys
foreword
I was asked this by the interviewer during the interview recently. Although I had used the Linux system for a long time at that time, I was not familiar with many directories and files, and I felt that this should not be done. So I am going to write a series of articles about the Linux file system, strengthen myself, and help everyone at the same time. Due to my limited level, I may not be able to write in detail. If you have relevant supplementary knowledge, you can private message me. Of course, if you make any mistakes, please let me know. Thank you.
1.What’s this ?
The proc file system is a virtual file system created by the kernel. It is a file system used by the kernel to report information to the outside world. It stores a series of special files of the current kernel running status. It is created when the system is running, so it only exists In the memory and not on the external storage (hard disk, flash). The communication between the Linux kernel space and the user can be realized through the proc virtual file. It is the query center provided by the kernel to us. Through it, we can view the system hardware and the currently running process information, and even modify some of the files. The running state of the kernel.
The data source of many tools in Linux is the content in the proc directory. For example, the lsmod command is an alias of cat /proc/modules. For the convenience of viewing and use, the files in proc are usually classified and stored in different directories or even subdirectories according to their relevance. For example, the /proc/scsi directory stores the relevant information of all SCSI devices on the current system, / What is stored in proc/N is the relevant information of the currently running process of the system, where N is the running process (it is conceivable that its related directory will disappear after a certain process ends).
Most virtual files can be viewed using file viewing commands such as cat, more, or less. Some file information can be clearly expressed at a glance, but some file information is not very readable. However, these poorly readable files can perform well when viewed with commands such as apm, free, lspci, or top.
2. Files in the /proc/ directory
As mentioned above, the files in the proc directory can display the information of the system and related processes. Next, let us take a look at what files are there and their related functions. Because there are differences in the system, the list may not be complete. If you want to add something, please let me know, and I will add it as soon as possible.
First of all, when we enter the /proc directory and execute ls, we will first see a lot of numbers. What do these numbers represent? Is it a junk file that someone put on purpose?
of course not! ! ! These numbers represent the process number of the process currently running in the system, and each number directory has relevant information corresponding to the process. Let's take a simple statm as an example.
/proc/process number/
/proc/process number/statm
When cat /proc/1/statm is run, 7 groups of numbers will be printed out, and the unit of each number is a page, and the meanings of different numbers are quite different: size: the size of the task virtual address space Resident:
the one
in use Physical memory size
Shared : the number of shared pages
Trs : the executable virtual memory size owned by the program
Lrs : the size of the library of the virtual memory space of the mirrored task
Drs : the size of the program data segment and the stack of the user mode
dt : the number of dirty pages
/proc/process number/cmdline
This file contains the startup command for the process (absolute path shown)
/proc/process number/mem
Unreadable, this file refers to the memory occupied by the process
/proc/process number/cwd
link to this process working directory
/proc/process number/environ
This file contains a list of process environment variables
/proc/process number/comm
This file contains the process name
/proc/process number/coredump_filter
When the program crashes or the core file of the process is generated using the gcore tool, you can set the core dump mask to filter the part of the memory that needs to be dumped.
And this file represents the type of coredump filtering
The following 7 types of memory are supported:
-
(bit 0) anonymous private memory (anonymous private memory segment)
-
(bit 1) anonymous shared memory (anonymous shared memory segment)
-
(bit 2) file-backed private memory (file-backed private memory segment): file-mapped memory
-
(bit 3) file-backed shared memory (file-bakced shared memory segment)
-
(bit 4) ELF header pages in file-backed private memory areas (it is
effective only if the bit 2 is cleared) (ELF file mapping, only works when bit 2 is reset)
-
(bit 5) hugetlb private memory (huge page private memory): MAP_HUGETLB type data mapped by mmap
-
(bit 6) hugetlb shared memory (huge page shared memory)
You can filter the memory segments that need to be dumped by modifying the file /proc//coredump_filter.
The value in /proc//coredump_filter is hexadecimal, the default value is 0x23, converted to binary: 00100011, from right to left, bit 0, bit 1, bit 5 are set, that is to say, all Anonymous memory segments and large page private memory segments.
/proc/process number/exe
This link can link to the executable file of the process (execute command file)
/proc/process number/fd
This directory contains all relevant file descriptors of the process, and you can see many links after entering the directory.
In Linux, each process in the kernel corresponds to an array of "open files", which stores pointers to file objects, and fd is the subscript of this array.
When we operate on a file, the system calls and passes fd to the kernel, and the kernel finds the file through fd and operates on the file.
Since it is an array subscript, the type of fd is int, < 0 is an illegal value, and >=0 is a legal value. In Linux, the number of files that can be opened by a process is 1024 by default, and the range of fd is 0~1023. The maximum value can be changed by setting.
In Linux, fd with values of 0, 1, and 2 represent standard input, standard output, and standard error output, respectively. In the previous article, using redirection 2>/dev/null is to redirect the standard error output to the bit bucket without displaying it. Because 0 1 2 has been used by linux, the fd usually opened in the program starts from 3. But when we judge whether an fd is legal, we still have to use the judgment standard of >=0.
The allocation principle of fd is to find the first unused one and allocate it from small to large.
In addition to open, functions such as socket()/accept() of socket programming will also return an fd value.
1) Under the Linux system, the maximum number of fds allowed to be opened by all processes. Query statement:
/proc/sys/fs/file-max
2) Under the Linux system, the number of fds opened by all processes and the maximum number allowed. Query statement:
/proc/sys/fs/file-nr
3) The maximum number of fds allowed to be opened by a single process. Query statement:
ulimit -n
4) The fds that have been opened by a single process (for example, the process id is 5454). Query statement:
ls -l /proc/5454/fd/
After ls -ls, you can see the meaning of each link, such as
0 lrwx------ 1 root root 64 May 15 09:50 3 ->> socket:[2374]
If fd is 3, it represents the file descriptor generated by the socket.
/proc/process number/fdinfo
This directory stores information about each file descriptor
> /proc/1180/fdinfo #cat 0
> pos:    0  //文件offsets
> flags:  020000 //文件flags
/proc/process number/limits
This file contains some parameters restricted by the process
> /proc/1180 #cat limits
>  Limit                   Soft Limit		Hard Limit           Units
>  Max cpu time       unlimited         unlimited             seconds
>  Max file size             unlimited      unlimited            bytes
> Max data size             unlimited        unlimited            bytes
> Max stack size            8388608          unlimited            bytes
> Max core file size        0                unlimited            bytes
> Max open files            1024            4096                 files
> Max address space         unlimited        unlimited            bytes
> Max resident set          unlimited        unlimited            bytes
> Max processes             238              238                  processes
> Max locked memory         65536       65536                bytes
> Max file locks            unlimited        unlimited            locks
> Max pending signals       238              238                  signals
> Max msgqueue size         819200         819200               bytes
> Max nice priority         0               0
> Max realtime priority     0                    0
> Max realtimetimeout      unlimited            unlimited            us
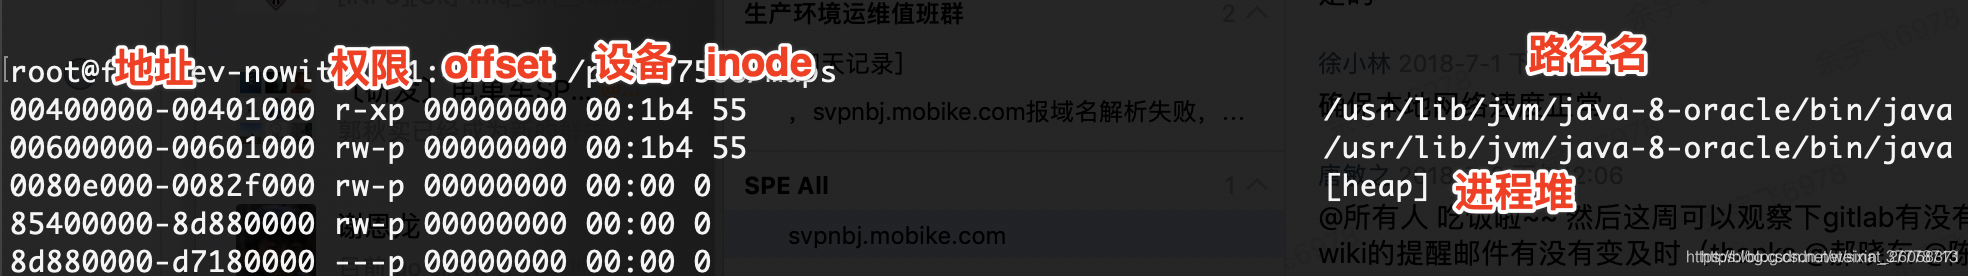
/proc/process number/maps
This file contains the currently mapped memory regions.
/proc/process number/mountinfo
This file contains process-related mount information (only part of the information is shown below)
/proc/1180 #cat mountinfo
1 1 0:1 / / ro,relatime - rootfs rootfs ro
11 1 0:3 / /proc rw,relatime - proc /proc rw
/proc/process number/mounts
There are generally three files in the current Linux system: /etc/fstab, /etc/mtab, and /proc/mounts, which are more confusing. Simply explain.
/etc/fstab is read-only and not writable. It provides static information about devices mounted on the system. For example, mount -a will mount the file system specified in /etc/fstab.
/etc/mtab is for mount/umount to read and write, and is relatively dynamic. If you read it, for example, if you lack a parameter when mounting a file system, it will automatically go to /etc/mtab or /etc/fstab to check, if found, only one parameter is enough. If you write, for example, if you umount a file system, umount will delete the relevant records in /etc/mtab.
It seems that the above two files are enough, but a new situation has emerged. The Linux kernel introduces a mount namespace for containers. Because of this, Linux had to introduce /proc/mounts. why? Because /etc/mtab that records mount information is global, that is to say, even if one of your processes has its own namespace, as long as it still shares the same /etc/mtab with the outside, then the umount/mount operation is performed inside The information will also be recorded in /etc/mtab, and it will be seen outside! Messy! It can be seen that we cannot have a global mtab, what should we do? /proc/mounts is out, some people may think it is also global! But if you take a closer look, it's actually a symbolic link to /proc/self/mounts! In this way, the /proc/mounts inside the container will of course be different from the ones outside! Clever!
So, /etc/mtab is obsolete and should be dropped, or symlinked directly to /proc/mounts. In the same way, if you want to check the file system mounted on the system, it is inappropriate to directly call mount without parameters, because that is also to read /etc/mtab. We should use a new command provided by util-linux-ng: findmnt, which reads /proc/self/mountinfo.
/proc/process number/mountstate
This file contains the state of the corresponding mounts of the process
/proc/1180 #cat mountstats
device rootfs mounted on / with fstype rootfs
device /proc mounted on /proc with fstype proc
device devpts mounted on /dev/pts with fstype devpts
device tmpfs mounted on /var with fstype tmpfs
/proc/process number/net
Detailed introduction:
/proc/net/arp
IP address       HW type     Flags       HW address            Mask     Device
192.168.1.151    0x1         0x2         00:e0:4c:19:1a:98     *        eth0
192.168.1.1      0x1         0x2         00:14:78:e7:c4:e8     *        eth0

每个网络接口的arp表中dev包的统计
IP address:IP地址(直连)
HW type:硬件类型
23=0x17   strip (Metricom Starmode IP)
01=0x01   ether (Ethernet)
15=0xf      dlci (Frame Relay DLCI)
Flags:
HW address:MAC 地址
Mask:
Device:所在网络接口
/proc/net/dev
Inter-|   Receive bytes      packets errs drop fifo frame
 face |  compressed multicast
 lo:       238306  4170      0        0    0     0                 0         0
 eth0:   885217  2782      0        0    0     0                 0         0
 pan0:  0            0            0        0    0     0                 0         0
 tap0:   4092      46          0        0    0     0                 0         0

|  Transmit
|bytes        packets errs drop fifo colls carrier compressed
238306     4170      0       0    0     0       0          0
3581505   19730    0       0    0     0       0          0
0                0           0       0    0     0       0          0
5644          38         0       0    0     0       0          0

网络设备的统计
/proc/net/dev_mcast
2    eth0            1     0     01005e0000fb
2    eth0            1     0     01005e000001
5    tap0            1     0     01005e0000fb
5    tap0            1     0     01005e000001

组播包统计
/proc/net/igmp
Idx     Device    : Count Querier       Group    Users Timer    Reporter
1       lo        :     0      V3
                                010000E0     1 0:00000000               0
2       eth0      :     2      V3
                                FB0000E0     1 0:00000000               0
                                010000E0     1 0:00000000               0
5       tap0      :     2      V3
                                FB0000E0     1 0:00000000               0
                                010000E0     1 0:00000000               0

IGMP 分组情况
/proc/net/netlink
sk       Eth Pid    Groups   Rmem     Wmem     Dump     Locks
cedaae00 0   2527   00000111 0        0        00000000 2
cec2a400 0   0      00000000 0        0        00000000 2
cdc8da00 7   0      00000000 0        0        00000000 2
cef32400 9   0      00000000 0        0        00000000 2
ce000c00 9   2482   00000000 0        0        00000000 2
cecb8400 10  0      00000000 0        0        00000000 2
cecaaa00 11  0      00000000 0        0        00000000 2
cf832600 15  542    00000001 0        0        00000000 2
cec5fe00 15  0      00000000 0        0        00000000 2
cecaa800 16  0      00000000 0        0        00000000 2
cddd8a00 18  0      00000000 0        0        00000000 2

**netlink套接口的信息**
/proc/net/netstat
TcpExt: SyncookiesSent SyncookiesRecv SyncookiesFailed EmbryonicRsts PruneCalled RcvPruned OfoPruned OutOfWindowIcmps LockDroppedIcmps ArpFilter TW TWRecycled TWKilled PAWSPassive PAWSActive PAWSEstab DelayedACKs DelayedACKLocked DelayedACKLost ListenOverflows ListenDrops TCPPrequeued TCPDirectCopyFromBacklog TCPDirectCopyFromPrequeue TCPPrequeueDropped TCPHPHits TCPHPHitsToUser TCPPureAcks TCPHPAcks TCPRenoRecovery TCPSackRecovery TCPSACKReneging TCPFACKReorder TCPSACKReorder TCPRenoReorder TCPTSReorder TCPFullUndo TCPPartialUndo TCPDSACKUndo TCPLossUndo TCPLoss TCPLostRetransmit TCPRenoFailures TCPSackFailures TCPLossFailures TCPFastRetrans TCPForwardRetrans TCPSlowStartRetrans TCPTimeouts TCPRenoRecoveryFail TCPSackRecoveryFail TCPSchedulerFailed TCPRcvCollapsed TCPDSACKOldSent TCPDSACKOfoSent TCPDSACKRecv TCPDSACKOfoRecv TCPAbortOnSyn TCPAbortOnData TCPAbortOnClose TCPAbortOnMemory TCPAbortOnTimeout TCPAbortOnLinger TCPAbortFailed TCPMemoryPressures TCPSACKDiscard TCPDSACKIgnoredOld TCPDSACKIgnoredNoUndo TCPSpuriousRTOs TCPMD5NotFound TCPMD5Unexpected

TcpExt: 0 0 0 0 0 0 0 0 0 0 2 0 0 0 0 0 555 145 2 0 0 0 0 0 0 3029 0 10463 1848 0 0 0 0 0 0 0 0 0 0 0 0 0 0 0 0 0 0 0 2 0 0 0 0 2 0 0 0 0 0 1 0 0 0 0 0 0 0 0 0 0 0

IpExt: InNoRoutes InTruncatedPkts InMcastPkts OutMcastPkts InBcastPkts OutBcastPkts
IpExt:   0                    0                        30                36                    79                  0

网络流量的多种统计
/proc/net/raw
  sl  local_address rem_address   st tx_queue rx_queue tr tm->when retrnsmt   uid  timeout inode ref pointer drops

原始套接口的套接口表
/proc/net/route
Iface  Destination   Gateway     Flags  RefCnt Use   Metric Mask      MTU   Window IRTT
tap0  000010AC    00000000    0001  0    0    0    00FFFFFF    0    0    0
eth0  0001A8C0    00000000    0001  0    0    0    00FFFFFF    0    0    0
eth0  0000FEA9    00000000    0001  0    0    0    0000FFFF    0    0    0
lo   0000007F    00000000    0001  0    0    0    000000FF    0    0    0
eth0  00000000    0101A8C0    0003  0    0    0    00000000    0    0    0

静态路由表
/proc/net/rt_cache (you can also see the parsed result through ip route show cache)
Iface  Destination   Gateway     Flags      RefCnt Use   Metric Source     MTU   Window IRTT  TOS   HHRef    HHUptod SpecDst
lo   FF01A8C0    FF01A8C0    94000000    0    0    0    9701A8C0    0    0    0    00   -10    C901A8C0
eth0  9701A8C0    9701A8C0        0    2    1    0    C901A8C0    1500  0    0    10   20    C901A8C0
lo   C901A8C0    C901A8C0    84000000    0    185   0    9701A8C0    0    0    0    00   -10    C901A8C0

路由缓存表
ip route show cache

Note: Higher version kernels cannot be displayed ; if there is a problem with the route cache, it can be recovered through ip route flush cache
/proc/net/snmp
Ip: Forwarding DefaultTTL InReceives InHdrErrors InAddrErrors ForwDatagrams InUnknownProtos InDiscards InDelivers OutRequests OutDiscards OutNoRoutes ReasmTimeout ReasmReqds ReasmOKs ReasmFails FragOKs FragFails FragCreates
Ip: 2 64 17123 0 13 0 0 0 17110 24061 0 0 0 0 0 0 0 0 0
Icmp: InMsgs InErrors InDestUnreachs InTimeExcds InParmProbs InSrcQuenchs InRedirects InEchos InEchoReps InTimestamps InTimestampReps InAddrMasks InAddrMaskReps OutMsgs OutErrors OutDestUnreachs OutTimeExcds OutParmProbs OutSrcQuenchs OutRedirects OutEchos OutEchoReps OutTimestamps OutTimestampReps OutAddrMasks OutAddrMaskReps
Icmp: 34 0 10 0 0 0 0 0 24 0 0 0 0 34 0 10 0 0 0 0 24 0 0 0 0 0
IcmpMsg: InType0 InType3 OutType3 OutType8
IcmpMsg: 24 10 10 24
Tcp: RtoAlgorithm RtoMin RtoMax MaxConn ActiveOpens PassiveOpens AttemptFails EstabResets CurrEstab InSegs OutSegs RetransSegs InErrs OutRsts
Tcp: 1 200 120000 -1 6 6 2 2 4 16956 23979 2 0 3
Udp: InDatagrams NoPorts InErrors OutDatagrams RcvbufErrors SndbufErrors
Udp: 30 10 0 40 0 0
UdpLite: InDatagrams NoPorts InErrors OutDatagrams RcvbufErrors SndbufErrors
UdpLite: 0 0 0 0 0 0

snmp agent的ip/icmp/tcp/udp协议统计
/proc/net/sockstat
sockets: used 556
TCP: inuse 9 orphan 0 tw 0 alloc 10 mem 2
UDP: inuse 5 mem 0
UDPLITE: inuse 0
RAW: inuse 0
FRAG: inuse 0 memory 0

使用的tcp/udp/raw/pac/syc_cookies的数量
/proc/net/tcp
 sl  local_address rem_address   st tx_queue rx_queue tr tm->when retrnsmt   uid  timeout inode
   0: 00000000:10E1 00000000:0000 0A 00000000:00000000 00:00000000 00000000     0        0 63205 1 c91b0500 300 0 0 2 -1
   1: 00000000:006F 00000000:0000 0A 00000000:00000000 00:00000000 00000000     0        0 5253 1 ce47aa40 300 0 0 2 -1
   2: 00000000:0016 00000000:0000 0A 00000000:00000000 00:00000000 00000000     0        0 7799 1 ce4a3a80 300 0 0 2 -1
   3: 0100007F:0277 00000000:0000 0A 00000000:00000000 00:00000000 00000000     0        0 6509 1 ce47a0c0 300 0 0 2 -1
   4: 0100007F:0019 00000000:0000 0A 00000000:00000000 00:00000000 00000000     0        0 7392 1 ce47a580 300 0 0 2 -1
   5: C901A8C0:0016 9701A8C0:0B64 01 00000034:00000000 01:00000022 00000000     0        0 16290 4 c91b09c0 35 4 3 5 4
   6: 0100007F:10E1 0100007F:91DE 01 00000000:00000000 00:00000000 00000000     0        0 63427 1 c91b0040 21 4 29 3 -1
   7: C901A8C0:0016 9701A8C0:066B 01 00000000:00000000 02:000497D5 00000000     0        0 12401 2 ce4a35c0 31 4 16 5 4
   8: 0100007F:91DE 0100007F:10E1 01 00000000:00000000 00:00000000 00000000     0        0 63426 1 c90a1a00 22 4 30 3 -1

TCP连接的套接口
/proc/net/udp
  sl  local_address rem_address   st tx_queue rx_queue tr tm->when retrnsmt   uid  timeout inode ref pointer drops
   3: 00000000:9883 00000000:0000 07 00000000:00000000 00:00000000 00000000   104        0 6195 2 ce437700 0
  24: 00000000:0298 00000000:0000 07 00000000:00000000 00:00000000 00000000     0        0 5252 2 ce437b80 0
 105: 00000000:14E9 00000000:0000 07 00000000:00000000 00:00000000 00000000   104        0 6194 2 ce437940 0
 111: 00000000:006F 00000000:0000 07 00000000:00000000 00:00000000 00000000     0        0 5220 2 ce437dc0 0
 119: 00000000:0277 00000000:0000 07 00000000:00000000 00:00000000 00000000     0        0 6526 2 ce437040 0

UDP连接的套接口表
/proc/net/unix
c9113580: 00000003 00000000 00000000 0001 03 11719
c9113740: 00000003 00000000 00000000 0001 03 11717 /var/run/dbus/system_bus_socket
c9113900: 00000003 00000000 00000000 0001 03 11716
c9113c80: 00000003 00000000 00000000 0001 03 11711 /tmp/orbit-yaozhongkai/linc-c9d-0-6437df843b36c
c9113e40: 00000003 00000000 00000000 0001 03 11710
c9078040: 00000003 00000000 00000000 0001 03 11708 @/tmp/dbus-TT8HxW0iEY


    UNIX域套接口的套接口表
/proc/process number/ns
Contains file descriptors for the various namespaces the process belongs to. For example:
ls /proc/7588/ns
total 0
lrwxrwxrwx 1 root root 0 Feb 27 10:26 uts -> uts:[4026531838]
lrwxrwxrwx 1 root root 0 Feb 27 10:26 user -> user:[4026531837]
lrwxrwxrwx 1 root root 0 Feb 27 10:26 pid -> pid:[4026531836]
lrwxrwxrwx 1 root root 0 Feb 27 10:26 net -> net:[4026531968]
lrwxrwxrwx 1 root root 0 Feb 27 10:26 mnt -> mnt:[4026531840]
lrwxrwxrwx 1 root root 0 Feb 27 10:26 ipc -> ipc:[4026531839]
/proc/process number/oom* (ie oom mechanism)
oom_adj/oom_score: These two files are related to the OOM mechanism of linux (see here for OOM). oom_adj is equivalent to a factor. The larger its value, the easier it is to be killed by the system during OOM, but the final decision is whether to be killed The oom_score is the oom_score. In fact, when calculating the oom_score, it is based on the oom_adj. The larger the oom_adj, the larger the calculated oom_score, and it can be easily killed by the system during OOM. Of course, if it is a very important service site, in order to avoid this situation, set oom_adj=0, which means that it will never be killed because of OOM.
I am not very clear about this part. I feel very helpful to see the articles of some bloggers. Let me share with you.
https://blog.csdn.net/liukuan73/article/details/43238623
https://www.linuxidc.com/Linux/2012-05/59486.htm
/proc/process number/personality
The function of this file is not clear, the result after cat is 00000000
/proc/process number/root
A symbolic link pointing to the root directory of the current process, usually "/"; on Unix and Linux systems, the chroot command is usually used to make each process run in an independent root directory;
/proc/process number/stat
This file is an abbreviation of the status that follows, and only provides data to reduce space and facilitate viewing. Each data can find the corresponding attribute in status
/proc/process number/statm
Check the memory used by the process
/proc/1180 #cat statm
2292 605 487 9 0 734 0
参数 解释 /proc/[pid]/statm
Size (pages) 任务虚拟地址空间的大小 VmSize/4
Resident(pages) 应用程序正在使用的物理内存的大小 VmRSS/4
Shared(pages) 共享页数 0
Text(code)
Trs(pages) 程序所拥有的可执行虚拟内存的大小 VmExe/4
Lrs(pages) 被映像到任务的虚拟内存空间的库的大小 VmLib/4
Drs(pages) 程序数据段和用户态的栈的大小 (VmData+ VmStk )4
The second column is Resident(pages)—the size of the physical memory being used by the application program VmRSS/4, which is a quarter of the actual memory value used.
/proc/process number/status
View the relevant status of the process
cat /proc/7588/status
Name:	java                       # 进程运行的指令
State:	S (sleeping)               # 进程当前的状态,"R (running)", "S (sleeping)", "D (disk sleep)", "T (stopped)", "T(tracing stop)", "Z (zombie)",  "X (dead)"
Tgid:	7588                       # 线程组ID,一般就是进程ID
Ngid:	0                          # NUMA group ID
Pid:	7588                       # 进程ID
PPid:	7565                       # 父进程ID
TracerPid:	0                      # PID of process tracing this process (0 if not being traced).
Uid:	0	0	0	0
Gid:	0	0	0	0
FDSize:	256
Groups:	0 1 2 3 4 6 10 11 20 26 27
NStgid:	7588	1
NSpid:	7588	1
NSpgid:	7588	1
NSsid:	7588	1
VmPeak:	 5637656 kB
VmSize:	 5637656 kB             # 系统为进程分配的虚拟内存的大小 ,有关进程内存,详情参考:https://blog.csdn.net/sinat_26058371/article/details/86536213
VmLck:	       0 kB
VmPin:	       0 kB
VmHWM:	 1029820 kB             # RSS的峰值大小
VmRSS:	 1029820 kB             # RSS大小
VmData:	 5581264 kB             # 数据大小
VmStk:	     132 kB             # 栈大小
VmExe:	       4 kB             # text segment大小
VmLib:	   18240 kB             # 共享库代码大小
VmPTE:	    2320 kB
VmPMD:	      36 kB
VmSwap:	       0 kB             # 交换分区的大小
HugetlbPages:	       0 kB
Threads:	41                  # 进程中线程的数量
SigQ:	0/31353
SigPnd:	0000000000000000
ShdPnd:	0000000000000000
SigBlk:	0000000000000000
SigIgn:	0000000000000000
SigCgt:	2000000181005ccf
CapInh:	00000000a80425fb
CapPrm:	00000000a80425fb
CapEff:	00000000a80425fb
CapBnd:	00000000a80425fb
CapAmb:	0000000000000000
Seccomp:	0
Cpus_allowed:	f                # 这个进程能够运行的CPU掩码,这台机器的CPU有4个核心,f(1111)表示这个进程可以在所有核心上运行
Cpus_allowed_list:	0-3          # 这个进程能够运行在那些cpu上,cpu的id是一个数组,通常范围是0 ~ cpu核数-1(这里就是0、1、2、3)
Mems_allowed:	00000000,00000001  # 这个进程能够访问的内存节点掩码(和NUMA的group id一致)
Mems_allowed_list:	0              # 这个进程能够访问的内存节点(和NUMA的group id一致)
voluntary_ctxt_switches:	56
nonvoluntary_ctxt_switches:	5
/proc/process number/task
In this directory, each thread in the process has a corresponding subdirectory, the name of the subdirectory is the thread ID, and the file structure in the subdirectory is consistent with that in the /proc/PID directory.
/proc/process number/wchan
This document does not know the specific role, please help to add.
OK The above are some introductions about the process directory, and then the subsequent directories and files of the proc will be introduced
/proc/
/proc/approx
Advanced Power Management (APM) version information and battery-related status information are usually used by the apm command;
/proc/buddyinfo is the debug information of the physical memory managed by the linuxbuddy system.
/proc/buddyinfo
In Linux, the buddy algorithm is used to solve the problem of external fragmentation of physical memory. It divides all free memory into 11 block linked lists in the form of a power of 2, corresponding to 1, 2, 4, 8, 16, and 32 respectively. , 64, 128, 256, 512, 1024 page blocks.
Linux supports NUMA technology. For NUMA devices, the nodes of a NUMA system are usually composed of a group of CPUs and local memory. Each node has a corresponding local memory, so Node0 in buddyinfo represents the node ID; The memory device can be divided into multiple memory areas (zones). Therefore, in the following display, the memory of Node0 is divided into DMA, Normal, and HighMem areas. And the back is the free area.
Here, the Normal area is used for analysis. The value in the second column is 100, indicating the normal area in the current system. The memory size of two consecutive pages available is 100 2 PAGE_SIZE ; the value in the third column is 52, indicating the normal area in the current system. Available The memory size of four consecutive pages is 52 2^2 PAGE_SIZE
/proc/cmdline
Relevant parameter information passed to the kernel at startup, which is usually passed by startup management tools such as lilo or grub;
/proc/consoles
Information about the current system terminal
/proc/cpuinfo
Stores information about the processor
/proc/crypto
Cryptographic algorithms installed in the system and related information
/proc/devices
Information about all block devices and character devices loaded by the system, including the major device number and device group (device type corresponding to the major device number) name
/proc/diskstats
List of disk I/O statistics for each disk device; (kernel 2.5.69 and later versions support this function)
/proc/filesystems
The file system type list file currently supported by the kernel, the file system marked as nodev means that it does not need the support of block devices; usually when mounting a device, if the file system type is not specified, this file will be used to determine the required file system type;
/proc/interrupts
List of interrupt numbers related to each IRQ on the X86 or X86_64 architecture system; each CPU on a multi-processor platform has its own interrupt number for each I/O device;
/proc/iom
Mapping information of memory (RAM or ROM) on each physical device in system memory
/proc/ioports
A list of input-output port range information currently in use and registered to communicate with physical devices; as shown below, the first column indicates the registered I/O port range, followed by related devices
/proc/loadavg
Save the load averages about CPU and disk I/O, the first three columns represent the load averages every 1 second, every 5 seconds and every 15 seconds, similar to the relevant information output by the uptime command; the fourth column is Two values separated by a slash, the former indicates the number of entities (processes and threads) currently being scheduled by the kernel, the latter indicates the number of kernel scheduling entities currently surviving in the system; the fifth column indicates the latest before the file was viewed PID of a process created by the kernel
/proc/locks
Save information about files currently locked by the kernel, including debugging data inside the kernel; each lock occupies one line and has a unique number; the second column of each line in the following output information indicates the lock type used by the current lock, POSIX Indicates the current newer type of file lock, which is generated by the lockf system call. FLOCK is a traditional UNIX file lock, which is generated by the flock system call; the third column usually has two types. ADVISORY indicates that other users are not allowed to lock this file, but Allow reading, MANDATORY means that this file is locked and no other users are allowed to access in any form
/proc/meminfo
Information about the current memory usage in the system is often used by the free command; you can use the file view command to directly read this file, and its content is displayed in two columns, the former is the statistical attribute, and the latter is the corresponding value
/proc/mounts
Before the kernel version 2.4.29, the content of this file is all the file systems currently mounted by the system. In the kernel after 2.4.19, the method of using an independent mount namespace for each process is introduced, and this file changes accordingly. Becomes a symbolic link pointing to the /proc/self/mounts (list of all mount points in each process's own mount namespace) file; /proc/self is a unique directory, which will be introduced later;
The first column indicates the mounted device, the second column indicates the mount point in the current directory tree, the third column indicates the type of the current file system, the fourth column indicates the mount attribute (ro or rw), the fifth column and The sixth column is used to match the dump (dump) attribute in the /etc/mtab file
/proc #cat mounts
rootfs / rootfs ro,relatime 0 0
/proc /proc proc rw,relatime 0 0
/proc/modules
The list of all module names currently loaded into the kernel can be used by the lsmod command or viewed directly; as shown below, the first column indicates the module name, the second column indicates the memory space occupied by this module, and the third column indicates the module How many instances are loaded, the fourth column indicates which other modules this module depends on, the fifth column indicates the loading status of this module (Live: loaded; Loading: loading; Unloading: unloading), the sixth column Indicates the offset of this module in kernel memory
/proc/partitions
Information such as the major device number (major) and the minor device number (minor) of each partition of the block device, including the number of blocks (blocks) contained in each partition (as shown in the third column of the output below)
/proc #cat partitions
major minor  #blocks  name

  31        0       2944 mtdblock0
  31        1       2112 mtdblock1
/proc/pci
A list of all PCI devices and their configuration information found during kernel initialization. Most of the configuration information is IRQ information related to a certain PCI device, which is not very readable. You can use the "/sbin/lspci –vb" command to obtain relevant information that is easier to understand ; After the 2.6 kernel, this file has been replaced by the /proc/bus/pci directory and the files under it
/proc/slabinfo
Frequently used objects in the kernel (such as inode, dentry, etc.) have their own cache, that is, slab pool, and the /proc/slabinfo file lists information about slaps related to these objects; for details, please refer to the man page of slapinfo in the kernel documentation
/proc #cat slabinfo
slabinfo - version: 2.1
 name            <active_objs> <num_objs> <objsize> <objperslab> <pagesperslab> : tunables <limit> <batchcount> <sharedfactor> : slabdata <active_slabs> <num_slabs> <sharedavail>
ol_user_cache          0      0    800   10    2 : tunables    0    0    0 : slabdata      0      0      0
RAWv6                 12     12    672   12    2 : tunables    0    0    0 : slabdata      1      1      0
UDPLITEv6              0      0    672   12    2 : tunables    0    0    0 : slabdata      0      0      0
UDPv6                 12     12    672   12    2 : tunables    0    0    0 : slabdata      1      1      0
/proc/stat
Real-time tracking of various statistical information since the last boot of the system; as shown below, the
eight values after the "cpu" line represent statistical values in units of 1/100 (jiffies) seconds (including the system running on the user mode, low-priority user mode, operating system mode, idle mode, I/O wait mode, etc.);
"intr" line gives interrupt information, the first one is all interrupts that have occurred since the system was started The number of times; then each number corresponds to the number of times a specific interrupt has occurred since the system was started;
"ctxt" gives the number of context switches that have occurred on the CPU since the system was started.
"btime" gives the time from the system startup to the present, in seconds;
"processes (total_forks) the number of tasks created since the system startup;
"procs_running": the number of tasks currently running in the queue;
"procs_blocked ": The number of currently blocked tasks;
/proc #cat stat
cpu  75734 0 133789 8630740 0 0 7860 0 0 0
cpu0 75734 0 133789 8630740 0 0 7860 0 0 0
intr 22751841 0 0 0 0 612178 0 0 22118731 0 0 0 20932 0 0 0 0 0 0 0 0 0 0 0 0 0 0 0 0 0 0 0 0 0 0 0 0 0 0 0 0 0 0 0 0 0 0 0 0 0 0 0 0 0 0 0 0 0 0 0 0 0 0 0 0 0 0 0 0 0 0 0 0 0 0 0 0 0 0 0 0 0 0 0
ctxt 31972782
btime 1589506354
processes 235454
procs_running 1
procs_blocked 0
softirq 24867766 0 22118022 53101 1002109 0 0 0 0 0 1694534
/proc/swaps
The swap partition and its space utilization information on the current system, if there are multiple swap partitions, the information of each swap partition will be stored in a separate file in the /proc/swap directory, and the lower the priority number, The greater the possibility of being used; the following is the output information when there is only one swap partition in the author's system
/proc/uptime
The running time since the system was last started, as shown below, the first number indicates the system running time, and the second number indicates the system idle time, in seconds
/proc/version
The version number of the kernel running on the current system, and the gcc version installed in the system will also be displayed on the author's RHEL5.3
[root@rhel5 ~]# more /proc/version
Linux version 2.6.18-128.el5 (mockbuild@hs20-bc1-5.build.redhat.com) (gcc version 4.1.2 20080704 (Red Hat 4.1.2-44)) #1 SMP Wed Dec 17 11:42:39 EST 2008
/proc/vmstat
Various statistical data of the current system virtual memory, the amount of information may be relatively large, this varies from system to system, and the readability is better; the following is a fragment of the output information on the author's machine; (the kernel after 2.6 supports this file )
/proc #cat vmstat
nr_free_pages 14596
nr_inactive_anon 326
nr_active_anon 3029
nr_inactive_file 1834
nr_active_file 703
nr_unevictable 0
nr_mlock 0
nr_anon_pages 3033
nr_mapped 1946
nr_file_pages 2867
nr_dirty 0
/proc/zoneinfo
The detailed information list of the memory area (zone) has a large amount of information. The following is an output fragment:
/proc #cat zoneinfo
Node 0, zone   Normal
  pages free     14589
        min      360
        low      450
        high     540
        scanned  0
        spanned  32768
        present  32512
    nr_free_pages 14589
    nr_inactive_anon 326
    nr_active_anon 3029
    nr_inactive_file 1834
    nr_active_file 703
    nr_unevictable 0
/proc/sys
Different from the "read-only" attribute of other files under /proc, the administrator can modify the contents of many files in the /proc/sys subdirectory to change the operating characteristics of the kernel. You can use the "ls -l" command to view in advance Whether a file is "writable". Write operations are usually done using a format similar to "echo DATA > /path/to/your/filename". It should be noted that even if the file is writable, it generally cannot be edited with an editor.
/proc/sys/debug subdirectory
This directory is usually an empty directory;
/proc/sys/dev subdirectory
The directory that provides parameter information files for special devices on the system, and the information files of different devices are stored in different subdirectories, such as /proc/sys/dev /cdrom and /proc/sys/dev that are available on most systems /raid (if the kernel is compiled with the function of supporting raid enabled) directory, which usually stores the relevant parameter information files of cdrom and raid on the system.
The above is the introduction of the /proc/ file organized this time. I hope everyone can give more comments and make it more complete.
Thanks for the help provided by the following links:
https://www.cnblogs.com/lidabo/p/5628020.html
https://www.cnblogs.com/zydev/p/8728992.html
https://www.cnblogs.com/kelamoyujuzhen/p/9939935.html
https://blog.csdn.net/lickylin/article/details/50726847