2023 mathorcup D question aviation safety risk analysis and flight technology assessment thinking analysis
Flight safety is the basis for the survival and development of the civil aviation transportation industry. With the rapid development of my country's civil aviation industry, research on flight safety issues is becoming more and more important. On March 21, 2022, the "3.21" air crash ended the best safety record in the history of China's civil aviation safety flight of 100.59 million flight hours. The occurrence of serious flight accidents will not only bring huge economic losses to airlines, but also pose a great threat to the lives of passengers. Therefore, it is necessary to focus on flight safety issues, strengthen aviation safety research, comprehensively utilize existing data to strengthen scientific management, effectively improve the quality of employees, monitor and warn risks through targeted and systematic control methods, and then reduce the occurrence of flight accidents.
probability of birth.
Aviation safety big data mainly includes Quick Access Recorder (Quick Access Recorder, QAR) data, which mainly records various flight parameters of the aircraft during flight; in Flight Operational Quality Assurance (FOQA), QAR The data exceeding the artificially set limit value is recorded as overlimit data. In addition, in the actual research process, the cabin sound data in flight will also be involved. This question mainly involves QAR data, and QAR data is relatively standardized.
In terms of specific research and application of flight quality monitoring, the current research in my country's civil aviation industry is mainly divided into two aspects, one is the research, analysis and application of over-limit events; the other is statistical analysis and application of non-over-limit data. For the study of over-limit events, the over-limit threshold is generally set by specifying the concentrated area of flight parameters, and the flight records exceeding the threshold are found out, and key analysis is carried out to prevent potential hidden dangers from causing serious flight accidents. such analysis is currently a flight quality monitoring effort
The main body, which better guarantees the safety work at this stage, its shortcoming lies in the lack of analysis of the reasons for the overrun. Because not all overruns are caused by human factors, for example, many are caused by special environmental conditions, and may even be caused by the design and manufacturing factors of the aircraft itself, so it is difficult to identify it only through simple overrun analysis; if only based on The management of flight crews by overrun events can easily go astray. QAR overruns can be used as data support for aviation safety management and flight training. At present, it is not inclined to carry out flight training based on only a small amount of QAR overrun data, so the flight quality monitoring work has gradually derived another tendency, that is, to carry out analysis by mining the QAR data of the whole flight segment, and form the flight training of specific personnel. Quality records. Based on flight records under different flight crews, flight routes, airports, and specific flight conditions, through modeling and analysis of data, calculation and evaluation of risk tendencies, targeted safety management is carried out, safety hazards are checked, and safety performance is improved. At present, similar research is mainly to read flight data on a large scale, store and analyze it, form a flight quality service platform, and provide a data basis for risk assessment and trend analysis. The G value is a direct response to the overload situation during the flight of the aircraft. In the landing safety analysis, the G value is usually an important indicator to describe the safety of the moment of landing. The G value at the moment of landing refers to the maximum G value of the data 2 seconds before and 5 seconds after the moment the aircraft touches down.
Based on the above background, ask your team to solve the following questions:
Question *1* : Some QAR data has errors, and the data needs to be preprocessed to remove the false and preserve the true, so as to reduce the impact of the wrong data on the research analysis. Please invite your team to conduct reliability research on the data quality in Annex 1, extract some key data items related to flight safety, and analyze their importance.
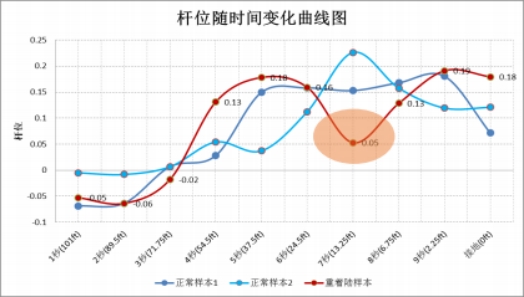
Question *2* : During the entire flight process from takeoff to landing, the aircraft ensures flight safety through a series of flight controls, which mainly include roll control, pitch control, etc. Currently, the country
Domestic airlines monitor the flight control actions by exceeding the limit. Although this monitoring method can quickly distinguish the state deviation of the aircraft, it can only tell the safety management personnel what happened, but cannot immediately find out the cause of the deviation. Therefore, the cause of this deviation can be analyzed through the process change of the joystick. According to Annex 1, please provide a reasonable quantitative description of the flight control. The figure below shows the change curve of the stick position during the 3 landings. The red curve describes the process of a heavy landing (landing G value exceeds a given limit value). The heavy landing is mainly due to an improper release of the stick at low altitude by the flight crew As a result, there is an obvious sag in the red curve 5 seconds before touchdown, which means
It is a loose lever manipulation that needs to be described quantitatively.
Question *3* : The causes of different overruns vary, sometimes specific airports are prone to specific overruns, sometimes specific weather is prone to specific overruns, and sometimes specific pilots are prone to specific overruns . Please study the data in Appendix 2, analyze the different situations of overruns, and study the basic characteristics of different overruns, such as analyzing which routes the aircraft is on or which airports are prone to overruns, etc.
Question *4* : The research on aircraft operation data is generally divided into two categories, one is the operational performance of pilots obtained through the Line Operations Safety Audit (LOSA), and the other is based on the suggestions of relevant scholars. Flight parameters to carry out flight technical assessment. According to attached
Item 3, please establish a mathematical model to explore a flight technique evaluation method based on flight parameters, and analyze the pilot's flying technique. The "different qualifications" in the data sheet represent the different skill levels of the pilot.
Question *5* : With the advancement of technology, it is possible to install a real-time transmission QAR data recording system on civil aviation aircraft in the future. This "real-time flight data" technology can transmit flight flight data to The ground analysis system greatly improves the risk identification ability and prevention level. Assuming that the flight data can be transmitted in real time between land and air, if you are the safety manager of the airline, please establish a real-time automatic early warning mechanism for the airline to prevent possible safety accidents. Combined with the data in Appendix 1, give the simulation results.