1. Project background
Olist is the largest department store in the Brazilian market, small businesses from all over Brazil can sell their products through Olist stores and ship them directly to customers using Olist logistics partners. This article will analyze the order data of the Olist store from September 2016 to August 2018 from the five dimensions of users, merchants, products, sales, and delivery. The purpose is to find out the problems existing on the platform, analyze the reasons, and give suggestions.
Data source: Brazilian E-Commerce Public Dataset by Olist | Kaggle
Dataset introduction: This dataset is provided by Olist and contains information on 100,000 orders made in multiple markets in Brazil from September 2016 to August 2018. Its functionality allows viewing orders from multiple dimensions: from order status, price, payment and shipping performance to customer location, product attributes and finally reviews written by customers and a geolocation dataset that links Brazilian postal codes with latitude/longitude coordinates stand up. The data set contains 9 subsets, and the connection between each data set is as follows:

The dataset contains 9 files:
<1> The file olist_customers_dataset.csv contains 5 fields and 99400 rows. This dataset contains information about customers and their locations. Use it to identify unique customers in the order dataset and find the order delivery location customer_id: the customer ID corresponding to the
order . The key of the order dataset, each order has a unique customer_id
customer_unique_id: the unique ID of the customer
customer_zip_code_prefix: the first five digits of the zip code of the customer
customer_city: the city where the customer is located
customer_state: the state where the customer is located
<2>The file olist_geolocation_dataset.csv contains 5 fields and 1,000,000 rows. This dataset contains Brazilian postal codes and their latitude/longitude coordinate information. Use it to draw a map and find out the distance between the seller and the customer
geolocation_zip_code_prefix: first 5 digits of the zip code
geolocation_lat: latitude geolocation_lng:
longitude
geolocation_city: city name
geolocation_state: state
<3>The file olist_order_items_dataset.csv contains 7 fields, 113000 rows, this dataset includes data about the items purchased in each order order_id
: order ID
order_item_id: serial number, used to identify the number of items contained in the same order
product_id: item ID
seller_id: Seller ID
shipping_limit_date: Seller’s shipping limit date to process the order to the logistics partner
price: Item price
freight_value: Item shipping value (if the order contains multiple items, the shipping value is split between the items)
<4> The file olist_order_payments_dataset.csv contains 5 fields, 104000 rows, this dataset contains data about order payment options
order_id: order ID
payment_sequential: payment sequence (customer can use multiple payment methods to pay for the order, if he does, it will Create a sequence to fit all payments)
payment_type: the payment method chosen by the customer
payment_installments: the number of installments chosen by the customer
payment_value: the transaction amount
<5> The file olist_order_reviews_dataset.csv contains 7 fields, 100000 rows The dataset includes data about reviews made by customers
review_id: unique review ID
order_id: order ID
review_score: rating
review_comment_title: review title from reviews left by customers
review_comment_message: Review information from reviews left by customers
review_creation_date: Displays the date the satisfaction survey was sent to the customer
review_answer_timestamp: Displays the satisfaction survey answer timestamp
<6>The file olist_orders_dataset.csv contains 8 fields, 99400 rows, this is the core dataset, all other information can be found from each order order_id: order
ID
customer_id: customer ID
order_status: order status
order_purchase_timestamp: purchase time
order_approved_at: payment Approval time
order_delivered_carrier_date: order delivery carrier time
order_delivered_customer_date: customer actual order delivery date
order_estimated_delivery_date: estimated delivery date notified to customer when purchasing
<7> The file olist_products_dataset.csv contains 9 fields, 33000 rows, the data set includes data about the products sold by Olist product_id
: unique product ID
product_category_name: the category name of the product, Portuguese
product_name_length: the number of characters extracted from the product name
product_description_length: the number of characters extracted from the product description
product_photos_qty: the number of photos posted by the product
product_weight_g: the weight of the product in grams product_length_cm: the length of the product
in centimeters
product_height_cm: the height of the product in centimeters
product_width_cm: the width of the product in centimeters
<8> The file olist_sellers_dataset.csv contains 4 fields and 3095 rows. This dataset includes data about sellers who complete orders in Olist. Use this to find the seller location and determine which seller completed the sale for each item
seller_id: Seller ID
seller_zip_code_prefix: the first 5 digits of the seller's zip code
seller_city: the city of
the seller seller_state: the state of the seller
<9> The file product_category_name_translation.csv contains 2 fields, 71 lines, to translate the product name from Portuguese to English
product_category_name: Portuguese category name
product_category_name_english: English category name
2. Analysis framework

Analysis tools: MySQL, Power BI, Excel
3. Data cleaning
3.1 Data import
Use MySQL to create a new database in Navicat and import the dataset
3.2 Data type conversion
The original data types in the data set are all varchar, and the data of numbers, currency, and time types need to be converted to data types
-- 数据类型转换
ALTER TABLE olist_geolocation_dataset
	MODIFY geolocation_lat DECIMAL(10,7),
	MODIFY geolocation_lng DECIMAL(10,7);

ALTER TABLE olist_order_items_dataset
	MODIFY order_item_id INT,
	MODIFY shipping_limit_date datetime,
	MODIFY price DECIMAL(10,2),
	MODIFY freight_value DECIMAL(10,2);

ALTER TABLE olist_order_payments_dataset
	MODIFY payment_sequential INT,
	MODIFY payment_installments INT,
	MODIFY payment_value DECIMAL(10,2);

ALTER TABLE olist_order_reviews_dataset
	MODIFY review_score INT,
	MODIFY review_creation_date datetime,
	MODIFY review_answer_timestamp datetime;

ALTER TABLE olist_orders_dataset
	MODIFY order_purchase_timestamp datetime,
	MODIFY order_approved_at datetime,
	MODIFY order_delivered_carrier_date datetime,
	MODIFY order_delivered_customer_date datetime,
	MODIFY order_estimated_delivery_date datetime;

ALTER TABLE olist_products_dataset
	MODIFY product_name_length INT,
	MODIFY product_description_length INT,
	MODIFY product_photos_qty INT,
	MODIFY product_weight_g INT,
	MODIFY product_length_cm INT,
	MODIFY product_height_cm INT,
	MODIFY product_width_cm INT;
You can also directly modify the data type of the field in the design table
3.3 Delete duplicate rows
-- 查看是否有重复行
SELECT customer_id
FROM olist_customers_dataset
GROUP BY customer_id
HAVING count(*) > 1;
SELECT geolocation_zip_code_prefix
FROM olist_geolocation_dataset
GROUP BY geolocation_zip_code_prefix
HAVING count(*) > 1;

It can be seen that one zip code corresponds to multiple latitudes and longitudes. It may be that the platform accurately recorded the location of each customer when placing an order, but it is not conducive to subsequent table connection analysis, so the average value is taken.
SELECT order_id
FROM olist_order_items_dataset
GROUP BY order_id, order_item_id
HAVING count(*) > 1;
SELECT order_id
FROM olist_order_payments_dataset
GROUP BY order_id, payment_sequential, payment_type
HAVING count(*) > 1;

SELECT review_id
FROM olist_order_reviews_dataset
GROUP BY review_id, order_id
HAVING count(*) > 1;

SELECT order_id
FROM olist_orders_dataset
GROUP BY order_id
HAVING count(*) > 1;
SELECT product_id
FROM olist_products_dataset
GROUP BY product_id
HAVING count(*) > 1;

SELECT seller_id
FROM olist_sellers_dataset
GROUP BY seller_id
HAVING count(*) > 1;

SELECT product_category_name
FROM product_category_name_translation
GROUP BY product_category_name
HAVING count(*) > 1;

-- 删除重复值行
CREATE TABLE temp
	SELECT geolocation_zip_code_prefix
		,ROUND(AVG(geolocation_lat), 7) as geolocation_lat
		,ROUND(AVG(geolocation_lng), 7) as geolocation_lng
		,MAX(geolocation_city) as geolocation_city
		,MAX(geolocation_state) as geolocation_state
	FROM olist_geolocation_dataset
	GROUP BY geolocation_zip_code_prefix;
DROP TABLE olist_geolocation_dataset;
ALTER TABLE temp RENAME TO olist_geolocation_dataset;
3.4 Missing value processing
-- 查看缺失值
SELECT count(customer_id)
	,count(customer_id)
	,count(customer_state)
	,count(customer_unique_id)
	,count(customer_zip_code_prefix)
FROM olist_customers_dataset;

SELECT count(geolocation_lat)
	,count(geolocation_lng)
	,count(geolocation_city)
	,count(geolocation_state)
	,count(geolocation_zip_code_prefix)
FROM olist_geolocation_dataset;

SELECT count(order_id)
	,count(order_item_id)
	,count(product_id)
	,count(seller_id)
	,count(shipping_limit_date)
	,count(price)
	,count(freight_value)
FROM olist_order_items_dataset;

SELECT count(order_id)
	,count(payment_type)
	,count(payment_value)
	,count(payment_sequential)
	,count(payment_installments)
FROM olist_order_payments_dataset;


The olist_order_reviews_dataset table can clearly see that there are missing values, but it has no effect on this analysis and no processing is required.
SELECT count(customer_id)
	,count(order_id)
	,count(order_status)
	,count(order_purchase_timestamp)
	,count(order_approved_at)
	,count(order_delivered_carrier_date)
	,count(order_delivered_customer_date)
	,count(order_estimated_delivery_date)
FROM olist_orders_dataset;

According to the query results, the missing data of order_delivered_customer_date, order_approved_at, and order_delivered_carrier_date is relatively small compared with the overall data volume, so choose to delete directly.
SELECT count(product_id)
	,count(product_category_name)
	,count(product_photos_qty)
	,count(product_name_length)
	,count(product_description_length)
	,count(product_weight_g)
	,count(product_width_cm)
	,count(product_height_cm)
	,count(product_length_cm)
FROM olist_products_dataset;

According to the query results, there are more missing data in product_category_name, product_photos_qty, product_name_length, and product_description_length than other missing data, but they are smaller than the overall data volume, so choose to delete directly (because the data in these 4 fields are missing at the same time, However, product_category_name cannot be interpolated with possible values and can only be deleted, so there is no need to add the other 3 fields ).
This analysis does not involve product_weight_g, product_width_cm, product_height_cm, product_length_cm, so it will not be processed.
SELECT count(seller_id)
	,count(seller_city)
	,count(seller_state)
	,count(seller_zip_code_prefix)
FROM olist_sellers_dataset;

SELECT count(product_category_name)
	,count(product_category_name_english)
FROM product_category_name_translation;

You can also sort each field in the table in ascending order in Navicat first, check whether there are Null values, and then query the number of missing values.
-- 删除缺失值
DELETE FROM olist_orders_dataset
WHERE order_approved_at IS NULL
	OR order_delivered_carrier_date IS NULL
	OR order_delivered_customer_date IS NULL;

DELETE FROM olist_products_dataset
WHERE product_category_name IS NULL
	OR product_photos_qty IS NULL
	OR product_name_length IS NULL
	OR product_description_length IS NULL;
3.5 Eliminate outliers

In Navicat, sort the fields in the table in ascending and descending order, and found that there are 2 pieces of data payment_installments are 0, and according to the data definition, the minimum number of installments should be 1, because the outlier data volume is small, so choose to delete it directly .
SELECT payment_type
FROM olist_order_payments_dataset
GROUP BY payment_type;


The query shows that there are orders with undefined payment methods, and there are only 3 data items, which can be deleted directly.
-- 剔除分期数异常值
DELETE FROM olist_order_payments_dataset
WHERE payment_installments = 0
	OR payment_type = 'not_defined';

-- 验证时间逻辑关系
SELECT *
FROM olist_orders_dataset
WHERE order_purchase_timestamp > order_approved_at
	OR order_purchase_timestamp > order_delivered_carrier_date
	OR order_purchase_timestamp > order_delivered_customer_date
	OR order_purchase_timestamp > order_estimated_delivery_date;

According to the query results, there is data that the actual delivery time of the order is before the purchase time, which is unreasonable, so it is deleted directly.
-- 剔除时间异常值
DELETE FROM olist_orders_dataset
WHERE order_purchase_timestamp > order_approved_at
	OR order_purchase_timestamp > order_delivered_carrier_date
	OR order_purchase_timestamp > order_delivered_customer_date
	OR order_purchase_timestamp > order_estimated_delivery_date;
3.6 Time format conversion
According to analysis needs, add date and hour columns:
-- 时间格式转换
ALTER TABLE olist_orders_dataset
	ADD d DATE,
	ADD h VARCHAR(10);

UPDATE olist_orders_dataset
SET d = DATE(order_purchase_timestamp),
	h = DATE_FORMAT(order_purchase_timestamp, '%H');
3.7 Primary key and index
Add a primary key and create an index to improve query speed:
CREATE INDEX idx_d ON olist_orders_dataset(d);
CREATE INDEX idx_h ON olist_orders_dataset(h);
CREATE INDEX idx_payment_type ON olist_order_payments_dataset(payment_type);
CREATE INDEX idx_payment_type_installments ON olist_order_payments_dataset(payment_type, payment_installments);
CREATE INDEX idx_score ON olist_order_reviews_dataset(review_score);
4. Data analysis
4.1 User Analysis
4.1.1 Regional Distribution of Users
-- 用户地区分布散点图
SELECT customer_unique_id, geolocation_lat, geolocation_lng
FROM olist_customers_dataset
LEFT JOIN olist_geolocation_dataset
	ON customer_zip_code_prefix = geolocation_zip_code_prefix
GROUP BY customer_unique_id, geolocation_lat, geolocation_lng;

-- 用户地区分布
SELECT customer_state AS 州
	,COUNT(DISTINCT customer_unique_id) AS 用户数
	,COUNT(DISTINCT customer_unique_id) / SUM(COUNT(DISTINCT customer_unique_id))OVER() AS 占比
FROM olist_customers_dataset
GROUP BY customer_state
ORDER BY 用户数 DESC;
Import the population and GDP data of each state in Brazil into Power BI to facilitate the analysis of the regional distribution of users.

The size of the bubble represents the number of users, and the color depth represents the population of each state

It can be seen that users are concentrated in the coastal areas of southeastern Brazil and near the inland capital, of which nearly 42%Most of the users are from the SP state, and the regional distribution of the number of users in each state is basically consistent with the population distribution and economic development of Brazil. In the subsequent operation process, the platform can be developed according to the characteristics of different regions, and marketing and delivery can be carried out according to the preferences of users in different regions.
4.1.2 User Traffic Analysis
4.1.2.1 Daily active DAU
-- 日活DAU
SELECT d AS 日期
	,COUNT(DISTINCT customer_unique_id) AS DAU
FROM olist_customers_dataset
JOIN olist_orders_dataset
	USING(customer_id)
GROUP BY d
ORDER BY d;

It can be seen that DAUThe overall trend is on the rise. On November 24, 2017, DAU increased to 1132, an increase of 327% from the previous day. According to the query, November 24 is "Black Friday", and South America and other countries will conduct discounts on this day Activities, it can be seen that the activities are very effective.
4.1.2.2 Monthly active MAU
-- 月活MAU
SELECT LEFT(d, 7) AS 月份
	,COUNT(DISTINCT customer_unique_id) AS MAU
FROM olist_customers_dataset
JOIN olist_orders_dataset
	USING(customer_id)
GROUP BY 月份
ORDER BY 月份;

It can be seen that before November 2017, MAU showed a rapid growth trend, and after November 2017, MAU gradually stabilized, indicating that the activity on November 24, 2017 had a significant effect.
4.1.2.3 Active Number of Periods
-- 时段活跃人数
SELECT h AS 时
	,COUNT(DISTINCT customer_unique_id) AS 时段活跃人数
FROM olist_customers_dataset
JOIN olist_orders_dataset
	USING(customer_id)
GROUP BY h
ORDER BY h;

It can be seen that the ordering time of users is concentrated between 9 o'clock and 23 o'clock. Except for sleeping time, users shop online almost at any time, and are not affected by working hours.
The number of active users from 10:00 am to 22:00 pm is significantly higher than the average level, which is the active period of users. Among them, it is speculated that the activity level decreased slightly due to the meal break at 12:00 and 18:00, and the number of active users decreased significantly after 22:00. It began to rise after 5 o'clock the next day, and gradually returned to the normal active level after 9 o'clock. The change trend of the data is in line with the normal work and rest rules of most users, indicating that users will place orders and purchases during their daily free time, rather than specific time periods (such as non-working hours). Platform operators can take corresponding promotional measures in different time periods according to the active time of users.
4.1.3 Payment Analysis
4.1.3.1 Payment method
-- 支付方式
SELECT payment_type as 支付方式, count(DISTINCT order_id) as 订单数
FROM olist_order_payments_dataset
GROUP BY payment_type;

It can be seen that about 75%Most of the orders choose credit card for payment, followed by the Brazilian local offline transaction method boleto, accounting for nearly 20%. These two methods are the mainstream payment methods on the platform.
4.1.3.2 Staging method
-- 分期方式
SELECT payment_installments as 分期数, count(DISTINCT order_id) as 订单数
FROM olist_order_payments_dataset
WHERE payment_type = 'credit_card'
GROUP BY payment_installments;

It can be seen that more than 65%The order of the order chooses the method of installment payment, and the vast majority of orders choose to install within 10 installments. To a certain extent, it shows that the platform recommends installment payment.
4.1.4 User ratings
4.1.4.1 Proportion of user ratings
-- 用户评分
SELECT review_score as 评分, count(*) as 评分数
FROM olist_order_reviews_dataset
GROUP BY review_score;

It can be seen that nearly 60% of users scored 5 points, and more than 10% scored 1 point. Based on the evaluation criteria of 1-2 points for bad reviews, 3 points for medium reviews, and 4-5 points for good reviews, the user ratings are 77.07% positive and 14.69% negative. The overall satisfaction of users is high, but still There is some room for improvement. The reasons for negative reviews can be further analyzed and classified, and the right medicine can be prescribed to improve user experience in a targeted manner. Product quality reasons should be taken off the shelves for rectification in a timely manner, and then put on the shelves after restoring quality, improve after-sales service, return and refund in a timely manner, and service attitude reasons should strengthen customer service training and management.
4.1.4.2 Distribution of evaluation numbers in each time period
-- 用户评价时间
SELECT hour(review_answer_timestamp) as 时, count(*) as 评价数
FROM olist_order_reviews_dataset
GROUP BY 时
ORDER BY 时;

It can be seen that daytime 11From 12 o'clock to 12 o'clock and from 21 o'clock in the evening to 1 o'clock in the morning are the peak periods for user evaluation. Consider launching targeted advertisements on the page after filling in the comments to further promote consumption.
4.1.5 User Hierarchy
4.1.5.1 Distribution of Sales Contributed by Users
-- 用户贡献的销售额分布
SELECT rk / count(*)over() as 用户数累计百分比
	,sum_price as 销售额
	,sum(sum_price)over(order by rk) / sum(sum_price)over() as 销售额累计百分比
FROM (
	SELECT customer_unique_id
		,row_number()over(order by sum(price) desc) as rk
		,sum(price) as sum_price
	FROM olist_customers_dataset
	JOIN olist_orders_dataset
		USING(customer_id)
	JOIN olist_order_items_dataset
		USING(order_id)
	GROUP BY customer_unique_id
) as t;

According to the 80/20 rule, when 80% of an enterprise's revenue comes from 20% of its total customers, the enterprise's customer base is healthy and tends to be stable. The top 20% of users on the platform only contributed 56.63% of the revenue, and nearly 50% of the users contributed 80% of the revenue. It shows that there are too few major customers, and the number of major customers needs to be increased. Therefore, it is necessary to divide customers according to customer value and carry out refined operations.
4.1.5.2 RFM Model User Hierarchy
According to the user's latest consumption time, consumption frequency and consumption amount, the RFM model is constructed, and the users are divided into the following categories:

-- RFM模型用户分层
-- 创建视图,整合所需订单信息
CREATE VIEW order_detail AS
	SELECT d, customer_unique_id, order_id, sum(payment_value) as payment_value
	FROM olist_orders_dataset
	JOIN olist_customers_dataset
		USING(customer_id)
	JOIN olist_order_payments_dataset
		USING(order_id)
	GROUP BY customer_unique_id, d, order_id;

-- 构造R值
CREATE VIEW Recency AS
	SELECT customer_unique_id
		,if(recency <= avg(recency)over(), 1, 0) as R
	FROM (
		SELECT customer_unique_id
			, max(d) as recent_d
			, datediff(max(max(d))over(), max(d)) as recency
		FROM order_detail
		GROUP BY customer_unique_id
	) as t;

-- 构造F值
CREATE VIEW Frequency AS
	SELECT customer_unique_id
		,if(order_cnt >= avg(order_cnt)over(), 1, 0) as F
	FROM (
	SELECT customer_unique_id, count(*) as order_cnt
	FROM order_detail
	GROUP BY customer_unique_id
	) as t;

-- 构造M值
CREATE VIEW Monetary AS
	SELECT customer_unique_id
		,if(sum(payment_value) > avg(sum(payment_value))over(), 1, 0) as M
	FROM order_detail
	GROUP BY customer_unique_id;

-- 构建RFM模型
CREATE VIEW RFM AS
	SELECT *
		,CASE WHEN R = 1 AND F = 1 AND M = 1 THEN '重要价值'
			WHEN R = 1 AND F = 0 AND M = 1 THEN '重要发展'
			WHEN R = 0 AND F = 1 AND M = 1 THEN '重要保持'
			WHEN R = 0 AND F = 0 AND M = 1 THEN '重要挽留'
			WHEN R = 1 AND F = 1 AND M = 0 THEN '一般价值'
			WHEN R = 1 AND F = 0 AND M = 0 THEN '一般发展'
			WHEN R = 0 AND F = 1 AND M = 0 THEN '一般保持'
			WHEN R = 0 AND F = 0 AND M = 0 THEN '一般挽留'
		END as 用户类型
	FROM Recency
	JOIN Frequency
		USING(customer_unique_id)
	JOIN Monetary
		USING(customer_unique_id);

-- 各类型用户数量、贡献价值
SELECT 用户类型
	,count(DISTINCT customer_unique_id) as 用户数量
	,sum(order_price) as 贡献价值
FROM (
	SELECT 用户类型, customer_unique_id, order_id
		,sum(price) as order_price
	FROM RFM
	JOIN order_detail
		USING(customer_unique_id)
	JOIN olist_order_items_dataset
		using(order_id)
	GROUP BY 用户类型, customer_unique_id, order_id
) as t
GROUP BY 用户类型;

In terms of quantity, general development users and general retention users are the largest, accounting for more than 30%, followed by important development users and important retention users, accounting for more than 10%, and the total proportion of development and retention users is more than 90%. There are fewer types of users. It shows that users of this platform generally have low consumption frequency and relatively long recent consumption time. Most users are low-to-medium value users, and there is sufficient room for development and optimization.
In terms of contribution value, the contribution value of important value users and important retaining users accounted for less than 5%, more than 60% of sales came from important developing users and important retaining users, and another 30% of sales came from general developing users and general retaining users users, indicating that although most of the platform are low-frequency consumption users, the overall contribution value of these users is relatively high. For important development users and important retention users, you should take the initiative to contact, give preferential treatment, increase the repurchase rate, analyze the reasons for user loss, and call them back through targeted operating means. For general development users and general retention users, free trials should be added to increase user interest, increase the retention rate of new users, and at the same time analyze the reasons for user loss and recall them in a targeted manner.
-- RFM关系散点图
SELECT customer_unique_id, recency, frequency, monetary
FROM (
	SELECT customer_unique_id
		, datediff(max(max(d))over(), max(d)) as recency
	FROM order_detail
	GROUP BY customer_unique_id
) as t_r
JOIN (
	SELECT customer_unique_id, count(*) as frequency
	FROM order_detail
	GROUP BY customer_unique_id
) as t_f
	USING(customer_unique_id)
JOIN (
	SELECT customer_unique_id, sum(payment_value) as monetary
	FROM order_detail
	GROUP BY customer_unique_id
) as t_m
	USING(customer_unique_id);

Judging from the RFM relationship diagram, R has basically no relationship with F and M. This is also because the repurchase rate of most users is very low, and measures such as membership system should be adopted to increase the repurchase rate. However, there is a certain negative correlation between F and M, indicating that users with high payment amounts mostly make single purchases, and the recall of these users should be strengthened, while high-frequency consumption users always pay low amounts, and the association should be optimized for these users Sales, increase its customer unit price.
4.1.5.3 Category Preferences of Various Types of Users
-- 各类型用户品类偏好
SELECT 用户类型, product_category_name as 商品品类
	,sum(price) as 消费金额
	,row_number()over(partition by 用户类型 order by sum(price) DESC) as rk
FROM olist_products_dataset
JOIN olist_order_items_dataset
	USING(product_id)
JOIN order_detail
	USING(order_id)
JOIN RFM
	USING(customer_unique_id)
GROUP BY 用户类型, product_category_name;

Through the perspective analysis of the top ten product categories of various types of user consumption, it can be seen that categories such as health and beauty, household items, and sports and leisure appear in the forefront of various user consumption, indicating that these categories are popular among the public and are suitable for all types of products. promotions and promotions for certain types of users, while computers, stationery, and small household appliances are niche popular categories, which are more popular for specific types of users, and the recommendation effect for specific user groups is better.
4.2 Merchant Analysis
4.2.1 Regional Distribution of Merchants
-- 商家地区分布散点图
SELECT seller_id, geolocation_lat, geolocation_lng
FROM olist_sellers_dataset
JOIN olist_geolocation_dataset
	ON seller_zip_code_prefix = geolocation_zip_code_prefix
GROUP BY seller_id, geolocation_lat, geolocation_lng;

-- 商家地区分布
SELECT seller_state AS 州
	, COUNT(DISTINCT seller_id) AS 商家数
	, COUNT(DISTINCT seller_id) / SUM(COUNT(DISTINCT seller_id))OVER() AS 占比
FROM olist_sellers_dataset
GROUP BY seller_state
ORDER BY 商家数 DESC;

The size of the bubble indicates the number of businesses, and the shade of the color indicates the population of each state

It can be seen that merchants are concentrated in the coastal areas of southeast Brazil and near the inland capital, and nearly 60% of them are from the SP state. The regional distribution of the number of merchants in each state is basically consistent with the population distribution and economic development of Brazil.

The regional distribution of merchants is not exactly the same as that of users, which is mainly reflected in the fact that the proportion of merchants from SP states is nearly 20% higher than that of users.
4.2.2 Merchant Orders and Sales
-- 商家订单量及销售额
SELECT seller_id, seller_state
	,count(DISTINCT order_id) as 订单量
	,sum(price) as 销售额
	,CASE
		WHEN count(DISTINCT order_id) <= 20 THEN '(0,20]'
		WHEN count(DISTINCT order_id) <= 100 THEN '(20,100]'
		WHEN count(DISTINCT order_id) <= 500 THEN '(100,500]'
		WHEN count(DISTINCT order_id) <= 1000 THEN '(500,1000]'
		ELSE '(1000,+∞)'
	END as 订单量区间
	,CASE
		WHEN sum(price) <= 1000 THEN '(0,1000]'
		WHEN sum(price) <= 10000 THEN '(1000,10000]'
		WHEN sum(price) <= 100000 THEN '(10000,100000]'
		ELSE '(100000,+∞)'
	END as 销售额区间
FROM olist_sellers_dataset
JOIN olist_order_items_dataset
	USING(seller_id)
GROUP BY seller_state, seller_id; 

It can be seen that during the analysis period, the order volume of merchants is generally low. There are 2,885 merchants whose order volume is less than 20, accounting for 74.22%. The minimum order volume is 1; only 10 merchants have an order volume of more than 1,000 orders , all from the SP state, of which the largest order was 1854.

It can be seen that during the analysis period, less than 10% of the merchants have sales of more than 10,000, and the largest sales are 229,472.63 reals; most of the merchants have sales below 10,000, and more than half of the merchants sell The amount is within 1,000, and the minimum sales amount is 3.5 reais. Combined with the order volume, the merchants on the platform are mainly small merchants.
4.2.3 Merchant Average Score
-- 商家平均得分
SELECT seller_id
	,avg(review_score) as 平均得分
	,CASE WHEN avg(review_score) < 2 THEN '[1,2)'
		WHEN avg(review_score) < 3 THEN '[2,3)'
		WHEN avg(review_score) < 4 THEN '[3,4)'
		ELSE '[4,5]'
	END as 平均得分区间
FROM olist_order_reviews_dataset
JOIN olist_order_items_dataset
	USING(order_id)
GROUP BY seller_id; 

It can be seen that nearly 65% of merchants have an average score of 4 points or more, and merchants with an average score of less than 3 points account for only about 11%, and the average score of most merchants is in the range of 3.75-5, which is more realistic, indicating that the platform has never been The product-to-merchant service is relatively complete, and there are basically no problems in the whole process.
4.3 Commodity Analysis
4.3.1 Number and proportion of products in each category
-- 商品总数及商品种类数
SELECT '商品总数' as 类别, count(DISTINCT product_id) as 数量
FROM olist_products_dataset
union all
SELECT '商品种类数' , count(DISTINCT product_category_name)
FROM olist_products_dataset;

-- 各品类商品数量及占比
SELECT product_category_name, count(*) as 商品数
	,concat(round(count(*) / sum(count(*))over() * 100, 2), '%') as 占比
FROM olist_products_dataset
GROUP BY product_category_name;

According to the query, as of the analysis node, the total number of products on the platform is 32341, and the number of product types is 73.

The number of products (the number of subcategories) in many categories is small, which may result in insufficient products to meet the selection needs of users.
4.3.2 Sales and sales of each category
-- 各品类的销量、销售额、单价
SELECT product_category_name
	,count(*) as 销量
	,sum(price) as 销售额
	,sum(sum(price))over(order by sum(price) DESC) / sum(sum(price))over() as 累计销售额占比
	,round(avg(price), 2) as 单价
	,CASE WHEN avg(price) <= 100 THEN '(0,100]'
		WHEN avg(price) <= 200 THEN '(100,200]'
		WHEN avg(price) <500 THEN '(200,500]'
		ELSE '(500,+∞)'
	END as 单价区间
FROM olist_products_dataset
JOIN olist_order_items_dataset
	USING(product_id)
GROUP BY product_category_name;


From the above two figures, we can see that the sales and sales trends of all categories on the platform are basically the same, and the top sales and sales are basically categories with low unit prices. Only a few users bought high-priced categories, indicating that the platform is based on The parity strategy is the main one. Categories with an average unit price below 200 accounted for 86.31%. It can be seen that the product price positioning of this platform is in the lower middle range.
Therefore, attracting merchants with lower commodity prices, such as stationery, children's toys, and daily necessities, is the focus of the platform's new attraction. In the case of sufficient resources, consider cultivating high-priced commodity merchants.
High-priced commodities: It can increase the unit price of customers and create a high-end brand image. The high prices are concentrated in gift watches and clocks, garden tools and health and beauty products. The consumption time is more concentrated in the shopping festival, and the consumption places are concentrated in Rio and Sao Paulo. For high-priced products, discount activities should be added to the shopping festival.

It can be seen that the top 23.29% of categories contributed 80.69% of sales, which is in line with the 28th rule. The platform can divide products into three categories: A, B, and C according to the proportion of sales of 70%, 20%, and 10%, put key management resources in category A, allocate less resources to category C or cut off some sales Class C with too low quota to achieve the optimal state of resource management, thereby increasing platform revenue. At the same time, combined with the previous analysis of the number of commodities in each category, some category C commodities with too few commodities can be directly cut off, and the number of commodities (subcategories) of category A and B commodities can be enriched.
4.3.4 Sales and Sales Top 10 Categories

The top ten sales categories are household products, health and beauty, sports and leisure, furniture decoration, computer accessories, household utensils, watch gifts, telephones, gardening tools, and automotive supplies, accounting for 64.54% of the total sales.
The top ten sales categories are health and beauty, watch gifts, home products, sports and leisure, computer accessories, home decoration, cool things, household utensils, car supplies, and gardening tools, accounting for 63.20% of the total sales.
For these categories, an expansion marketing strategy can be adopted to attract merchants of the same category to settle in, increase product types, increase advertising and traffic tilt, add discount promotions, create hot-selling products among hot-selling products, and use hot-selling products to drive the entire category and even the whole world. platform sales. Properly prepare more inventory to reduce business losses caused by out-of-stock. In addition, attention should be paid to cultivating users' habit of repurchasing, including but not limited to setting up membership recharge, points system, proactively contacting old users (distributing coupons), and regular discount promotions.
4.3.4 Sales and sales of each commodity
-- 各商品的销量、销售额、单价
SELECT product_id
	,count(*) as 销量
	,sum(price) as 销售额
	,round(avg(price), 2) as 单价
	,CASE WHEN avg(price) <= 100 THEN '(0,100]'
		WHEN avg(price) <= 200 THEN '(100,200]'
		WHEN avg(price) <= 500 THEN '(200,500]'
		WHEN avg(price) <= 1000 THEN '(500,1000]'
		ELSE '(1000,+∞)'
	END as 单价区间
FROM olist_order_items_dataset
GROUP BY product_id;


It can be seen that the sales volume and sales head effect of the products are obvious, the sales volume is seriously polarized, and the platform products fail to meet the needs of users well.

It can be seen that the sales of products with a unit price in the range of (0,100] are the best, accounting for 63.04%, and sales accounted for 26.44%, ranking second; the sales of products with a unit price in the range of (100,200] are the highest, accounting for 28.87%. The sales volume accounted for 24.73%, ranking second. It shows that the products in the price range (0,100] are the most popular among users, but the products in the (100,200] range contribute the most to the platform's sales. The platform customers are mainly low-consumption and medium-sized Consumer groups.
4.3.5 Product Details
-- 商品详情
SELECT product_id
	,product_photos_qty
	,product_description_length
FROM olist_products_dataset
JOIN olist_order_items_dataset
	USING(product_id)
GROUP BY product_id, product_photos_qty, product_description_length;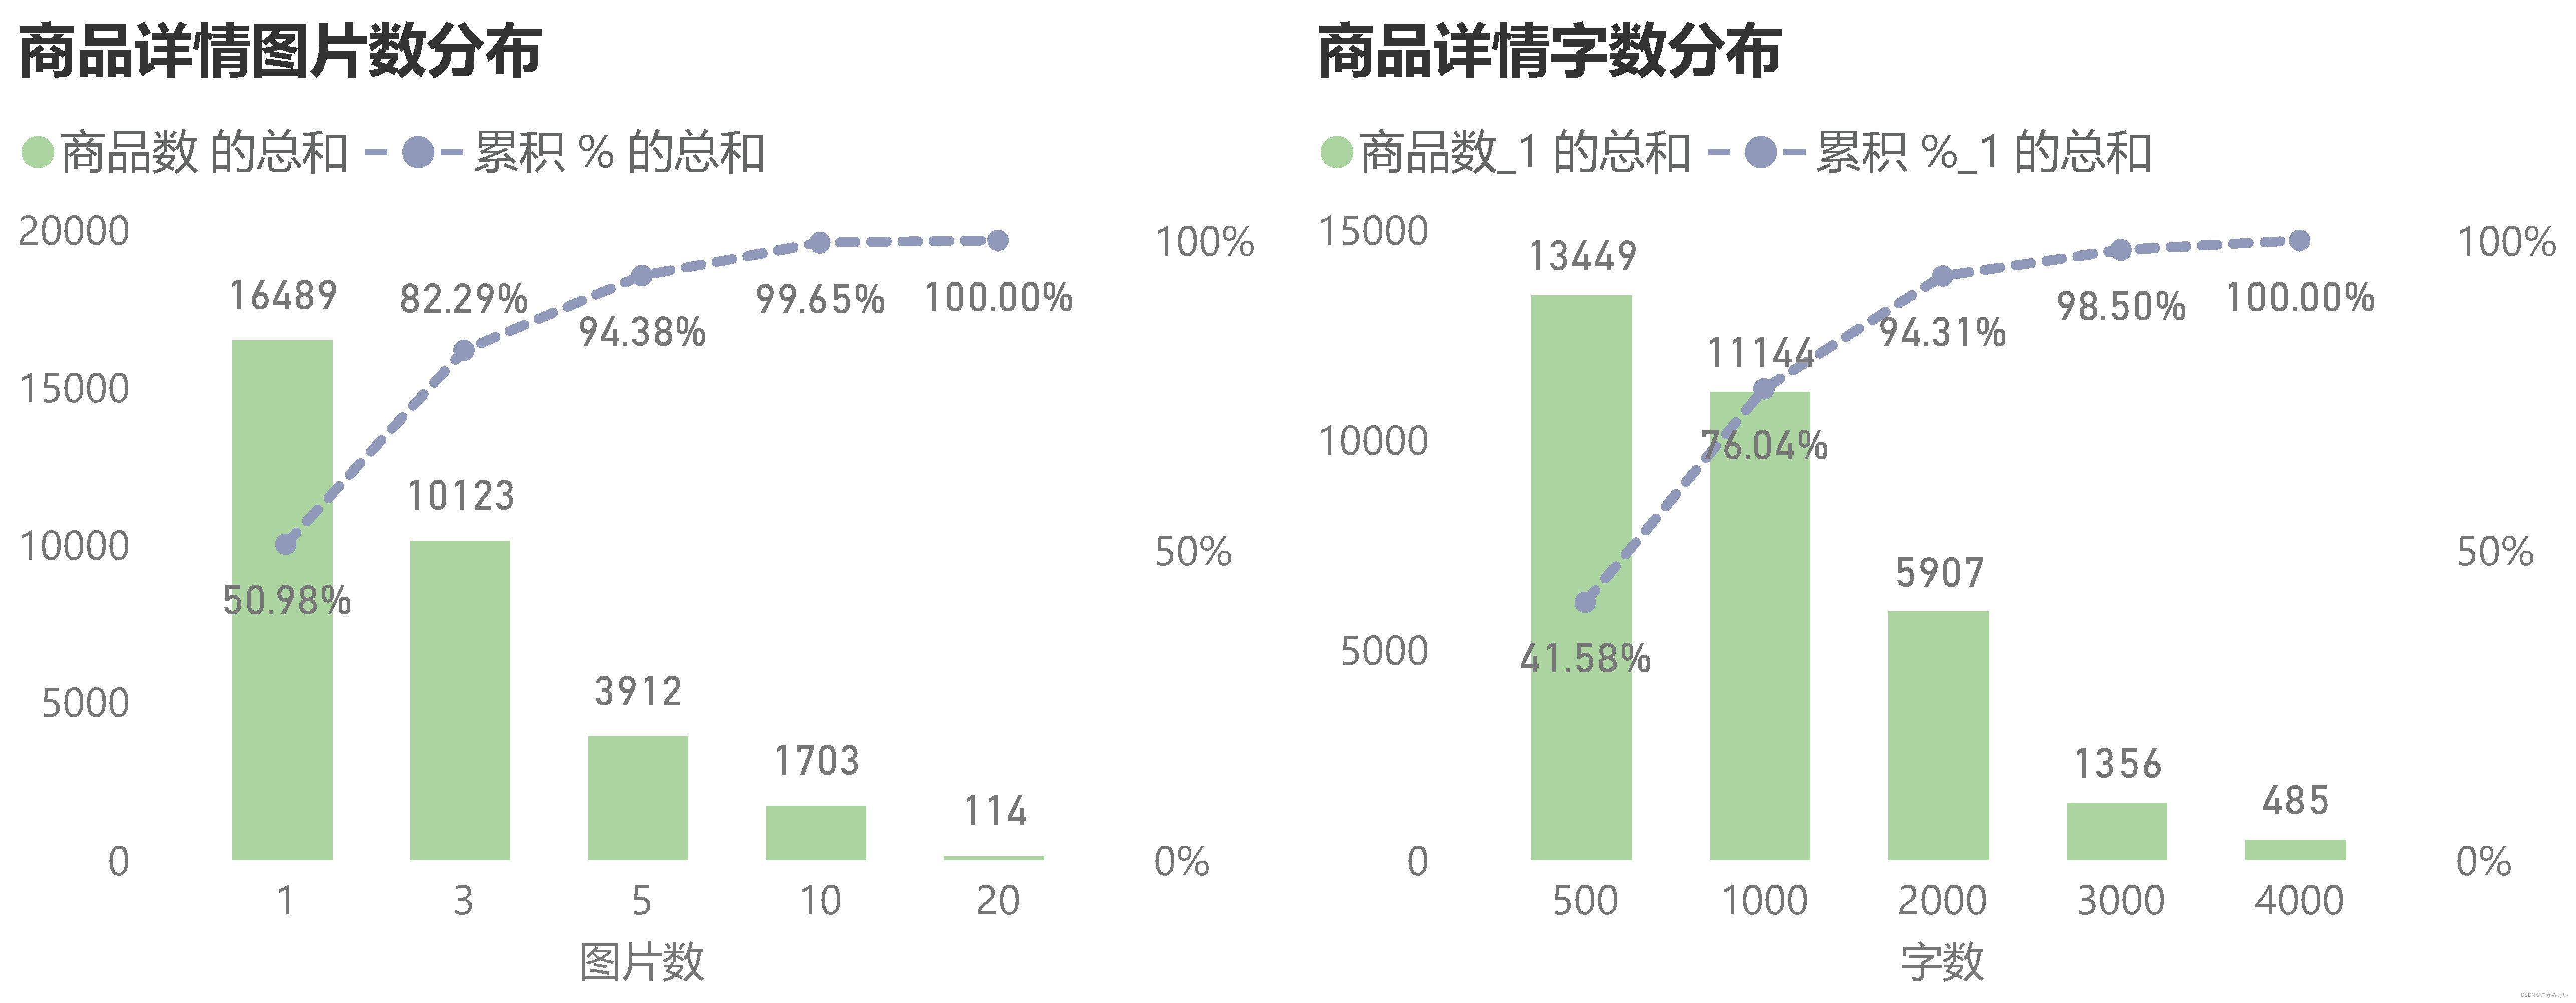
It can be seen that the picture description and text description of most product details are relatively simple. 50.98% of the products have only one picture, 94.38% of the products have no more than 5 pictures, and 41.58% of the product descriptions do not exceed 500 words. The introduction of too simple product details will make customers not understand and distrust the product parameters and selling points, thereby reducing purchases.
The platform should remind merchants to take high-definition physical pictures of the product and enrich the description of the product detail page. It can provide a standardized tutorial for writing product detail descriptions, or provide product detail page writing services.
4.4 Analysis of sales links
4.4.1 Sales Overview
-- 总销量、总销售额、客单价
SELECT count(product_id) as 总销量
	,sum(price) as 总销售额
	,round(sum(price) / count(DISTINCT customer_unique_id), 2) as 客单价
FROM olist_orders_dataset
JOIN olist_customers_dataset
	USING(customer_id)
JOIN olist_order_items_dataset
	USING(order_id);

As of the analysis node, the total sales volume of products on the platform is 109,994, the total sales volume is 13,200,068.23 reals, and the unit price per customer is 141.66 reals.
4.4.2 Sales and Sales in Different Time Dimensions
4.4.2.1 Years
-- 年销量、销售额
SELECT year(d) as 年
	,count(product_id) as 销量
	,sum(price) as 销售额
FROM olist_orders_dataset
JOIN olist_order_items_dataset
	USING(order_id)
GROUP BY year(d);

Due to the incomplete order data in 2016 and 2018, it is impossible to calculate the exact year-on-year growth rate, but it can be seen that the overall sales and sales of the platform are steadily increasing.
4.4.2.2 months
-- 月销量、销售额、环比
SELECT left(d, 7) as 月
	,count(product_id) as 销量
	,sum(price) as 销售额
	,round(sum(price) / lag(sum(price))over(order by left(d, 7)) - 1, 4) as 环比
FROM olist_orders_dataset
JOIN olist_order_items_dataset
	USING(order_id)
WHERE left(d, 7) not in ('2016-09', '2016-12')
GROUP BY 月;

(Because the sales and sales in September and December 2016 were too low, these two months were removed)
Overall trend: Sales volume and sales volume are basically the same with each month. The sales volume and sales volume of the platform increased rapidly in 2016-2017, and the growth rate slowed down after November 2017.
2017: The overall sales volume and sales volume showed an upward trend, with a small peak in March and May, and reached its peak in November. There are only three months of sales and sales decline in April, June, and December in the whole year. Compared with January, the sales volume in December has increased by 6.8 times, and the sales volume has increased by 6.5 times.
2018: Sales fluctuated around 900,000. The overall sales in June-August were lower than those in March-May, which to a certain extent can explain the signs of negative growth.

Festive: It is easy to see that the sales fluctuate in a festive manner from the chain ratio over time. Carnival from February to March, Mother’s Day in May, Brazilian Valentine’s Day in June, Father’s Day in August, Black Friday in November, Christmas in December, etc. Sales will increase during or on the eve of festivals, as consumers choose to focus on festival consumption , so the sales of the previous month and the following month related to the festival decreased.
4.4.2.3 Weeks
-- 周销量、销售额
SELECT date_format(d, '%W') as 周
	,count(product_id) as 销量
	,sum(price) as 销售额
FROM olist_orders_dataset
JOIN olist_order_items_dataset
	USING(order_id)
GROUP BY 周;

It can be seen that users are keen on online shopping on weekdays, and sales and sales on weekends have dropped significantly. Weekday sales changed in a small range, with a month-on-month decrease of 2.19%-4.46%, the lowest on Saturday, and a drop of nearly 25% from Friday, a relatively large drop.
-- 周、时段维度下销量热力图
SELECT h
	,MAX(IF(w = 'Monday', 销量, 0)) AS 星期一
	,MAX(IF(w = 'Tuesday', 销量, 0)) AS 星期二
	,MAX(IF(w = 'Wednesday', 销量, 0)) AS 星期三
	,MAX(IF(w = 'Thursday', 销量, 0)) AS 星期四
	,MAX(IF(w = 'Friday', 销量, 0)) AS 星期五
	,MAX(IF(w = 'Saturday', 销量, 0)) AS 星期六
	,MAX(IF(w = 'Sunday', 销量, 0)) AS 星期日
FROM (
	SELECT h
		,DATE_FORMAT(d,'%W') AS w
		,COUNT(product_id) AS 销量
	FROM olist_orders_dataset
	JOIN olist_order_items_dataset
	USING(order_id)
	GROUP BY w, h
) AS t1
GROUP BY h
ORDER BY h;


By counting the heat distribution of sales in the dimensions of week and time period, it can also be found that the sales volume on weekdays and weekends is significantly different. During weekdays, the sales volume is the highest from 10:00 to 17:00, and the sales volume returns to a higher level after 18:00 on Sunday.
4.4.2.4 days
-- 日销量、销售额
SELECT date_format(d, '%d') as 日
	,count(product_id) as 销量
	,sum(price) as 销售额
FROM olist_orders_dataset
JOIN olist_order_items_dataset
	USING(order_id)
GROUP BY 日;

-- 每日销量、销售额
SELECT d as 日期
	,count(product_id) as 销量
	,sum(price) as 销售额
FROM olist_orders_dataset
JOIN olist_order_items_dataset
	USING(order_id)
GROUP BY d;

It can be seen that the daily sales fluctuated in a small range around 450,000, and the sales and sales at the end of the month decreased significantly.

It can be seen that the daily sales and sales are generally on the rise. On November 24, 2017, the order volume soared to more than 1,000 orders, and the sales soared. This is because November 24 is "Black Friday". South America and other countries will carry out discount promotions on that day, and it can be seen that the activities are very effective.
4.4.2.5 Period
-- 时段销量、销售额
SELECT h as 时
	,count(product_id) as 销量
	,sum(price) as 销售额
FROM olist_orders_dataset
JOIN olist_order_items_dataset
	USING(order_id)
GROUP BY h;

It can be seen that the change trend of sales volume and sales volume in each time period is consistent with the change trend of the number of active people in the previous time period. The ordering time of users is concentrated between 9 o'clock and 23 o'clock. Except for sleeping time, users shop online almost at any time, and are not affected by working hours. Influence.
From 10:00 am to 22:00 pm is the active period for users, and the sales volume and sales volume are significantly higher than the average level. Among them, it is speculated that the sales volume and sales volume decreased slightly due to the meal break at 12:00 am and 18:00 pm, and the sales volume and sales volume after 22:00 am. It dropped significantly, and began to rise after 5:00 the next day, and gradually returned to a higher level after 9:00.
4.4.3 Sales Distribution Contributed by Different Regions
-- 各州贡献的销售额分布
SELECT customer_state as 州
	,sum(price) as 销售额
	,concat(sum(sum(price))over(order by sum(price) DESC) / sum(sum(price))over() * 100, '%') as 销售额累计占比
FROM olist_customers_dataset
JOIN olist_orders_dataset
	USING(customer_id)
JOIN olist_order_items_dataset
	USING(order_id)
GROUP BY customer_state;

-- 各城市贡献的销售额分布
SELECT customer_state as 州
	,customer_city as 城市
	,sum(price) as 销售额
	,concat(round(sum(sum(price))over(order by sum(price) DESC) / sum(sum(price))over() * 100, 2), '%') as 销售额累计占比
	,round(sum(price) / count(DISTINCT customer_unique_id), 2) as 客单价
FROM olist_customers_dataset
JOIN olist_orders_dataset
	USING(customer_id)
JOIN olist_order_items_dataset
	USING(order_id)
GROUP BY customer_state, customer_city; 

The top seven states contributed more than 80% of the sales, the top ten cities contributed more than 1/3 of the sales, and the top two Sao Paulo (186w) and Rio de Janeiro (95w) together contributed more than 1/5 of the sales Well, the unit price per customer in Rio de Janeiro (150.22) is significantly higher than that in Sao Paulo (128.05), indicating that the consumption level in Rio de Janeiro is higher.
Daily operations should focus on changes in sales in the top ten cities. When doing activities, we should first increase the investment in advertising and traffic in Sao Paulo and Rio de Janeiro, and give priority to promotion of new products in Rio de Janeiro, which has higher spending power. If possible, priority should be given to establishing general warehouses in Sao Paulo and Rio de Janeiro to stock up, reduce transportation costs, shorten transportation time, and improve customer satisfaction.
4.4.4 Repurchase rate
-- 复购率
SELECT concat(round(sum(if(下单数 > 1, 1, 0)) / count(*) * 100, 2), '%') as 复购率
FROM (
	SELECT count(DISTINCT order_id) as 下单数
	FROM olist_orders_dataset
	JOIN olist_customers_dataset
		USING(customer_id)
	GROUP BY customer_unique_id
) as t;

-- 月内复购率(=月内重复购买人数/月内购买人数)
SELECT 月份
	,concat(round(sum(if(下单数 > 1, 1, 0)) / count(*) * 100, 2), '%') as 复购率
FROM (
	SELECT left(d, 7) as 月份
		,count(DISTINCT order_id) as 下单数
	FROM olist_orders_dataset
	JOIN olist_customers_dataset
		USING(customer_id)
	GROUP BY 月份, customer_unique_id
) as t
GROUP BY 月份;


It can be seen that the loyalty of platform users is very low, and the overall repurchase rate is only 3.00%. urgently need to be improved. Platform operations should implement more activities to activate old users, such as member recharge system, repurchase discount, etc.
4.5 Delivery Situation Analysis
The overall delivery level is average compared with domestic e-commerce platforms. It takes an average of 3.23 days from the user's order to the merchant's delivery, 9.33 days on average in transit, 12.57 days from the user's order to the receipt of the product, and as many as 8.12% of orders are delayed. On the platform, the slowest delivery time was 125.78 days, the slowest logistics time was 205.19 days, the slowest delivery time was 209.63 days, and the maximum delay time was 188.98 days, which was too long.
4.5.1 Order response time
-- 订单响应时长(下单-审批)
SELECT round(timestampdiff(second, order_purchase_timestamp, order_approved_at) / 3600, 2) as 订单响应时长
FROM olist_orders_dataset;

-- 订单平均、最大响应时长
SELECT round(avg(timestampdiff(second, order_purchase_timestamp, order_approved_at)) / 3600, 2) as 平均响应时长
	,round(max(timestampdiff(second, order_purchase_timestamp, order_approved_at)) / 3600, 2) as 最大响应时长
FROM olist_orders_dataset;


The average order response time is 10.29 hours, and the maximum response time is 741.44 hours (30.89 days). 82.51% of the orders start to be approved within 24 hours after the user places the order. The platform can optimize the order review process based on this result, thereby improving user satisfaction.
4.5.2 Order delivery time
-- 订单发货时长(下单-发货)
SELECT round(timestampdiff(second, order_purchase_timestamp, order_delivered_carrier_date) / 86400, 2) as 订单发货时长
FROM olist_orders_dataset;

-- 订单平均、最大发货时长
SELECT round(avg(timestampdiff(minute, order_purchase_timestamp, order_delivered_carrier_date) / 1440), 2) as 平均发货时长
	,round(max(timestampdiff(minute, order_purchase_timestamp, order_delivered_carrier_date) / 1440), 2) as 最大发货时长
FROM olist_orders_dataset;

-- 订单延期发货率
SELECT concat(round(avg(case when 发货时间 > 限制发货时间 then 1 else 0 end) * 100, 2), '%') as 延期发货率
FROM (
	SELECT max(order_delivered_carrier_date) as 发货时间
		,max(shipping_limit_date) as 限制发货时间
	FROM olist_orders_dataset
	JOIN olist_order_items_dataset
		USING(order_id)
	GROUP BY order_id
) as t;


The average time from placing an order to delivery is 3.23 days, and the highest time is 125.78 days. 82.41% of the orders are shipped within 5 days after the order is placed, and 9.04% of the orders are delayed.
4.5.3 Logistics transit time
-- 物流在途时长(发货-收货)
SELECT round(timestampdiff(second, order_delivered_carrier_date, order_delivered_customer_date) / 86400, 2) as 物流在途时长
FROM olist_orders_dataset;

-- 平均、最大物流在途时长
SELECT round(avg(timestampdiff(minute, order_delivered_carrier_date, order_delivered_customer_date) / 1440), 2) as 平均物流时长
	,round(max(timestampdiff(minute, order_delivered_carrier_date, order_delivered_customer_date) / 1440), 2) as 最大物流时长
FROM olist_orders_dataset;


The average logistics time is 9.33 days, and the highest time is 205.19 days. 84.40% of the orders arrive within 15 days after delivery to the carrier.
4.5.4 Order delivery time
-- 订单交付时长(下单-收货)
SELECT round(timestampdiff(second, order_purchase_timestamp, order_delivered_customer_date) / 86400, 2) as 订单交付时长
FROM olist_orders_dataset;

-- 订单平均、最大交付时长
SELECT round(avg(timestampdiff(minute, order_purchase_timestamp, order_delivered_customer_date) / 1440), 2) as 平均交付时长
	,round(max(timestampdiff(minute, order_purchase_timestamp, order_delivered_customer_date) / 1440), 2) as 最大交付时长
FROM olist_orders_dataset;


The delivery time of orders is generally distributed in a positive skew, most of which are concentrated in the range of 3-16 days. The average delivery time is 12.57 days, and the highest time is 209.63 days. 81.11% of the orders are delivered within 18 days after the order is placed.
4.5.4.1 Order Delivery—Month
-- 订单交付情况—月份
SELECT left(d, 7) as 月份
	,round(avg(timestampdiff(second, order_purchase_timestamp, order_delivered_carrier_date) / 86400), 2) as 平均发货时长
	,round(avg(timestampdiff(second, order_delivered_carrier_date, order_delivered_customer_date) / 86400), 2) as 平均物流时长
	,concat(round(avg(case when order_delivered_customer_date > order_estimated_delivery_date then 1 else 0 end) * 100, 2), '%') as 延期订单占比
FROM olist_orders_dataset
GROUP BY 月份;

In February and March and November and December when there are many orders, the average logistics time has risen sharply to 13-17 days, with an increase of up to 55%, and the proportion of overtime delivery orders has risen to 14-21%. Taking March 2018 as an example, the average delivery time was 3.33 days, with little change, but the average logistics time rose to 16.3 days, and overtime delivery orders rose to 21.36%.
4.5.4.2 Order Delivery Status - Merchant
-- 各商家平均发货、物流时长
SELECT seller_id
	,round(avg(timestampdiff(second, order_purchase_timestamp, order_delivered_carrier_date) / 86400), 2) as 平均发货时长
	,round(avg(timestampdiff(second, order_delivered_carrier_date, order_delivered_customer_date) / 86400), 2) as 平均物流时长
FROM olist_orders_dataset
JOIN (
	SELECT DISTINCT order_id, seller_id
	FROM olist_order_items_dataset
) as t
	USING(order_id)
GROUP BY seller_id;

Among the 2,967 merchants, 63 have an average delivery time of more than 30 days. For merchants that take a long time to stock up, the platform can help them optimize shipments; for merchants that take a long time to express, they can consider adding pre-sales, off-peak sales, stocking up in advance, and using faster express delivery to shorten the delivery time. It is recommended that merchants count the average daily sales volume of key products based on sales records, comprehensively consider their own procurement frequency, prepare inventory for a certain period of time in advance, cooperate with multiple logistics companies, set up warehouses in multiple places, and deliver goods nearby.
4.5.4.3 Order delay delivery time
-- 延期交付时长
SELECT order_id
	,round(timestampdiff(second, order_purchase_timestamp, order_delivered_carrier_date) / 86400, 2) as 订单发货时长
	,round(timestampdiff(second, order_delivered_carrier_date, order_delivered_customer_date) / 86400, 2) as 物流在途时长
	,round(timestampdiff(second, order_estimated_delivery_date, order_delivered_customer_date) / 86400, 2) as 延期时长
FROM olist_orders_dataset
WHERE order_delivered_customer_date > order_estimated_delivery_date;

-- 订单平均、最大延期交付时长
SELECT round(avg(timestampdiff(minute, order_estimated_delivery_date, order_delivered_customer_date) / 1440), 2) as 平均延期时长
	,round(max(timestampdiff(minute, order_estimated_delivery_date, order_delivered_customer_date) / 1440), 2) as 最大延期时长
FROM olist_orders_dataset
WHERE order_delivered_customer_date > order_estimated_delivery_date;

-- 延期交付率
SELECT concat(round(avg(case when order_delivered_customer_date > order_estimated_delivery_date then 1 else 0 end) * 100, 2), '%') as 延期交付率
FROM olist_orders_dataset;

-- 大额订单延期交付情况
SELECT order_id
	,round(timestampdiff(second, order_purchase_timestamp, order_delivered_carrier_date) / 86400, 2) as 订单发货时长
	,round(timestampdiff(second, order_delivered_carrier_date, order_delivered_customer_date) / 86400, 2) as 物流在途时长
	,round(timestampdiff(second, order_estimated_delivery_date, order_delivered_customer_date) / 86400, 2) as 延期时长
FROM olist_orders_dataset
JOIN (
	SELECT order_id
	FROM olist_order_items_dataset
	GROUP BY order_id
	HAVING sum(price) > 1000
) as t
	USING(order_id)
WHERE order_delivered_customer_date > order_estimated_delivery_date;


The average delay time of orders is 9.55 days, the highest time is 188.98 days, 8.12% of orders are delayed in delivery, and 82.32% of orders are delayed in delivery within 15 days.

Among the 7,823 postponed orders, 360 orders were seriously overdue (more than 30 days), most of which were delayed due to the long logistics time, and a few orders were due to the long preparation time. For the delayed delivery caused by the merchant's long preparation time, it is necessary to contact the merchant to find out the reason, and the platform can help them optimize the shipment; for the delayed delivery caused by the express delivery, you can consider adding pre-sales, off-peak sales, and advance delivery of the product. Stock up, and use faster couriers to shorten shipping times.

Among the 89 orders with sales greater than 1,000, 21 orders were delayed for more than 15 days before delivery, 4 of which were due to the long preparation time, and the rest of the orders were due to the long logistics time. For these orders, the detailed reasons for overtime delivery should be screened one by one, and consumers should be compensated and apologized.
4.5.5 Relationship between user ratings and order delivery time
-- 评分与订单交付时长关系
SELECT timestampdiff(second, max(order_purchase_timestamp), max(order_delivered_customer_date)) / 86400 as 订单交付时长
	,round(avg(review_score), 2) as 订单评分
FROM olist_orders_dataset
JOIN olist_order_reviews_dataset
	USING(order_id)
GROUP BY order_id;

-- 评分与订单平均交付时长关系
SELECT round(avg(timestampdiff(second, order_purchase_timestamp, order_delivered_customer_date) / 86400), 2) as 订单平均交付时长
	,review_score as 订单评分
FROM olist_orders_dataset
JOIN olist_order_reviews_dataset
	USING(order_id)
GROUP BY review_score;

Regression analysis using Excel:

It can be seen that the correlation coefficient R is 0.33, and the R square is 0.11. The order delivery time is only slightly correlated with the score, and the degree of fitting is very low, indicating that in addition to the delivery time, there are other factors that affect the score, which needs to be further explored, such as Commodity quality, customer service attitude, after-sales service, etc.

Regression analysis using Excel:

It can be seen that the correlation coefficient R is 0.97, and the R square is 0.95, indicating that the average delivery time is highly correlated with the score, and the fitting degree is good. P<0.05 in the F test indicates that the regression equation is significantly effective, and P<0.01 in the T test , indicating a confidence level of 99%.
V. Conclusions and Suggestions
5.1 User level
1. Users are concentrated in coastal cities and inland capitals in the southeast of Brazil. They like to shop during weekdays. Credit cards are the preferred payment method. Subsequent marketing activities can be targeted according to the user's region, active time, and shopping preferences. .
2. The favorable rate of users is 77.07%, and the rate of negative reviews is 14.69%. The reasons for negative reviews can be further analyzed and classified. The reasons for product quality should be taken off the shelf for rectification in time, and then put on the shelves after restoring the quality. For reasons of service attitude, customer service should be strengthened Advanced training management, while improving after-sales service, timely return and refund.
3. The peak period for user comments is from 11:00 to 12:00 in the daytime and from 21:00 to 1:00 in the evening. You can consider launching targeted advertisements on the page after filling in the comments to further promote consumption.
4. The consumption frequency of users is generally low and the recent consumption time is relatively far away. It is necessary to carry out differentiated and precise marketing for different types of users in the RFM model: for
important development users and important retention users, they should take the initiative to contact and give repurchase discounts to reduce secondary consumption Threshold, increase the repurchase rate, and adopt a membership point system or a membership card recharge system to guide users to long-term consumption and enhance stickiness;
for general development users and general retention users, free trials should be added to increase user interest and increase new user retention. Carry out user satisfaction surveys, analyze the reasons for user loss, and recall them in a targeted manner;
provide personalized services for important value users and important retention users, and provide personalized product recommendations and preferential plans according to user needs and interests;
for Ordinary value users and ordinary retaining users should optimize related sales and increase the unit price of customers.
5. Popular popular categories such as health and beauty, household goods, sports and leisure are suitable for promotion and promotion to all kinds of users; while popular niche categories such as computers, stationery, and small appliances are better recommended to specific user groups.
5.2 Merchant level
1. The order volume and sales of merchants are generally low. 74.22% of the merchants have an order volume of less than 20, and more than half of the merchants have sales of less than 1,000. The platform should actively contact merchants to understand the reasons for the low number of orders, further summarize and optimize, provide technical guidance and after-sales service to merchants, and launch platform subsidy activities to promote merchants' enthusiasm.
2. For merchants with many negative reviews, the reasons for negative reviews can be further analyzed and classified. The reasons for product quality should be removed from the shelves in time for rectification, and then put on the shelves after the quality is restored. The reasons for service attitude should strengthen the training and management of customer service. At the same time improve after-sales service, timely return and refund.
5.3 Commodity level
1. The platform can divide products into three categories: A, B, and C according to the proportion of sales of 70%, 20%, and 10%, put key management resources in category A, enrich the number of subcategories of categories A and B, and allocate more Allocate less resources to category C or cut off some category C with too low sales and too few subcategories.
2. The top ten sales categories are household products, health and beauty, sports and leisure, furniture decoration, computer accessories, household utensils, watch gifts, telephones, gardening tools, and automotive supplies, accounting for 64.54% of the total sales. The top ten sales categories are health and beauty, watch gifts, home products, sports and leisure, computer accessories, home decoration, cool things, household utensils, car supplies, and gardening tools, accounting for 63.20% of the total sales. For these categories, an expansion marketing strategy can be adopted to attract merchants of the same category to settle in, increase product categories, increase advertising and traffic tilt, add discount promotions, create hot-selling products among hot-selling products, and use hot-selling products to drive the entire category and even the whole world. platform sales. Properly prepare more inventory to reduce business losses caused by out-of-stock.
3. Platform customers are mainly low-consumption and medium-consumption groups. Users most like to buy products in the [10,100) range, and the products that contribute the most to platform sales are in the [100,200) range. It is possible to set multiple discounts and discounts for full discounts, and it is also possible to associate high-priced and low-priced products for sale, increase the intensity of discounts and promotions for high-priced products, and improve user consumption levels.
4. The picture description and text description of most product details are relatively simple. The platform should remind merchants to take high-resolution physical pictures for the product and enrich the description on the product detail page. A standard tutorial for writing product detail descriptions can be published, or the product detail page generation can be carried out. write service.
5.4 Sales level
1. From 2016 to 2017, the sales volume and sales volume of the platform increased rapidly, and the growth rate slowed down after November 2017, which is consistent with the changing trend of the number of monthly active users. While activating old users, various methods of attracting new users should be adopted to balance the inevitable loss of users by supplementing new users.
2. Sales fluctuate in festivals, and we should continue to take advantage of festivals such as "Black Friday" to innovate sales strategies and activities.
3. Users are keen on online shopping on weekdays. From 10:00 am to 22:00 pm is the active period for users, and the sales volume and sales volume drop significantly on weekends. The platform can operate according to the active period of users, improve the conversion rate of each link, increase the unit price of customers through product combination, full discount and other measures, and carry out promotional activities on weekends.
4. The vast majority of users have only placed an order once, and the repurchase rate within a month shows a downward trend. The platform should implement more activation activities, such as repurchase discounts, member recharges, point systems, etc., and recall old users by text messages and emails.
5. Daily operations should focus on changes in sales in the top ten cities. When carrying out activities, we should first increase the investment in advertising and traffic in Sao Paulo and Rio de Janeiro, and give priority to promotion of new products in Rio de Janeiro, which has higher spending power.
5.5 Delivery level
1. The order response speed is generally slow, and the platform should optimize the order review process.
2. In February and March and November and December when there are many orders, the average logistics time and the proportion of overtime delivery orders both increased. The platform should choose faster express delivery during the shopping festival, encourage merchants to pre-order and pre-package, appropriately extend the estimated delivery time, and compensate for delayed delivery orders.
3. Most of the deferred delivery orders are delayed due to the long logistics time, and a few are due to the long preparation time. For the delayed delivery caused by the merchant's long preparation time, it is necessary to contact the merchant to find out the reason, and the platform can help them optimize the shipment; for the delayed delivery caused by the express delivery, you can consider adding pre-sales, off-peak sales, and advance delivery of the product. Stock up, and use faster couriers to shorten shipping times.
4. The platform can give priority to the establishment of general warehouse stocking in sao paulo and rio de janeiro with the highest sales, and sub-warehouses in belo horizonte, porto alegre, curitiba, salvador, and brasilia to reduce transportation costs and shorten transportation time, thereby improving customer satisfaction .