Small Object Detection in Remote Sensing Images with Residual Feature Aggregation-Based Super-Resolution and Object Detector Network. Remote Sensing
Abstract
In this paper, the concept of image super-resolution is utilized to enhance image resolution using deep learning-based detection methods to detect small objects in remote sensing images from satellites or any aerial vehicles . This paper provides a rationale for image super-resolution of small objects by combining recurrent generative adversarial network (GAN) and residual feature aggregation (RFA) to improve the current super-resolution (SR) framework to improve detection performance. The novelty of this method is threefold : first, a framework is proposed that is independent of the final object detector used in the study , i.e. YOLOv3 can be replaced by Faster R-CNN or any object detector to perform object detection ; second, in the generator The residual feature aggregation network is used in , which significantly improves the detection performance, because the RFA network detects complex features; third, the entire network is transformed into a recurrent GAN . The image super-resolution recurrent GAN using RFA and YOLO as the detection network is named SRCGAN-RFA-YOLO , and the detection accuracy of other methods is compared. Rigorous experiments on satellite and aerial images (ISPRS Potsdam, VAID, and Draper Satellite Image Chronology datasets) show that enhancing the spatial resolution by using super-resolution methods improves detection performance ; for an IoU of 0.10, the scaling factor is 16 has an AP of 0.7867.
1. Introduction
1.1. Objective and Research Problem
Detecting objects of interest in remote sensing images has been challenging due to the limitation of ground sampling distance (GSD) , especially among small objects . For small objects, such as vehicles, a few pixels represent the entire object ; thus, recognition and detection become challenging. For a vehicle size 4 × 1.5 m2, a very high resolution (VHR) satellite image with a GSD of 25 cm will have an area grid of 96 pixels (16 × 6). Recently developed deep learning-based models for solving small object detection problems include Faster RCNN [1], single-stage detectors [2], semantic context-aware networks [3], and end-to-end MSCNN (multi-scale convolutional neural network) networks )[4] . Alganci et al. [5,6] also compared object detection networks to learn more about object detection in satellite imagery; this review is referred to the reader. Researchers have worked hard to adapt current object detectors to address the problem of object detection in VHR satellite imagery. In [7], a tree-based CNN is used to detect objects in VHR satellite imagery; the output layer is fully connected, while a single layer consists of a convolutional layer and a pooling layer. In [4], EssNet is proposed to ensure that enough attention is given to small objects in VHR images using multi-scale object detection, which is impossible in fusion feature pyramid detection [2] because the deep feature level dominates the learning process, and small targets are lost in the learning process . In [8], multispectral features are used to improve object detection accuracy; however, the authors use this method for large-scale object detection, including golden stadiums and power plants. After the last convolutional layer, Deconv R-CNN based on deconvolutional layers is used in [9] to better localize small-sized object features.
1.2. Background and Related Literature
These studies are categorized as End-to-End Learning for Object Detection or Using prior networks to enhance image quality prior to object detection . Therefore, to detect small objects in satellite/aerial images, multi-scale learning with feature attention is being used along with state-of-the-art object detection methods such as Fast/Faster RCNN [10] (region-based convolutional neural network), feature PyramidNet [11], YOLO (YOLOv3 [12], YOLOv4 [13], YOLOv5) Single Shot Detector (SSD) [14], and RetinaNet [15].
Compared to Faster R-CNN [10], Deconv R-CNN reports a 13% increase in mean precision (mAP) for detecting objects. Intersection-over-union (IoU) represents the whole between the actual and detected object boundaries, and the detection performance depends on the choice of IoU value ; for small objects, choosing a smaller IoU usually leads to higher detection accuracy, meanwhile, Poor localization can result due to the increased number of false alarms [16] . An adaptive IoU based deformable R-CNN is proposed in [16], which improves the detection performance by 4.8% compared to the baseline R-CNN. In [17], an optimized dense YOLOv2-based method called DOLO was developed for detecting small objects in unmanned aerial vehicle (UAV)-generated images; small objects poorly detected by YOLOv2 and SSD were replaced by DOLO ( three blocks) detected , and the authors report a mean precision (mAP) of 0.762. In [17], Faster R-CNN and YOLOv3 reported higher mAP, 0.817 and 0.867, respectively. [18] developed another method for detecting small objects in UAVs, called UAV-YOLO . In [18], the original darknet in YOLOv3 was modified to include two Resblocks; in addition, the author added convolution operations in the initial layer to enable the network to collect more spatial information . The method is optimized to perform better on drone images, while it performs similarly to YOLOv3 and SSD on datasets such as VOC and COCO. In [19], the authors developed a method based on Tiramisu and YOLO for vehicle counting on images with a ground sampling resolution of 50 cm. The 87k vehicles in the dataset were segmented and annotated using a semi-automatic annotation method,This creates a bottleneck in training, as annotation will take more time if the dataset is changed to images from different satellite sensors . While in [20], the authors introduced lower subsampling factors of 4 and 2 in the YOLOv3 model to focus on small objects, which can improve the detection of smaller objects due to the smaller detection grid . In [21], Wang et al. propose SSS-YOLO with dilated Resblocks, which ensures a large receptive field to capture information of ships using Path Augmented Fusion Network (PAFN). The proposed strategy works well on SAR dataset, SAR-Ship-Dataset and Gaofen-3, outperforming YOLOv3 and Faster R-CNN in terms of mAP and inference time.
As mentioned earlier, another approach is to perform preprocessing on the dataset by upscaling the resolution of the images using image SR methods , thereby increasing the level of detail of the images before performing object detection , as performed by Courtrai et al. [22] like that. Various techniques help to generate high-resolution (HR) images from low-resolution (LR) images, where methods such as single image super-resolution [23] use a single image as network input to perform the task. In [24], the authors review deep learning-based image SR methods , including convolutional neural network (CNN)-based methods such as SR-CNN [25], deep recurrent convolutional network (DRCN) [26], fast SRCNN (FSRCNN) [27], and Very Deep Super-Resolution (VDSR) [28] . Residual learning based SR methods include Laplacian Pyramid SR Network (LapSRN) [29], Enhanced Deep SR Network (EDSR) [30] and EnhanceNet [31]. Meanwhile, some current state-of-the-art methods include Recurrent Back-Projection Network (RBPN) [32], Second-Order Attention Network (SAN) [33] and Wavelet-based Residual Attention Network (WRAN) [34]. In [24], further single-image SR methods are explored.
In [35], the authors used progressively supervised learning to detect salient objects in Remote Sensing Imagery (RSI), using pseudo-label generation methods to train the network in a weakly supervised manner, while in [36], the authors used generative adversarial networks ( GAN) for super-resolution and a further second stage using a slightly modified SSD for detection. The results of [36] show that image SR improves detection and classification performance compared to LR images . Furthermore, in [22], Courtrai et al. used EDSR as the base network to develop a YOLOv3-based recurrent GAN that is efficient for a scale factor of 8 in LR images with a GSD of 1 m. In [37], Rabbi et al. combined Enhanced SRGAN (ESRGAN) [38] and Edge Enhanced GAN (EEGAN) [39] to develop an end-to-end approach to Edge Enhanced SRGAN (EESRGAN). The output of EESRGAN is fed to a detection network consisting of a Faster Region-based Convolutional Network (FRCNN) and SSD. The method in [37] improves the detection and classification performance for VHR satellite imagery with resolutions of 15 cm and 30 cm using scaling factors of 2 and 4.
1.3. Proposed Method
For very low-resolution (LR) images, higher scaling factors are required , which for residual learning-based methods require more residual blocks to capture enough detail from the training dataset and generate high-resolution rate images. Therefore, it would be a complex task In this study, the goal is to use super-resolution as a base model to improve VHR images from satellites/aircraft , and then perform detection of small objects, namely vehicle detection .
We propose a super-resolution based recurrent GAN for small object detection in remote sensing and aerial images with residual feature aggregation to improve image quality , first using a weighted loss function of generator, discriminator and YOLO detector . The proposed method is an improved image super-resolution network with a detector to perform the final task of small object detection. The proposed method contains three improvements: an RFA-based residual block for improved super-resolution at very high scaling factors, an object detection framework independent of the object detection network, and a recurrent approach for improved training detection performance .
1.4. Organization of Research
The structure of this paper is as follows. Section 2 introduces practical issues by discussing the EDSR architecture and its performance on LR images and how scaling factors affect the performance of detection networks. Furthermore, this section introduces residual feature aggregation in the EDSR architecture, which improves the generated HR images. In Section 3, we propose to improve the base EDSR network to improve the overall performance, using a GAN-based recurrent method, while using the loss function of YOLOv3 to train the proposed network. In Section 4, we discuss and share the results of regression experiments used to measure the proposed residual feature aggregation network and YOLO (SRCGAN-RFA-YOLO), a recurrent super-resolution generative adversarial network at ISPRS Potsdam performance of [40] on the data. The research problem is to detect and classify vehicles in remote sensing images where the ground resolution is artificially reduced by a factor of 16, ie GSD from 5 cm/pixel to 80 cm/pixel. For a vehicle of size 4 × 1.5 m2, this corresponds to 5 × 2 pixels, for a total of 10 pixels. In Section 4.1, we report the performance of the methods discussed in the assays of this paper to validate the performance of our method. In Section 4.2, we compare the proposed method with other state-of-the-art object detectors. In Section 4.3, we show that using two datasets, the Draper Satellite Image Chronology [41] and VAID [42] datasets, this method can be generalized to other datasets using the concept of transfer learning for vehicle detection without any training. Section 5 discusses the results, and Section 6 shares conclusions and future research plans.
2. Residual learning for image super-resolution
This section introduces some basic image super-resolution methods , prior to the state-of-the-art method EDSR [30], which is the basic model of this study. In recent studies [22, 37, 43, 44], EDSR models are mainly used in remote sensing, where objects have various scales and are difficult to detect due to the multi-scale nature of images . Since the proposed framework is general, the choice of super-resolution method can be changed . Image SR focuses on recovering the HR image from the LR image input, because in principle, the recovered HR image IRHR can be expressed as the output of the super-resolution function φ , as shown in Equation (1):
![]()
where φ is the image SR function responsible for converting the LR image to HR image, ILR is the input LR image, and ![]() describes the parameters of the image SR function. Image SR parameters are usually features extracted from network training on various LR-HR image pairs . One of the basic architectures of image SR is a convolutional neural network (CNN), which is stacked in layers to perform feature extraction, followed by a pixel rearrangement layer that also performs upsampling. Using the extracted feature map, the pixel rearrangement layer rearranges the pixels within the image and converts the input feature map with dimensions {Bt, Ch2, H, W} into {Bt, Ch, H×f, W×f }. Among them, Bt, Ch, H, W denote the batch number, channel number, height and width of the feature map, and f is the scaling or upsampling factor. To double the feature size on the x-axis and y-axis, a scale factor of 2 is required, which will double the feature map size in the pixel rearrangement layer , as Shi et al. [45 Real-Time Single Image and Video Super-Resolution Using an Efficient Sub-Pixel Convolutional Neural Network] and SR-CNN [46] performed . Compared with simple interpolation methods such as bicubic interpolation or patch-based methods [47], these methods perform significantly better in terms of image quality and inference time due to the relatively shallow network architecture, i.e., five convolutional layers , As shown in [45]].
describes the parameters of the image SR function. Image SR parameters are usually features extracted from network training on various LR-HR image pairs . One of the basic architectures of image SR is a convolutional neural network (CNN), which is stacked in layers to perform feature extraction, followed by a pixel rearrangement layer that also performs upsampling. Using the extracted feature map, the pixel rearrangement layer rearranges the pixels within the image and converts the input feature map with dimensions {Bt, Ch2, H, W} into {Bt, Ch, H×f, W×f }. Among them, Bt, Ch, H, W denote the batch number, channel number, height and width of the feature map, and f is the scaling or upsampling factor. To double the feature size on the x-axis and y-axis, a scale factor of 2 is required, which will double the feature map size in the pixel rearrangement layer , as Shi et al. [45 Real-Time Single Image and Video Super-Resolution Using an Efficient Sub-Pixel Convolutional Neural Network] and SR-CNN [46] performed . Compared with simple interpolation methods such as bicubic interpolation or patch-based methods [47], these methods perform significantly better in terms of image quality and inference time due to the relatively shallow network architecture, i.e., five convolutional layers , As shown in [45]].
We can choose residual learning, instead of using traditional CNN , use residual blocks, where each residual block contains convolution, normalization and activation layers. Furthermore, the input information is added to the feature map extracted from the residual map, as shown in Fig. 1 for the EDSR method [30]. Figure 1 shows a standard EDSR model with a scale factor of 4, where there are four residual usage blocks, each with a convolutional layer (green), normalization layer (yellow), ReLU activation layer (blue) and pixel rearrangement layer (brown). The pixel rearrangement layer in Figure 1 is responsible for scaling factor 2. Thus, two layers create an overall scale factor of four.

In Figure 1, the generic residual block fuses residual features with identity features before propagating to the next block. Therefore, the later blocks only see the fused features, ignoring the basic residual features, resulting in performance degradation of models using these blocks . A recent approach to address this problem is Residual Feature Aggregation (RFA) [48], which concatenates local features in residual features to improve the representation of the features and thus the final HR image. Figure 2 shows a residual network based on four-block RFA, where the local features of each block are aggregated in the final output, using a 1×1 convolutional layer. This section shows how RFA improves performance metrics for image super-resolution , such as peak signal-to-noise ratio (PSNR) and structural similarity index metric (SSIM). In addition, the dataset used in this study is Potsdam’s ISPRS 2D Semantic Labeling Competition dataset [40]; the entire dataset contains VHR images of cities (6000 × 6000 pixels per patch), divided into 38 patches of the same size , GSD is cm/pixel.

The ISPRS Potsdam dataset was used to evaluate and rank segmentation methods according to their ability to classify objects into six categories, namely buildings, vehicles, surfaces, vegetation, trees, and background/miscellaneous objects. However, this dataset has been used in studies such as [22,49] to perform vehicle detection using the classification information of vehicle categories in the dataset . Overall, there are 2,244 vehicles, including 1,990 cars, 33 trucks, 181 vans, and 40 pickups; we will use vehicle categories, especially the pixel information of cars, for vehicle detection. The images used were in the RGB band and the images used in this study were sampled at ground-level distances of 5 cm/pixel (at the original resolution of the dataset), 40 cm/pixel (downscaled by a factor of 8), and 80 cm/pixel (downscaled by 16 times). Raw patches are reference HR images, and LR-HR image pairs are generated using two degradation functions: bicubic and blurred degradation defined in [50], using an EDSR architecture with 16 residual blocks, with a fixed block size of 64 × 64 , and is used for traditional residual block and RFA block. In the training phase, the normalization layer is used in EDSR to normalize the pixels in the three color bands, and the L1 loss function is used together with the Adam optimizer to optimize the SR network; for a total of N LR-HR image pairs, the loss function (with parameter p) is given in equation (2).


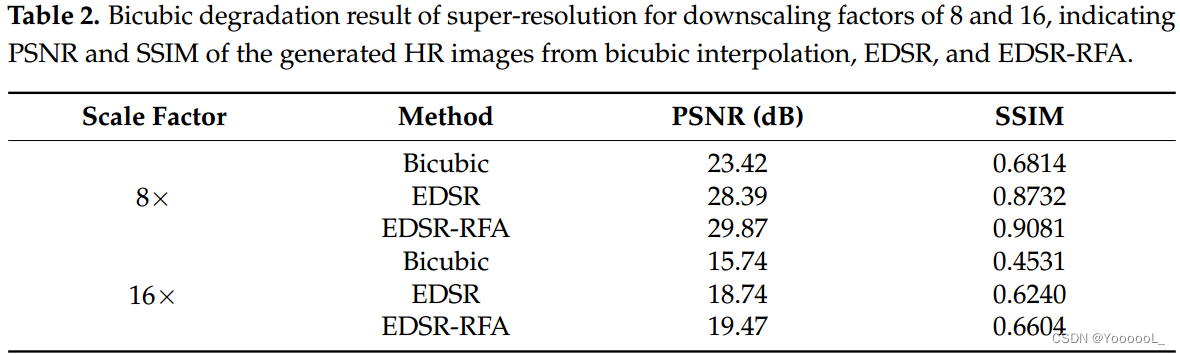
Figure 3 depicts super-resolution with a scaling factor of 8, using bicubic interpolation, EDSR, and EDSR with RFA (EDSR-RFA) to generate HR images with a GSD of 5 cm/pixel from an LR image with a GSD of 40 cm/pixel . Significant improvements in image quality assessment (IQA) metrics (ie, PSNR and SSIM) were observed compared to bicubic interpolation, and RFA further improved image quality compared to EDSR methods . To further evaluate the performance, we use the YOLOv3 [12] detector to detect vehicles using SR images and the results with the detection performance of the HR version of the images . For evaluation, we use the Intersection over Union (IoU) criterion, which measures the overlap of detected and ground-truth boxes on SR images. The threshold for object detection is set to an IoU of 0.25, because objects in LR images occupy few pixels and a low IoU value will improve the detection performance . Therefore, a low IoU would be preferable in this case . Confidence scores in the range 0 to 1 are also used for detection. Boxes with IoU and confidence score values greater than 0.25 are considered detected objects. For object detection evaluation, we used the metrics of True Positives (TP), False Positives (FP), F1 Score and AP (Average Precision), using two degradation models, namely Blurred Degradation (BD) and Bicubic Degradation (BI ) ) , as shown in Table 1. EDSR achieves better results than detection based on bicubic interpolation, while EDSR-RFA achieves the best results, the APs are 0.889 and 0.844 for BI and BD degradation, respectively. (The original text was wrongly written, and the value written was F1 score, not AP.) The image quality indicators of the reconstructed images are summarized in Table 2, and the scale factors are 8 and 16.

It is worth noting that for a scale factor of 8, the detection performance is sufficient, but when we further increase the scale factor to 16 (corresponding to a GSD of 80 cm/pixel), the detection performance drops dramatically . EDSR and EDSR-RFA perform poorly on LR images generated with a factor of 16, as shown in Figure 4, which indicates that the reconstructed images are of poor quality .

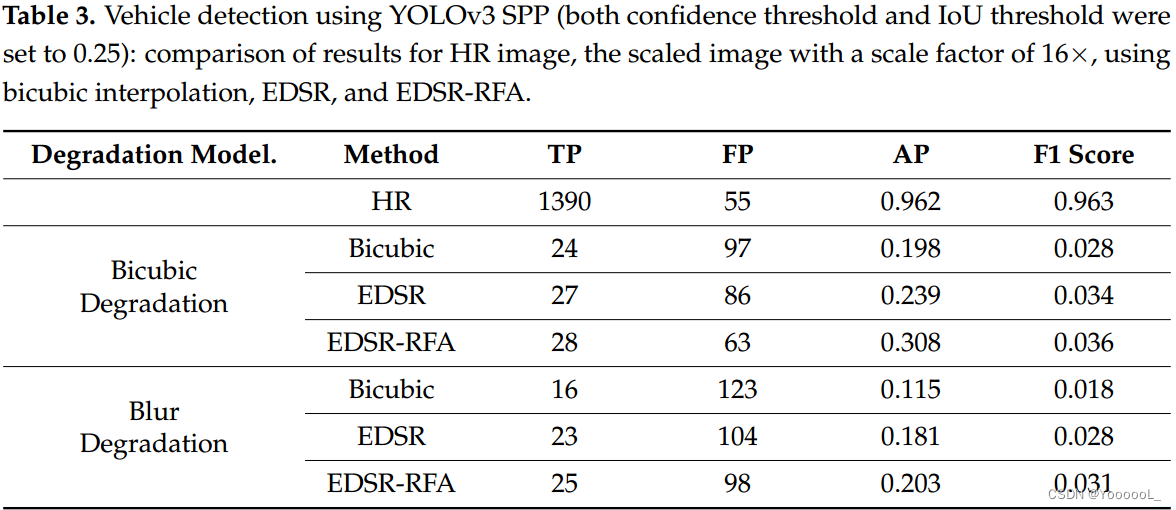
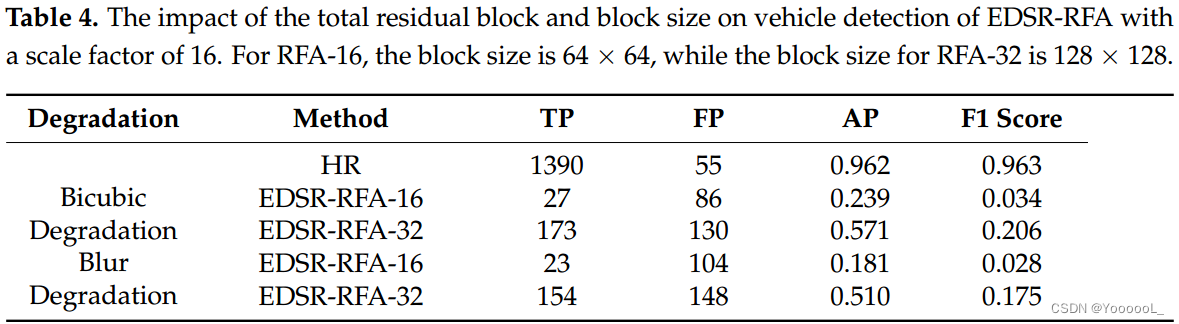
For a scale factor of 16, the best image quality metrics (PSNR: 19.47dB and SSIM: 0.66) are shown in Fig. 4, reported by EDSR-RFA, resulting in detection APs of 0.308 and 0.203 for bicubic and blurred degradation, respectively ( See Table 3). Although using image super-resolution improves the resolution of LR images, it is still not enough for detectors to perform object detection . Also, as mentioned in previous studies, adding more residual blocks to the network can improve image quality , so we added 16 blocks to the network pipeline and changed the total number of residual blocks to 32. The block size is also changed from 64 × 64 to 128 × 128; these changes lead to an increase in detection AP, but at the cost of longer training time and a significant increase in network parameters . Training time increased by 445%, and network parameters increased from 1,145,671 to 3,742,897 (327%), while image quality (see Figure 5) and detection AP increased (see Table 4). The detection AP of bicubic and blur degradation increases by about 33%, but the overall detection AP is still low (ie, 0.962) compared to the detection AP of real HR images .
EDSR-RFA with 32 residual blocks is still deficient in object detection , and the overall training is still unstable due to the limitation of optimization using Adam optimizer, thus providing the same distribution for a dataset with block size 128 × 128. different results. Along with this problem, network parameters and training time increase significantly ; thus, adding more residual blocks is not optimal . In the next section, we make some modifications to the base EDR-RFA method to improve detection accuracy through more stable image super-resolution.

3. Methodology
3.1. Basic Network Architecture for Image SR
Like other SR networks, we use a generic three-part network , i.e. an initial layer for extracting shallow features , a middle part consisting of residual blocks for further feature extraction , and an end part that performs image reconstruction . The shallow features generated by the initial layer (F0) are given by:
![]()
where S is the feature extraction function of the initial layer and F0 is the extracted features; this is transferred to the residual block for deep feature learning based on residual feature aggregation using the residual block shown in Figure 2. The backbone part consists of 48 RFA residual blocks . For K residual blocks, the characteristic function correlation is as follows:
![]()
where Mk represents the kth residual module, which has input Fk−1 and output Fk, and the reconstruction part is responsible for using the extracted feature Fk,
![]()
where ISR is the super-resolved image and ![]() is the reconstruction function, which is equal to
is the reconstruction function, which is equal to ![]() , as shown in equation (1), the overall SR function of the network.
, as shown in equation (1), the overall SR function of the network.
The proposed network is optimized using the L1 loss function as shown in Equation (1).
3.2. Network Improvements
In this section, further improvements to the main network proposed in Section 3.1 are proposed to improve the overall detection accuracy of small objects in aerial/satellite imagery. The entire network is improved by making a recurrent GAN using a modified Wasserstein generative adversarial network [50] , and the generator of the network is defined in Section 3.1 . Finally, using the loss function of the YOLO detector , a YOLO-v3 detector is added to facilitate object detection and train the network.
3.2.1. Using Generative Adversarial Network Pipeline
In computer vision and pattern recognition, generative adversarial networks (GANs) are widely used due to their versatility, from the simple task of binary classification to learning image super-resolution, using a generator and a discriminator that rates the output of the generator . For super-resolution, the first GAN-based proposal was SR-GAN [51], using EDSR-based residual blocks in the generator network ; a similar approach was used by Jiang et al. Edge-enhanced super-resolution GAN for remote sensing applications. We modify the generator network in SR-GAN and incorporate residual feature aggregation (see Figure 6) to enhance the performance of the generator . The goal of the generator network is to generate SR images, which are then evaluated by the discriminator D to determine whether the output of the generator is real (HR images) or fake. The generator uses feedback from the discriminator to fine-tune the network parameters, using an L1 loss function to generate more realistic images , while the discriminator network also improves itself in each iteration.

The first improvement is merging, using the generator network Gen as shown in Figure 6, using 32 RFA-based residual blocks of size 128 × 128, while the discriminator network D is the same as in SR-GAN for Evaluate the resulting HR images. We also exploit an improvement in the form of the Wasserstein GAN proposed by Arjovsky et al. [50], which uses a gradient penalty in the discriminator's loss function , given by:

where IHR, ISR, and Ir are HR images, SR images, and random images uniformly sampled from IHR and ISR, respectively, while Pt, Pg, and Pr are the probability density distributions of real HR images, generated images, and randomly sampled images, respectively, and l is the gradient penalty coefficient, which is assigned a high value of 10 as suggested in [52].
3.2.2. Cyclic Network
The next improvement involves using recurrent methods in GANs , as proposed by Zhu et al. [53], by adding another GAN to generate LR images from the output of the first generator , as shown in Figure 7.

Compare the final LR image produced by the second generator with the original LR image . Using a loss function, it tunes the network parameters as follows:

Among them, IHR and ILR are HR and LR images; GenHR and GenLR are corresponding HR and LR generators, as shown in Fig. 7 .
The loss function of the recurrent GAN shows our significant improvement as shown in Equation (7), which ensures that the two GAN networks operate by evaluating each other's outputs to minimize the overall loss function . The final reconstructed LR image (IRLR) generated by GenLR is compared with the actual LR image (ILR) generated using the real HR image, using bicubic and blur degradation. The key idea is to ensure that the two low-resolution images (ie, IRLR and ILR) are identical, thereby ensuring that the generated HR image is also close to the real HR image . Further results and analysis of this selection are shown in Section 4.
3.2.3. Detection Network
We further add the state-of-the-art object detection network YOLOv3 to perform the final detection task on the SR images generated by recurrent GAN. The main goal is to ensure that the objects of interest in the generated HR images resemble real HR images , so YOLOv3 is used to ensure this in the ensemble model. The YOLOv3 detection network is trained on HR images . Therefore, its network weights are fixed when it is integrated into a recurrent GAN model ; the resulting model is shown in Figure 8. In the training phase, the generated HR images are fed into the YOLO network to detect objects, and the coordinates of the predicted boxes are used to calculate the loss function of the YOLO network, namely L(Y). Compute the total loss function and, using backpropagation, update the weights of the generator and discriminator networks with the gradient of the total loss .

As shown in Figure 8, the proposed method consists of three components; thus, three different loss functions are used , as shown in Equations (8)–(10):

where L(G) is the generator loss, pram is the parameter, N is the total number of samples, ![]() is the i-th generated HR image, and
is the i-th generated HR image, and ![]() is the ground truth HR image.
is the ground truth HR image.
Based on the improved Wasserstein GAN [8], the 48 ResBlock-based generative network G(ILR, γ) has a block size of 64 × 64, a kernel of 3 × 3, and a discriminator with a high gradient penalty. The coefficients in the loss function are as follows: (9) shows:
![]()
where IHR, ISR, and Ir are HR images, SR images, and random images uniformly sampled from IHR and ISR, respectively, while Pt, Pg, and Pr are real HR images, generated images, and randomly sampled images, respectively, and l is the gradient penalty coefficient, It was assigned a high value of 10 as suggested in [52].
The detection network (YOLO) loss function is given by:

where DG and A denote the number of detection grids and anchor boxes associated with the YOLO detector, while (x, y, h, w) and (x', y', h', w') describe the coordinates of the ground truth and the predicted bounding box; (x, y) and (x', y') denote the coordinates of the center point, while (h, w) and (h', w') denote the dimensions of the bounding box. The overall loss of the network shown in Figure 8 is as follows:
![]()
where μ1, μ2 and μ3 are the weights associated with the generator, discriminator and detector networks. During the training process, the weights are assigned as μ1 = 0.95, μ2 = 10, and μ3 = 0.1 to ensure that the error ranges of the three loss functions are similar , ensuring balanced learning in the three aspects . HR images are achieved using super-resolution, using a generator, a discriminator to ensure image fidelity, and a detection network to perform object detection and localization.
3.3. Implementation Details
The proposed method was implemented on the PyTorch framework using an Ubuntu 20.04 computer with 16 GB RAM and Nvidia Titan XP graphics processor. A gradient penalty factor of 10 is chosen to train the Wasserstein GAN, while the total loss function weights m1, m2, and m3 are assigned values of 0.95, 10, and 0.1, respectively. The network was trained for a total of 250 epochs.
4. Results
In this section, we discuss and evaluate the results achieved by the proposed novel SRCGAN-RFA-YOLO network. Initially, we focus on the main task of object detection and compare the results with the mainstream methods reported in this study. In Section 4.2, we compare the results of our method with state-of-the-art object detectors in terms of AP over IoU of 0.10 . Finally, we discuss the concept of transfer learning, using pretrained networks to perform image super-resolution and object detection on other aerial datasets, such as Draper Satellite Image Chronology [41] and VAID [42].
4.1. Improve image quality and detection accuracy
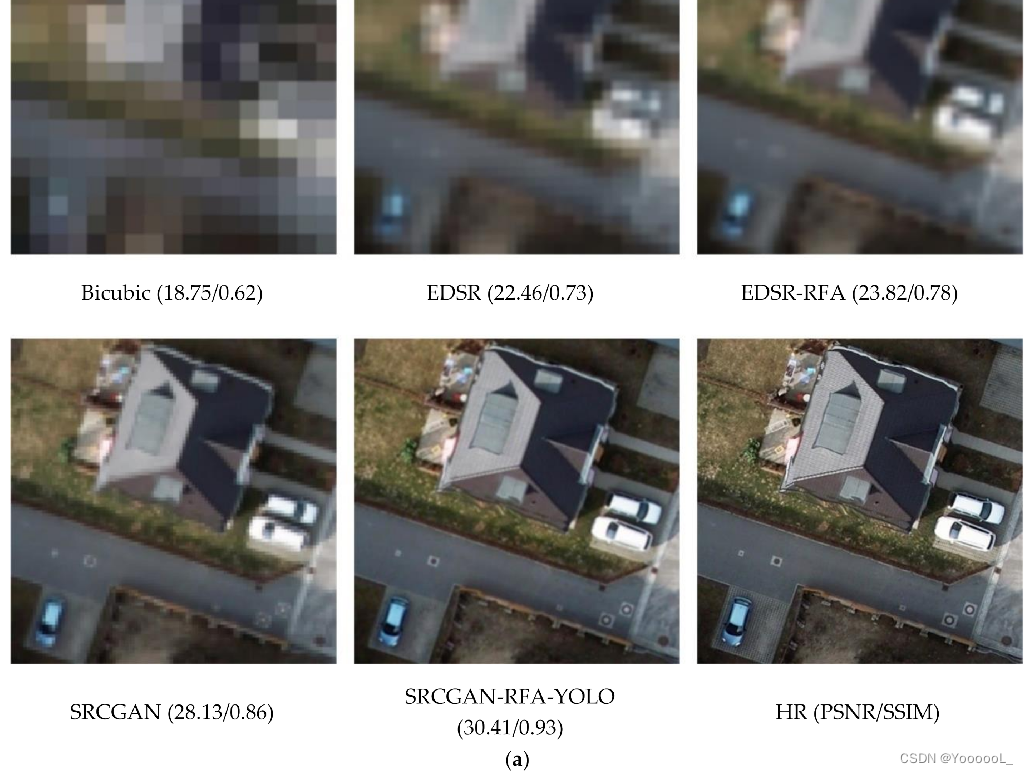
Figure 9a shows the SR results of various methods in terms of image quality metrics (PSNR and SSIM). The LR version has a scale factor of 16, corresponding to a GSD of 80 cm/pixel. Image SR methods, EDSR and EDSR-RFA alone, cannot achieve high image quality as shown in Fig. 9a, while the recurrent methods, namely SRCGAN and SRCGAN-RFA-YOLO, can generate high-quality super-resolution images with PSNR of 28.13dB and 30.41dB. The zoomed images in Fig. 9b show the quality of details recovered by various methods. Figure 9 shows that the recurrent model performs best by reconstructing images using SSIM of 0.86 and 0.93 for SRCGAN and SRCGAN-RFA-YOLO, respectively . Thanks to the improvements introduced in Section 3.2, the proposed SRCGAN-RFA-YOLO method achieves the best results , especially in recovering texture information in low-resolution images , as shown in Fig. 9a.
Finally, we compare the training performance and precision/recall curves of the proposed SRCGAN-RFA-YOLO method with bicubic interpolation, EDSR, EDSR-RFA, SRGAN, and SR-CGAN for 250 epochs. The training performance of our method exceeds all other reported methods in terms of AP (see Fig. 10a); meanwhile, our method achieves higher AP within a few epochs, which indicates that the proposed method converges fast and trains stably . The precision/recall curve also shows the superior performance of our method in Fig. 10b. The green line in Fig. 10b represents the precision/recall curve for HR images. The precision/recall curve of the proposed SRCGAN-RFA-YOLO method is shown in red. Compared with EDSR and EDSR-RFA, our method approaches the performance achieved on HR images, thus providing superior detection performance for low-resolution images .
Detection performance is measured in terms of precision, recall and F1 score, as shown in Table 5.

As shown in Table 5, SRCGAN-RFA-YOLO reports an IoU of 0.10 and an F1 score of 0.86 on the ISPRS Potsdam dataset. Compared to the detection F1 score of EDSR-RFA, our method reports a 20.5-fold increase in F1 score .
4.2. Performance comparison with other object detectors
In this section, by using RetinaNet [15], SSD (VGG16) [14], EfficientDet [54] and Faster R-CNN [10]. To avoid method bias, we train all methods on HR images with an input image size of 512 × 512 pixels on the ISPRS Potsdam dataset. The detection performance of SRCGAN-RFA-YOLO is compared with state-of-the-art object detectors at scale factors of 8 and 16, as shown in Table 6. For HR images, the detection performance of all object detectors is almost similar, but as the scale factor increases , the proposed method achieves the highest AP value , especially 80 cm/pixel for GSD with a scale factor of 16. The single image inference time shows that the proposed method has a relatively low inference time of 33.67 ms per image while providing the best AP for higher scale factors.

The super-resolution images generated by the proposed SRCGAN-RFA-YOLO are used as the input of the above object detector , and Table 7 shows the AP detection performance with IoU of 0.10.

As shown in Table 7, YOLOv3, SSD (VGG16), EfficientDet and Faster R-CNN achieve similar detection performance on HR, which shows that HR image performance does not depend on the choice of detector , while for SR images (for scale factor is 16), the best result is Faster R-CNN, AP is 88.81%. The YOLOv3 detector achieves the most significant change in AP (~54%) compared to bicubic interpolation, as SSD (VGG16), EfficientDet and Faster R-CNN achieve relatively high AP values for bicubic interpolated images.
SSD (VGG16) and EfficientDet achieve higher AP values on bicubic interpolated images, mainly due to the built-in image augmentation scheme during training . The input image and bounding box are resampled for different scale values and aspect ratios [14, 54]. Similarly, Faster R-CNN also achieves improved AP due to the introduction of Region Generation Network (RPN), which uses attention mechanism to improve detection accuracy . The proposed framework allows the integration of different object detectors ; thus, using object detectors such as SSD (VGG16), EfficientDet, and Faster R-CNN will increase the overall AP by 10%, as shown in Table 7.
4.3. Applying transfer learning on different remote sensing datasets
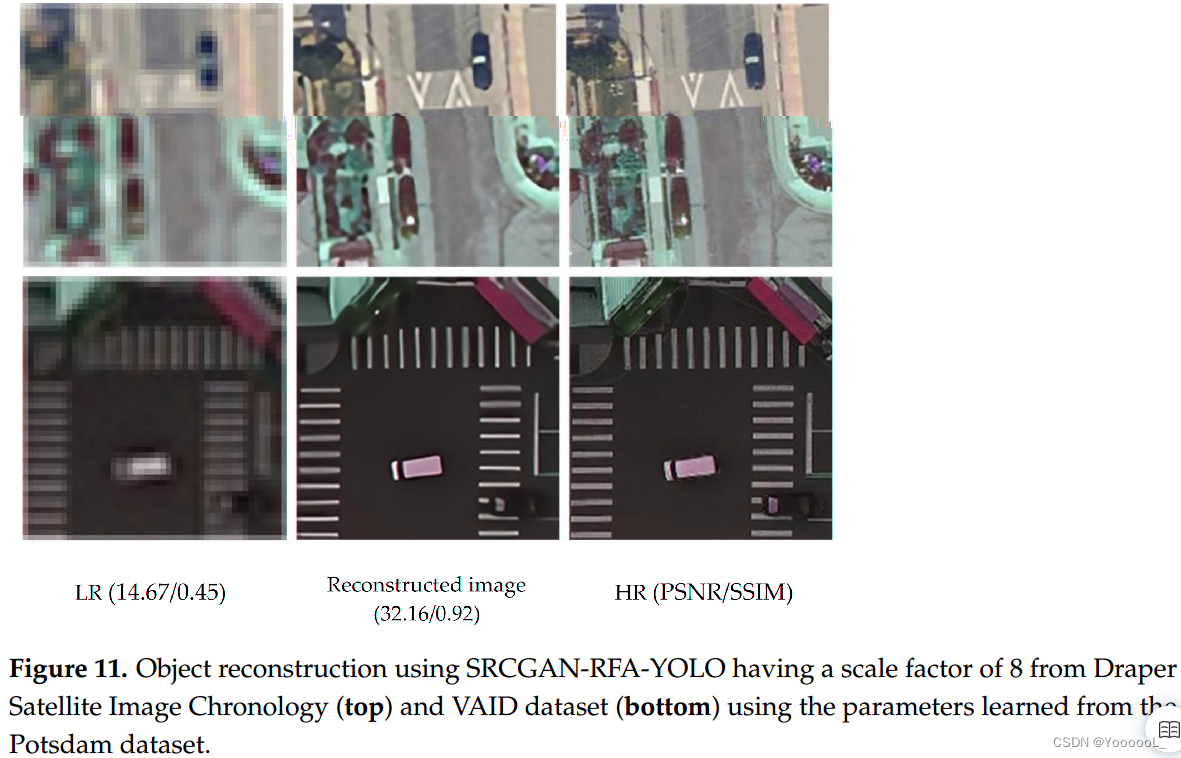
This section discusses the concept of transfer learning by performing object detection on different remote sensing datasets, using the parameters learned by the novel SRCGANRGA-YOLO on the ISPRS Potsdam dataset. Two datasets considered for this task are Draper Satellite Image Chronology [41] and VAID [42]. Figure 11 shows the results of image super-resolution on the dataset. To compare performance, we downscale the images to match a GSD of 80 cm/pixel: VAID dataset has a GSD of 12.5 cm/pixel, so a scale factor of 6 is used to generate LR images ; for Draper Satellite Image Chronology, the GSD is 10 cm/pixel, Therefore a scale factor of 8 is used to generate the LR image.
The results in Fig. 11 depict the importance of the proposed method to perform small object detection on low-resolution satellite imagery using pre-trained networks in an end-to-end manner.
5. Discussion
Analyzing other image patches from the same dataset, we measure the detection performance of various methods, including SRCGAN-RFA-YOLO. We further investigate the impact of IoU on detection performance, and Table 8 shows the variation of AP under three different IoU values (ie, 0.10, 0.25, 0.50). The best result is highlighted in bold, while the second best result is underlined.

Notably, SRCGAN-RFA-YOLO achieves the best AP at all three IoU values, SRCGAN achieves the second best AP at 0.10 and 0.25 IoU, and SR-GAN at 0.50 IoU Got the second best AP. For small object detection, choosing a low threshold of 0.10 as IoU, the proposed method achieves an AP value of 78.67%, which is about 32% higher than the AP achieved by the EDSR method when used with the YOLO detector . Furthermore, training our SRCGAN-RFA with the loss function of the YOLO network improves the AP by 11.5%, highlighting the superior performance of the proposed method.
Compared with bicubic interpolation based detection, the proposed method increases AP by 54.3% at IoU of 0.10, and increases AP by 31.8% compared to EDSR method. These increases in AP are significant because the spatial resolution of LR images is 80 cm/pixel with a scale factor of 16, and for such low-resolution images, the proposed method achieves state-of-the-art performance .
In Fig. 12, for the LR image, the YOLO network does not detect any vehicles, while the method based on residual feature aggregation successfully detects all five vehicles, while SRCGAN-RFA-YOLO achieves best results in terms of image quality confidence score and AP. best performance .

The proposed framework allows the integration of different object detectors ; thus, using object detectors such as SSD (VGG16), EfficientDet, and Faster R-CNN will increase the overall AP by 10%, as shown in Table 7.
The transfer learning results for the two datasets are shown in Figure 11. Although our method improves images, especially vehicles in LR images, our method does not generate complex textures due to lack of features; however, super-resolution images achieve improved object detection .
The novelty of this method is threefold: first, a framework is proposed that is independent of the final object detector used in the study , i.e. YOLOv3 can be replaced by Faster R-CNN or any object detector to perform object detection; second, in the generator The residual feature aggregation network is used in the RFA network, which significantly improves the detection performance of the RFA network when detecting complex features; third, the entire network is transformed into a recurrent GAN , which improves the accuracy of training, testing and verification, which can also be seen from Figure 10a It's obvious.
The detection performance of the proposed method was measured on an independent dataset created from the Draper satellite imagery chronology and selected images from the VAID dataset (images downscaled to match a GSD of 80 cm/pixel, i.e. low resolution). Detection performance is measured in terms of precision, recall and F1 score, as shown in Table 9.

As shown in Table 9, SRCGAN-RFA-YOLO reports an F1-score of 0.84 with an IoU of 0.10 on the independent dataset using network parameters learned from LR-HR image pairs of the ISPRS Potsdam dataset. Figure 13 shows the detection example of SRCGAN-RFA-YOLO.
The performance on an independent dataset demonstrates the effectiveness of the proposed method. As shown in Figure 13, misclassified examples include vehicles in shadow or embedded in similarly colored backgrounds. However, using the pretrained network, SRCGAN-RFA-YOLO achieves an F1 score of 0.84.

6. Conclusions and Future Directions
Object detection in low-resolution images is challenging, and general-purpose detectors perform poorly when directly applied to low-resolution images . In the case of satellite imagery, the object of interest (vehicle in our case) occupies very few pixels when dealing with low-resolution images , and we have shown that using super-resolution prior to the detection task can significantly improve detection precision . Our method targets the challenging condition that the spatial resolution of remote sensing images is low, and in the case of most remote sensing satellite images, the image resolution is not very high due to the limitations of the imaging payload . Proposed improvements to object detection networks include using a residual feature aggregation-based super-resolution method (EDSR-RFA) to collect captured complex features , and adopting a recurrent GAN (SRCGAN) -based to train the network and detection tasks to improve the model. The results show that our method improves AP by 54.3% compared to object detection on bicubic interpolated images, and the proposed SRCGAN-RFA-YOLO achieves 29.4% AP compared to the state-of-the-art EDSR-RFA method enhance . Furthermore, transfer learning shows that when our method is applied to other datasets, using the parameters learned from the dataset used in this study, it can significantly improve the image quality .
Compared with other object detectors (YOLOv3 and SSD), the inference time of the proposed method is relatively long (33.67 ms), because the residual feature aggregation ensures the collection of complex features, thus increasing the network parameters . The next step is to combine all proposed improvements into a framework and deploy it as a general-purpose object detector for low-resolution images. Additionally, we plan to train networks on large datasets such as BigEarth [55] and release pretrained networks for object detection tasks in aerial and remote sensing images.