Table of contents
1. The "way of thinking" is the key to solving problems! !
1. The Birth of Statistical Thinking
What is the difference between probability and statistics?
How Experience and Reality Coexist - Bayes Theorem?
2. The paradox of data processing
3. Interpret the data correctly
4. The challenge of accurate forecasting
introduce
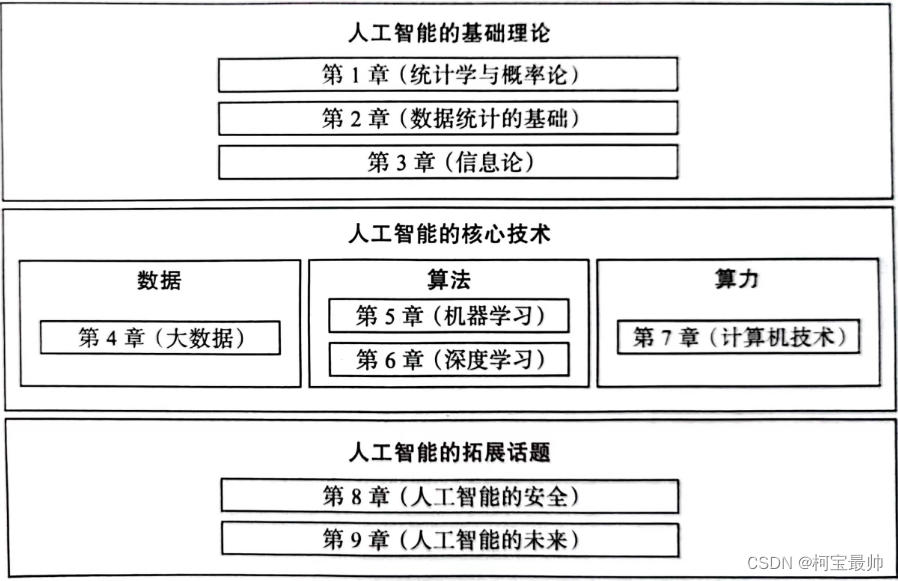
This series of blogs tries to discuss some general issues about AI . AI itself is an interdisciplinary, professional, abstract, and complex issue. It may be difficult to learn relevant professional knowledge, especially some mathematical formulas and complex program codes. This series of blogs takes the underlying logic of "machine intelligence" as the starting point, focusing on discussing the core technologies and principles of AI . The logic of this series:
1. The "way of thinking" is the key to solving problems! !
In recent years, the development of AI is inseparable from high-performance computers and distributed technologies, the development of machine learning and ANN, and the accumulation of big data, but the most essential factor is the change in the way of thinking. The essence of solving artificial intelligence problems is to transform the real application scenario problem into a mathematical problem that can be handled by a computer . This step accounts for almost half of the problem solving. Today, AI mainly relies on mathematical tools and information technology rather than medicine, etc. This is a change in cognitive thinking.
To make a machine intelligent is not to list all the rules of intelligence for the computer to follow, because in this way the computer will never go beyond the scope of human cognition . In fact, it is to let the computer "learn" the rules from a large amount of data, which is also viewed from the perspective of thinking. A change in the perspective of the problem - how to solve relatively certain problems in an environment full of uncertainty , so an important mathematical tool - "statistics " was born!
1. The Birth of Statistical Thinking
Previous science believes that there are simple and universal truths in this world, such as Euclid's 5 geometric truths, Newton's 3 laws of motion, Maxwell's 4 electromagnetic differential equations, Einstein's theory of relativity, etc., so scientists try to use concise formulas Describe the law of the complex world, that is, everything in the world is predictable under certain prerequisites—— "determinism"! But now it is found that it is impossible to describe all the details of the world with a few simple formulas. The more microscopic the more uncertain, some people have changed their thinking and created - "statistics" , which recognizes the existence of uncertainty and the impact of reception errors on results , and use them as prerequisites for mathematical modeling and analysis!

Statistical application example: use the half-life of radioactive elements and the amount of radiation they contain now to infer the age of the earth! The half-life has a typical statistical significance, reflecting the connection between individual randomness and overall uncertainty, that is-even if the random situation of each individual cannot be accurately grasped, the overall state can be calculated by using statistical laws!
Strictly speaking, statistics and statistics are different in terms of mathematical definition. Statistics is essentially a mathematical process. As long as there is data, it can be counted. The data to be processed is certain , such as the sum of your own expenses this month. This process does not involve statistics. Learning, without making inferences about some uncertain situations. Statistics is different. It is a subject that studies uncertainty , and the research objects have a lot of randomness ! - Note that random is not uniform .
2. The power of probability
What is the difference between probability and statistics?
Probability theory and mathematical statistics are often mentioned together, but there is a difference between the two. Probability theory is the basis of statistics and the theoretical basis for mathematical research on randomness; mathematical statistics focuses on the method of studying the behavior of objects through a large amount of raw data-probability theory is more mathematical theory, and mathematical statistics is more about application! For example, the study of probability theory is a "white box" , knowing how many red balls and white balls are in the box (that is, the known mathematical distribution function), and then guessing the possibility of touching a ball of a specific color; mathematical statistics face What is more is a "black box" , you can only see whether it is a red ball or a white ball that is drawn out of the box each time, and then guess the distribution of colors in the box. The former is parameter estimation and the latter is called hypothesis testing !

As the number of repeated trials increases, the frequency of the event will show stability , and this frequency constant can approximately represent the possibility of the event occurring, that is, its probability ! This is a relatively abstract concept. Firstly, probability is an empirical value derived from frequency ; secondly, probability reveals certainty in uncertainty ; probability cannot avoid "black swan" data (outliers) . The more times the experiment is repeated, the more convincing the probability obtained, which relies on the law of large numbers , the law shows that the larger the number of samples, the closer the conclusion is to the real probability distribution . The theoretical basis of the Monte Carlo method that is often mentioned today is the law of large numbers. The principle is very simple: continuous sampling and successive approximation , such as calculating pi, is to use the computer to continuously sprinkle points in squares and circles. Calculate the relationship between! This can be used for many algorithms that require enumeration , such as playing the game of Go, running a maze, or calculating the area of any irregular shape.
How to test the hypothesis?
The theorem of large numbers is useful but not applicable in all scenarios in real life! Sometimes we only have a limited number of "small data" , but we must make a judgment immediately. At this time, the usual way is to put forward some hypotheses, and then find a way to verify whether they are reasonable—that is, hypothesis testing . The basic idea is to assume that it is established first to see what consequences it will produce. When the probability of the observation result is very low, the hypothesis can be rejected; the method is the method of counter-evidence, which is a tool to overthrow the established hypothesis. Statistical method for calculating the probability of occurrence of observations at the same time !
For example, there is a set of data in hand but the overall distribution function is not clear , or only its mathematical distribution form is known, but the specific parameters are not sure . At this time, in order to infer some characteristics of the overall distribution, it can be assumed that the overall population obeys the Poisson distribution, or the mathematical expectation of the population that obeys the normal distribution is assumed to be a certain value, etc. Then, based on the sample data in hand, judge whether these hypotheses should be accepted or rejected. Hypothesis testing is such a decision-making process ! It is also called a significance test, where the word "significant" means that the probability is low enough to reject the hypothesis.
When estimating parameters , in addition to wanting to know the average value of the parameters, we also care about the degree of accuracy (interval), that is, the confidence interval .
When the overall mathematical distribution form is known but the specific parameters are not known, Z test, T test, and F test can be used to judge whether the hypothesis is sufficient to reject! In fact, we don’t know what distribution the population obeys. At this time, we need to test the hypothetical distribution according to the sample. The chi-square test method is commonly used . If the actual value and the expected value are the same, the chi-square value is 0. The greater the difference between the two, the greater the chi-square value. big.
How Experience and Reality Coexist - Bayes Theorem?
Imagine a situation where the probability statistics we know conflict with real life, or the previous experience does not match our own personal experience, that is, there is a contradiction between theory and reality. For example, if you guess the heads and tails of a coin, it stands to reason that the probability of heads and tails each time is 0.5. You can guess randomly and you will always guess half right, but that is a theory after all. You cannot guarantee that the coin in front of you is indeed the case. 8 times out of 10 are heads, so next time you should guess heads! That is to constantly revise one's cognition based on historical experience . The mathematical principle behind this way of thinking is Bayes' theorem !

Bayes' theorem contains a framework for solving problems: by continuously adding information and experience, we can gradually approach the truth or understand the unknown . Its process can be summarized as: "past experience" + "new evidence" to get "modified judgment" , which provides an objective method of combining newly observed evidence with existing experience for inference. The conditional probability relationship is introduced: posterior probability P(A|B)=prior probability P(A)xP(B|A)/P(B) . The prior probability is generally the probability data obtained by previous data analysis or statistics, and the posterior probability is the probability of occurrence under certain conditions, which is the probability of re-correction after the information is obtained. When the prior probability is strong enough, even if new evidence emerges, the prior probability will have amazing influence, so look at the big picture!
Bayes' theorem helps us make the most appropriate reasoning and judgment based on a small amount of data!
"Naive" Naive Bayes?
Bayesian theorem studies conditional probability, that is, the probability problem under certain conditions. Based on this idea, the Naive Bayesian algorithm was proposed . Naive Bayes often solves classification problems . The purpose is to classify samples with certain characteristics into the most likely category, that is, which category the sample has the highest probability of belonging to, and which category it is considered to belong to . Such as email classification, article classification, sentiment analysis, etc.
Where is it "simple"? That is, a basic assumption is satisfied: it is assumed that the characteristics of a given target are independent of each other, that is, conditional independence . This is because if each feature is not independent of each other, all permutations and combinations of these features must be considered when calculating the probability. The amount of calculation is large and even the number of exponential parameters is generated. The actual implementation is very difficult! Sometimes the conclusion obtained by ignoring the correlation between some conditions will not deviate too much from the reality.
2. Data "trap"
Above we know the problem-solving ideas of artificial intelligence- statistical thinking! ! However, high-quality statistical data and the basis of AI operation are also data. If the data is wrong or the understanding of the data is biased, it will directly lead to fallacious conclusions. Sometimes data can be deceptive and confusing , use them with care! !
1. Data collection bias
The quality of collected data is directly related to the success or failure of the analysis conclusion, but the wrong collection method will lead to biased results. For example, there are errors in statistical objects, incomplete statistical objects and only partial data extraction, etc., which will lead to two common data biases- survivor bias and selection bias . Survivor bias is the bias due to the inaccurate selection of research objects, reminding us to examine all types of data ; selection bias is the bias caused by not selecting data "fairly", reminding us to select data objectively . Both failed to see the whole picture of the data, leading to "generalization".
2. The paradox of data processing
We are used to using statistical data to simplify the description of things, but wrong statistical methods not only fail to reflect the facts, but also make the data meaningless!
For example, using the average value when counting the salary level of a company often confuses the line of sight. Normally, the median is used. The measures that reflect the degree of data concentration usually include the average, median, mode, etc. If these three are the same number, Then the data are distributed symmetrically , but more often they are positively skewed (the mean is to the left of the latter two) or negatively skewed (the mean is to the right of the latter two).
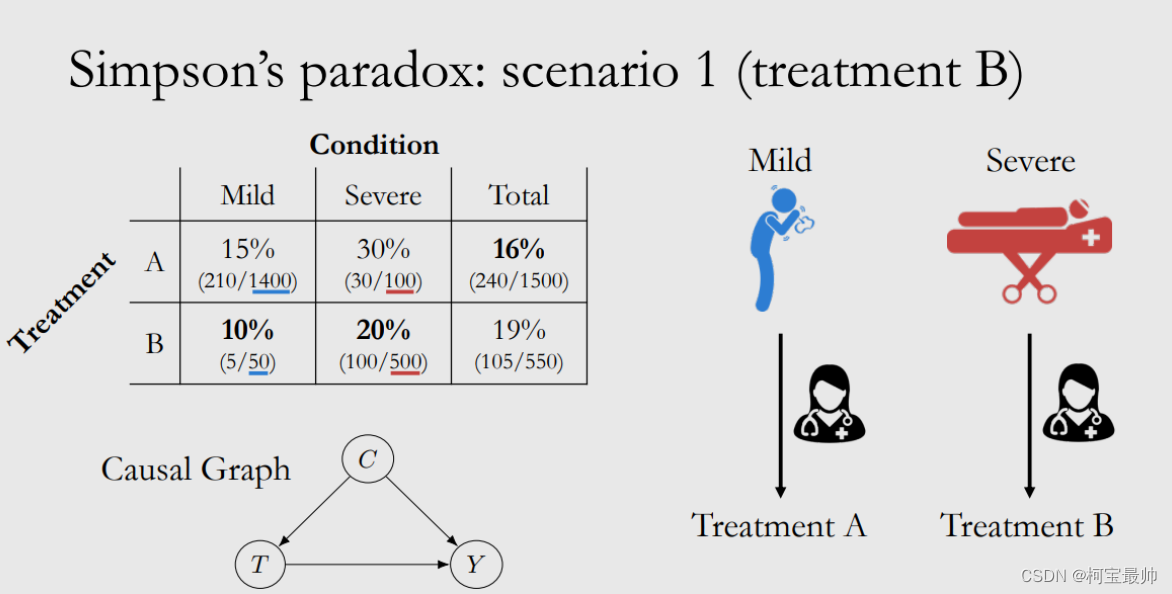
Simpson’s Paradox: For example, in two hospitals A and B, the overall patient cure rate is A: 90%, B: 80%. This is why you would think of choosing A hospital, but if you continue to look at the data details, the patients are divided into severe and non-critical. Looking at the two types of severe disease, it will be found that the cure rate of the two types is higher in B hospital, and B has become a better choice. This is due to the existence of latent variables in the data (such as the proportion of patients with different disease severities), and the data grouped according to latent variables is uneven. That is to say, the party (Hospital B) that has the upper hand in the group comparison becomes the loser party in the comprehensive evaluation . This phenomenon is called Simpson's paradox. That is to say, the overall trend and grouping trend of the same group of data may be completely different, and the following relationship can be expressed in mathematical language:
At that time ,
the conclusions that could not be drawn could not be conversely.
Due to the existence of this paradox, the truth cannot be directly deduced and restored only through a limited number of statistics. This is a fatal flaw of statistical data, because data can be classified and compared in various forms, and potential variables are endless . I will use this to show others the conclusions of the classification and splitting data methods that are beneficial to myself. In order to avoid this situation, it is necessary to carefully analyze various influencing factors, not to generalize and not to treat the problem at a glance!
3. Interpret the data correctly
Correlation does not equal causation
The existence of a correlation between two variables does not mean that a change in one variable is caused by the other variable . Correlation reflects the degree of correlation between two things, such as the positive correlation between housing area and price, and the negative correlation between altitude and atmospheric pressure. However, data usually only show correlation, and it is difficult to directly reflect cause and effect AI is a typical representative. Computers can only discover the connection between data and are not responsible for explaining the cause ; but to obtain causality, it must be theoretically proved that there is a causal relationship between two variables, and all other implicit variable causes the likelihood of both variables at the same time. Only through a few sets of data can not be rashly drawn conclusions, in many cases it is only the appearance, it is impossible to confirm whether there are variables hidden inside !
Data Representation Limitations
The world is multi-dimensional, and data is only one of them . When we convert something or a certain state in the real world into data, we have eliminated (lost) a lot of information, because data only expresses one aspect of things . For example, when discussing employment in the AI era, the affirmative will say that there are more and more jobs and occupations; the negative will say that more and more people have lost their jobs because of robots. Both sides are correct but they can only reflect the problem. an aspect of
Probability is a typical, limited expression. There is an essential difference between what is 100% certain and what is 99% possible. With a 99% cure rate for a drug, even a 1% failure rate is a huge risk that threatens human life. Small probability events must be taken seriously, because a small probability does not mean a small risk .
4. The challenge of accurate forecasting
For life, any small decision, action, or environmental change will have a huge impact on the future; for an AI prediction model, any slight input change will lead to completely different prediction results, which is a chaotic phenomenon . Prediction is divided into two situations, one is the prediction of objective phenomena, which is not affected by the prediction itself , such as predicting the orbit of the earth in the universe; the other refers to those predictions that are affected by the prediction itself , such as the market, stock market , politics, these will change with the forecast, and the previous forecast will lose its meaning. There is an unstable factor here-human free will.

Summarize
So far, we have discussed the statistical methods and data screening in the first two chapters under uncertain conditions that need attention, but there is still a lack of a theoretical weapon. If you want to study the problem of uncertainty, it is not enough to only use statistics . You also need to know how to convert uncertainty into a deterministic theory - information theory .
Information theory is a theory that uses probability theory and mathematical statistics to study information . Today's communication systems, data transmission, data encryption, and data compression are almost inseparable from it. It has laid the theoretical foundation for the development of information technology. This will be discussed in the next blog!
Disclaimer: Refer to the book "Big Talk about Machine Intelligence" by Machinery Industry Press, which is only for learning and communication!
