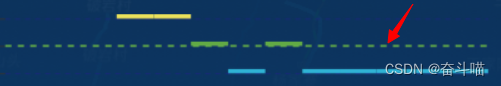
echarts drawing straight line (custom standard line)
Write the following code in series:
{


  type: 'custom',
  name: '标准线',
  renderItem: (param, api)=>{


    let bandWidth = api.size([0, 0])[0] * (data.length); // data为总数据量
    let itemWidth = api.size([0, 0])[0]
    let point = api.coord([api.value(0), api.value(1)]);
    return {


      type: 'line',
      transition: ['shape'],
      shape: {


        x1: point[0] - itemWidth*0.5,
        x2: point[0] + bandWidth - itemWidth*0.5,
        y1: point[1],
        y2: point[1]
      },
      style: api.style({

     // 直线配置
        fill: null,
        stroke: api.visual('color'),
        lineWidth: 2 // 线宽
      })
      // style: api.style({ // 虚线配置
      //  stroke: api.visual('color'),
      //   lineWidth: 2,
      //   fill: "transparent",
      //   lineDash:[5,5],
      // }),
    };
  },
  encode: {


    x: 0,
    y: 1
  },
  color: '#FFC621',
  data: [x], // x为标准线数据值,例如:3
  label: {

     // 标准线上的提示文字
    show: true,
    formatter: `标准值${

      x}`,
    position: [ ((100/(m+1))*(n+1)-10) + '%', -4], // m 为设置标准线的个数  n为第几根标准线, 这样设置后,标准线上的提示文字是错开的
    backgroundColor: '#ebf9f9'
  },
},
After configuration, the standard line is as shown in the figure: