1. Demand
1. Draw regional maps of districts and counties below the city level on echarts.
2. At the city level, many areas have districts and counties, while a small number do not have districts and counties. They are areas directly below the city level, which are at the street and town level.
3. Unified management of regional data. Cities with districts and counties directly use geoJson data of districts and counties, and cities without districts and counties directly use geoJson data of streets and towns to draw regional maps.
2. Get geoJson data
Note: The following methods obtain data around 2015.
The first method (street and town level data cannot be obtained)
Alibaba Cloud Data Visualization Platform
http://datav.aliyun.com/portal/school/atlas/area_selector
GeoJson data that can directly obtain detailed map information of the whole country, provinces, cities, and county-level cities
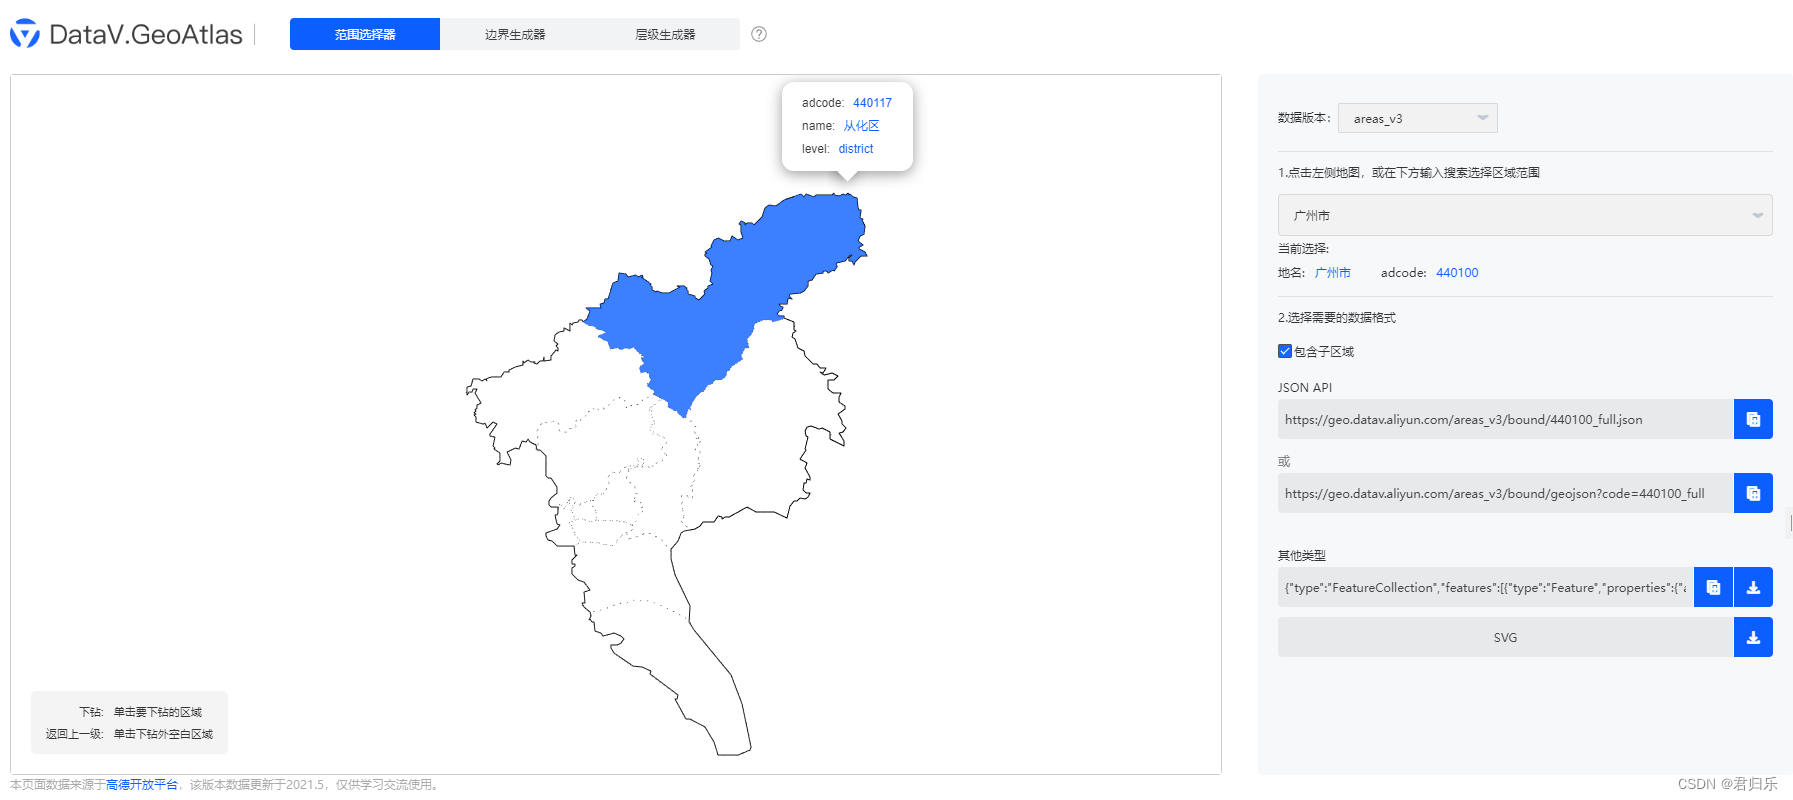
Note: At present, the platform cannot obtain the regional data of streets and towns.
The second method (street and town level data can be obtained)
The first step (download the kml file)
BIGEMAP
http://www.bigemap.com/reader/download/

After downloading, open it and select the map

Here, taking "Guangdong Province-Zhongshan City-Shiqi District Street" as an example,
we can see that the blue area will be automatically enclosed area to
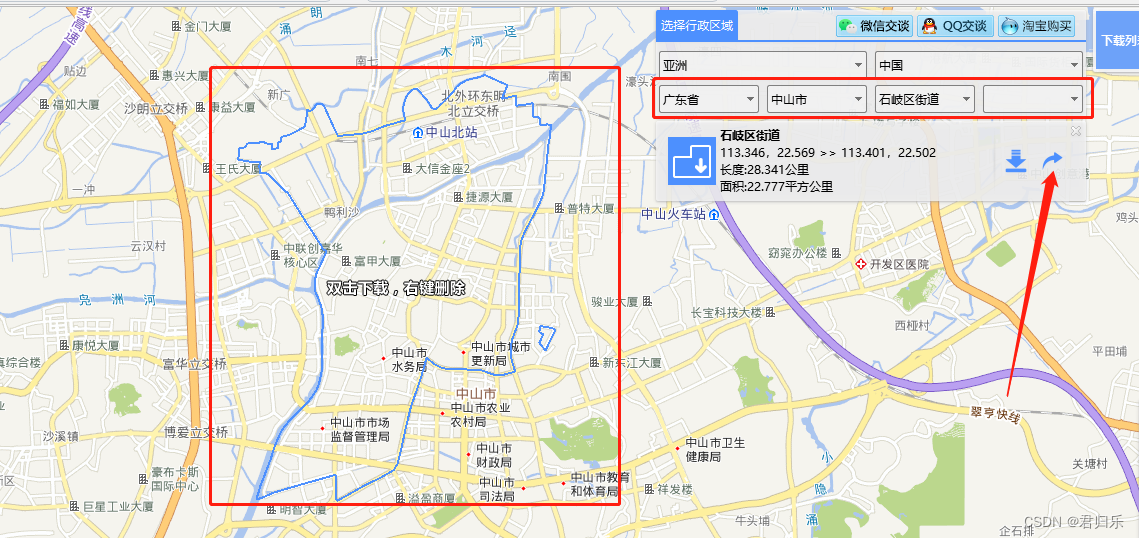
The red arrow on the right can download the kml file of the street area and save it locally

The second step (import the kml file to obtain geoJson)
geojson.io
http://geojson.io/#map=2/20.0/0.0
Import the downloaded kml in the first step and
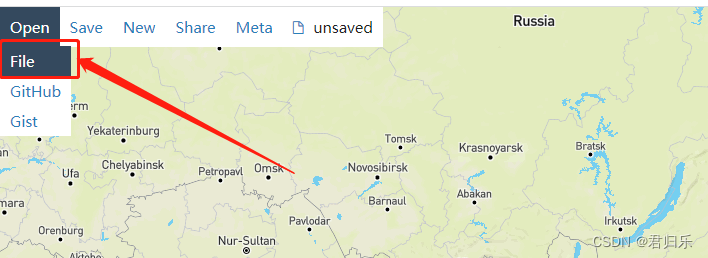
import all street and town data.
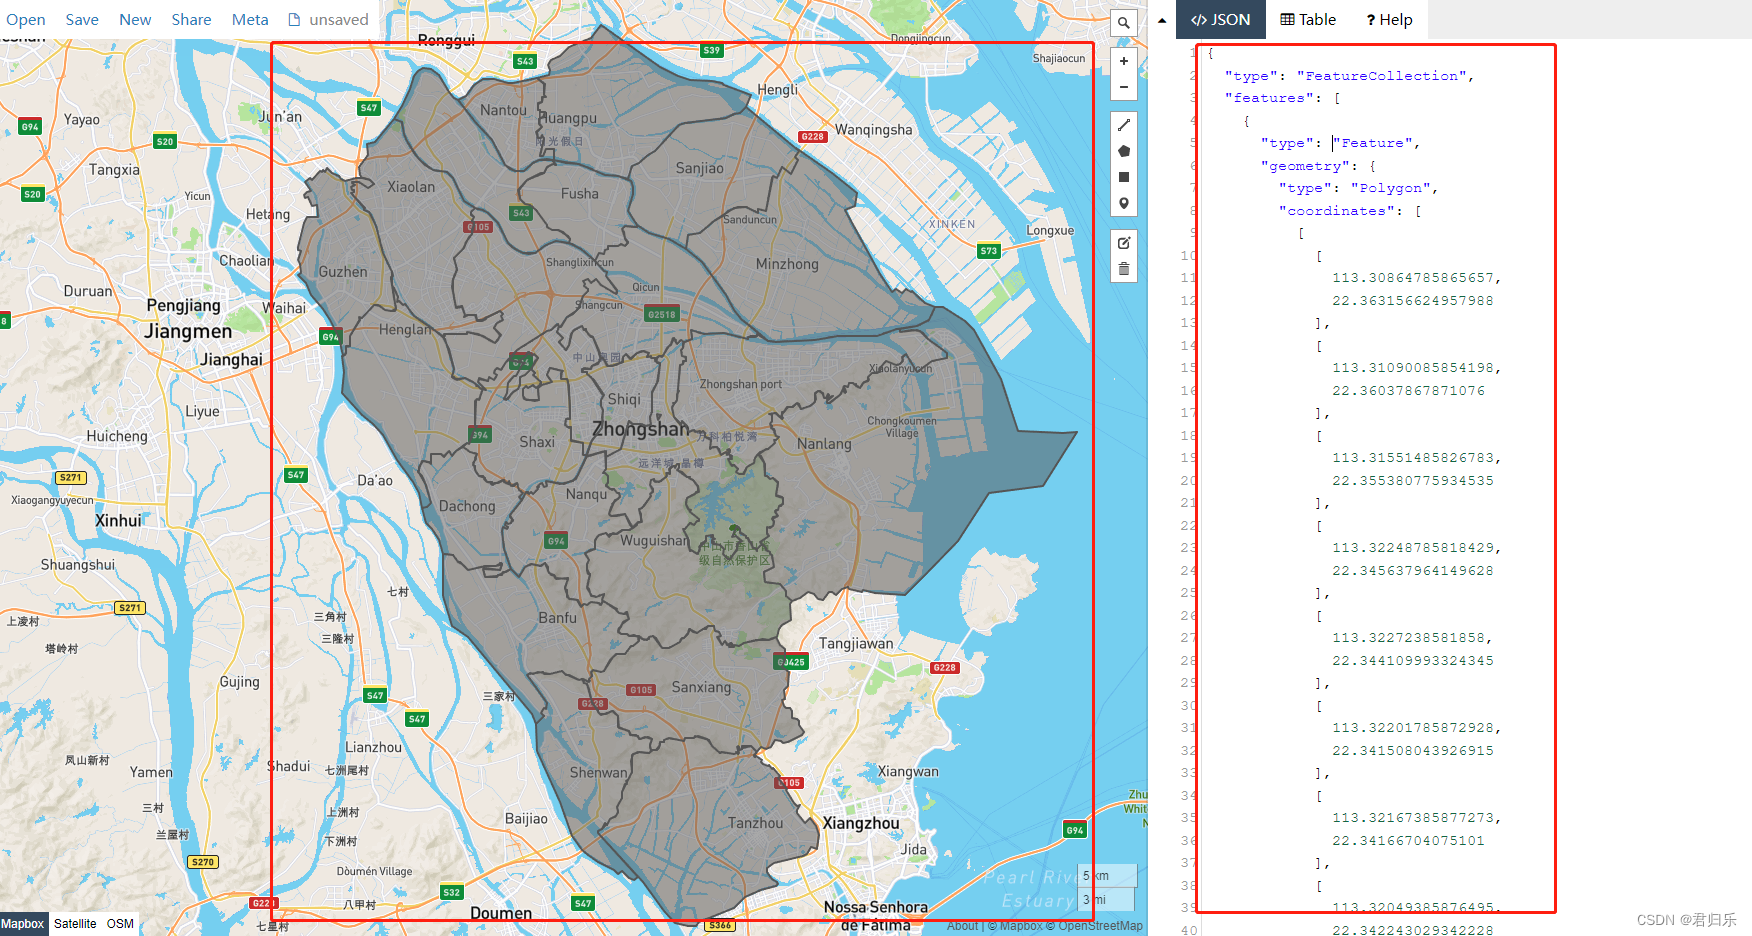
The json data in the red circle on the right is the geoJson data we need to put in echarts to display the map.
Copy the geoJson data on the right (ctrl a + ctrl + c)
Three, echarts drawing map (vue version)
renderings
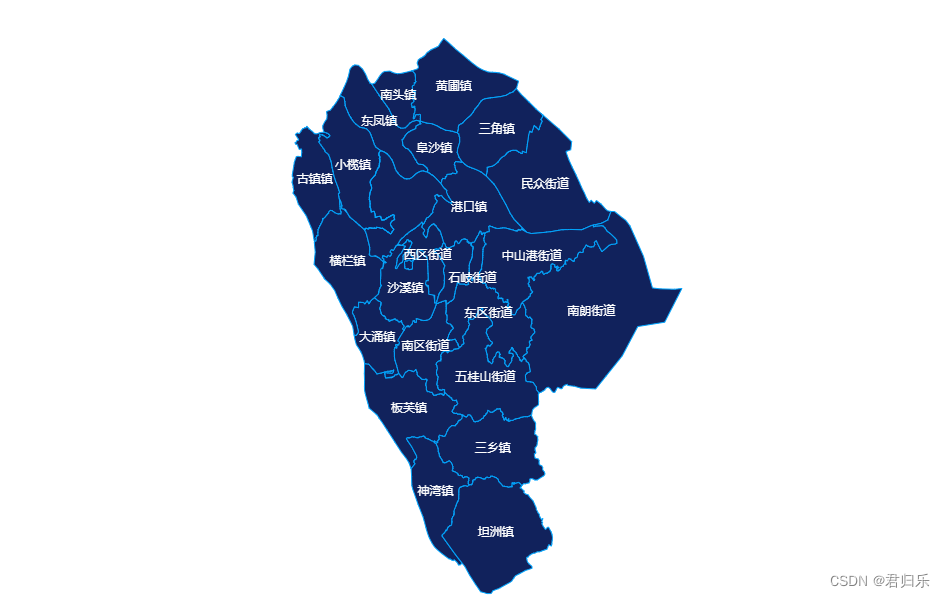
the code
<template>
  <div ref="map" class="map"></div>
</template>

<script>
import {

    ref,reactive,onMounted} from "vue";
import * as echarts from "echarts";
export default {


    setup(){


        let eCharts = null;
        let map = ref(null);
        let option = reactive({


            series:[
                {


                    name:"地图",
                    type:"map",
                    map:"中山市",
                    itemStyle: {


                        areaColor: '#11225C',
                        borderColor: '#00A5FE',
                        borderWidth: 1
                    },
                    label: {


                        show: true,
                        color: '#fff'
                    },
                }
            ]
        })
        onMounted(()=>{


        	// 复制下来的geoJson数据
            fetch('442000.geoJson')
            .then(response => response.json())
            .then(data => {


                echarts.registerMap("中山市",{

    geoJSON:data})
                eCharts = echarts.init(map.value)
                eCharts.setOption(option)
                window.addEventListener("resize",()=>{


                    if(!eCharts)return;
                    eCharts.resize();
                })
            });
        })
        return{


            map
        }
    }
}
</script>

<style lang="scss" scoped>
.map{


    width:1200px;
    height:800px;
}
</style>
4. Problems encountered
1. Error: Invalid geoJson format Cannot read properties of undefined (reading 'length')
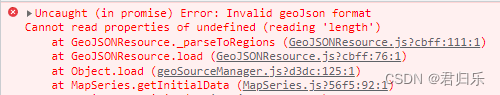
Reason:
There is an area in the generated map that is two discontinuous map blocks, so the type is GeometryCollection, which is not processed in echarts.
Solution:
Put two discontinuous array data together, and the type type is Polygon.
before change
"type": "Feature",
"geometry": {


 	"type": "GeometryCollection",
    "geometries": [
        {


            "type": "Polygon",
            "coordinates": [
                [
                    [
                        113.30025185815984,
                        22.55341993226088
                    ],
                    ...数据
                ]
            ]
        },
        {


            "type": "Polygon",
            "coordinates": [
                [
                    [
                        113.27243485793879,
                        22.591996179437235
                    ],
                    ...数据
                ]
            ]
        }
    ]
}
after change
"type": "Feature",
"geometry": {


    "type": "Polygon",
    "coordinates": [
        [
            [
                113.30025185815984,
                22.55341993226088
            ]
        ],
        [
            [
                113.27243485793879,
                22.591996179437235
            ]
        ]
    ]
}
Run it again to display the drawing effect normally.
Reference article:
https://blog.csdn.net/weixin_44861708/article/details/114223258