https://datav.aliyun.com/portal/school/atlas/area_selector

You can choose province, city, or district.
You can also directly click on the corresponding area on the map.
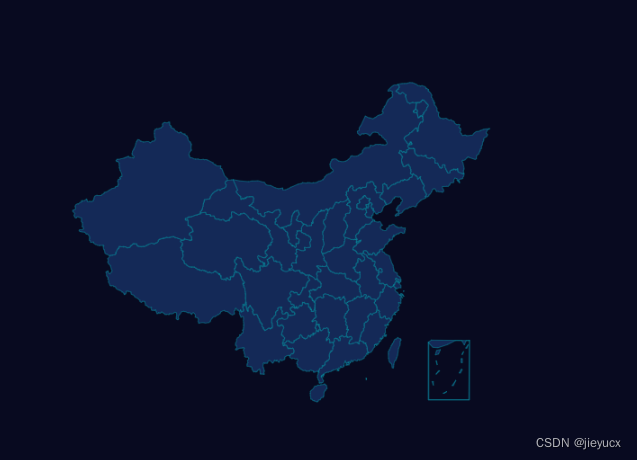
My application scenario
What I use here is a very old large-screen project, written in jq. Show border areas on China map
We select the China region in the area above
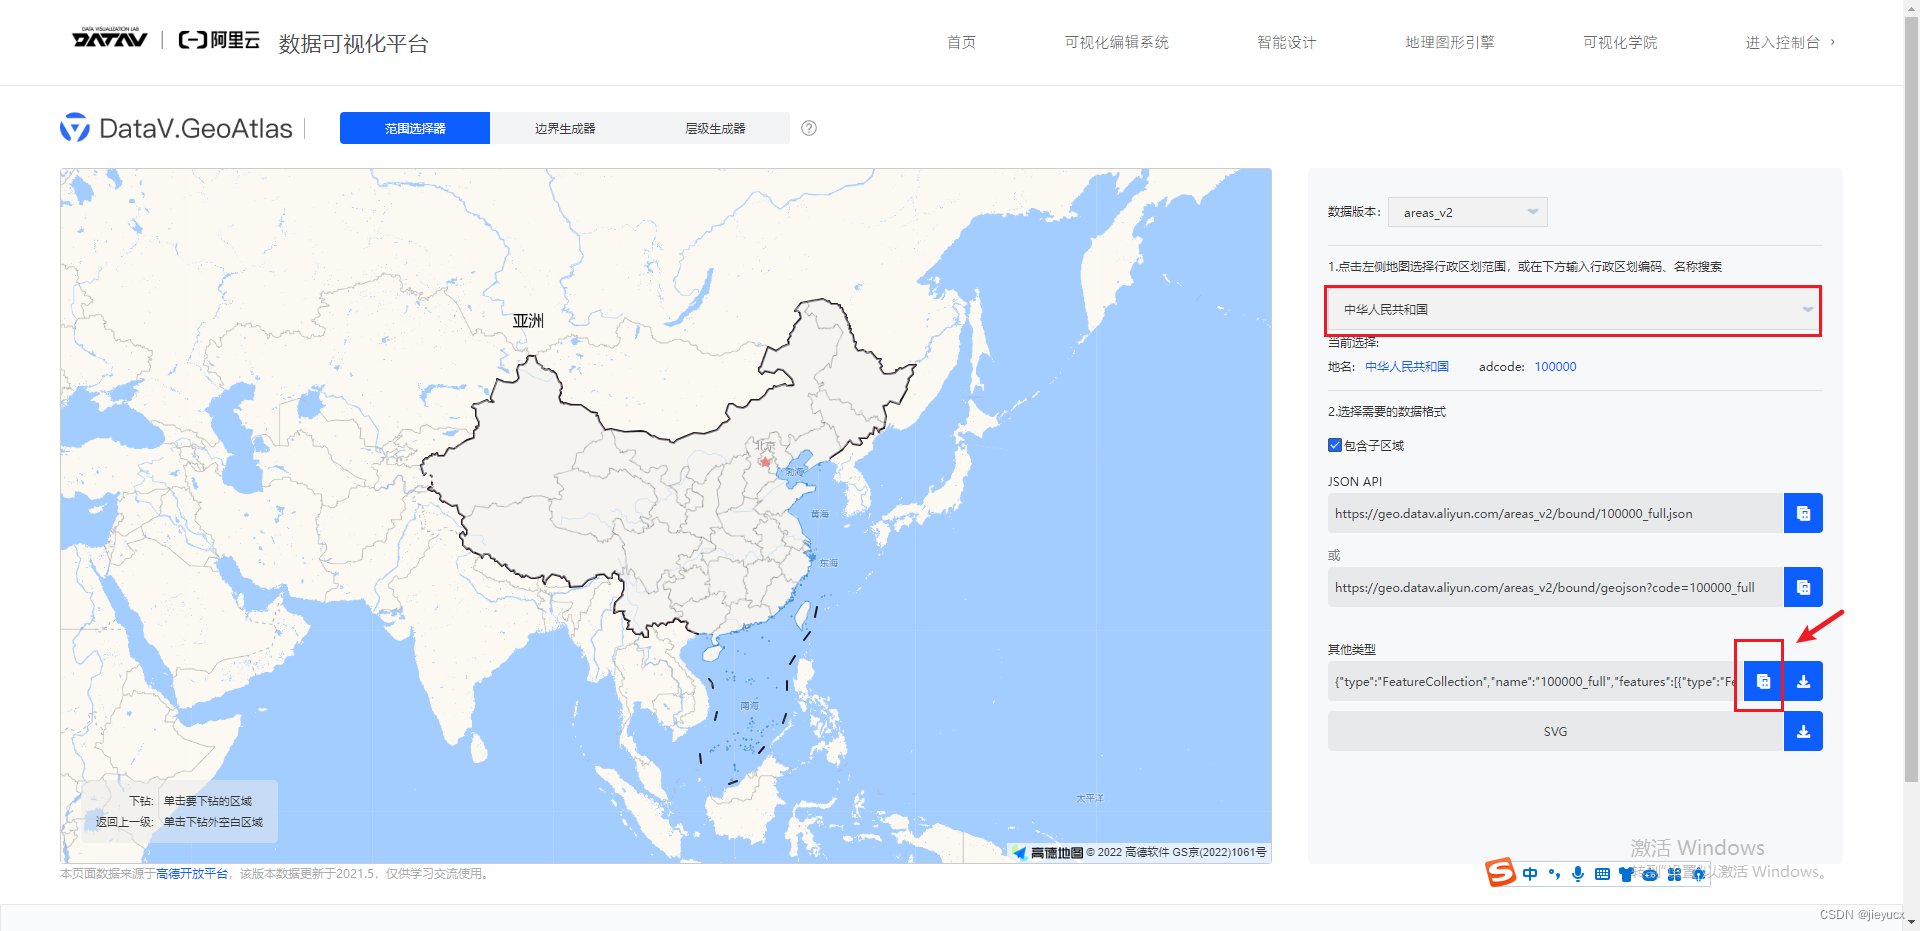
and click Copy to copy the json data. Create a new china.js
(function (root, factory) {
if (typeof define === 'function' && define.amd) {
// AMD. Register as an anonymous module.
define(['exports', 'echarts'], factory);
} else if (typeof exports === 'object' && typeof exports.nodeName !== 'string') {
// CommonJS
factory(exports, require('echarts'));
} else {
// Browser globals
factory({
}, root.echarts);
}
}(this, function (exports, echarts) {
var log = function (msg) {
if (typeof console !== 'undefined') {
console && console.error && console.error(msg);
}
}
if (!echarts) {
log('ECharts is not Loaded');
return;
}
if (!echarts.registerMap) {
log('ECharts Map is not loaded')
return;
}
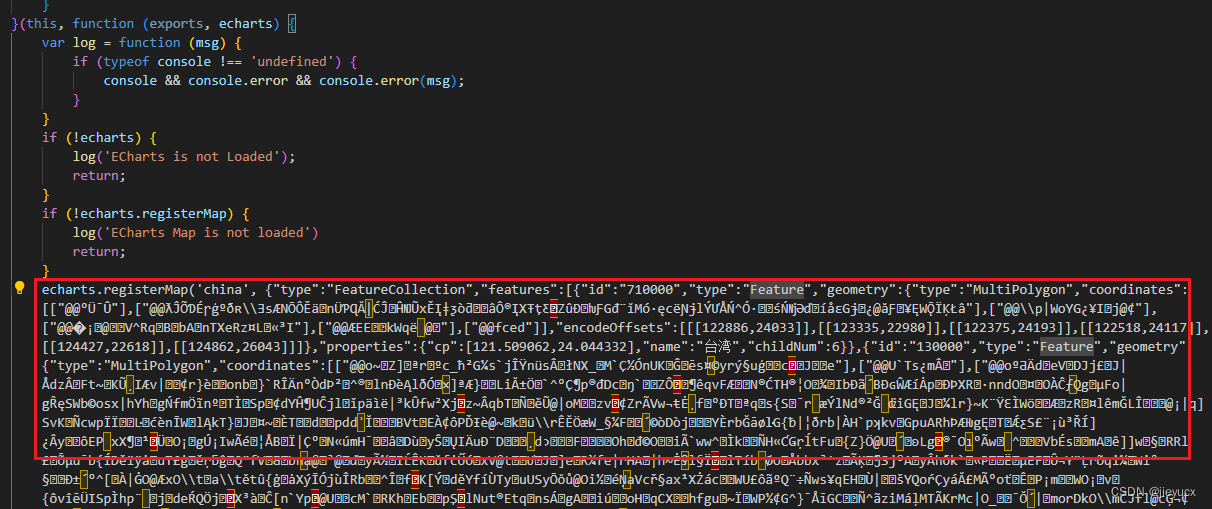
echarts.registerMap('china', '这里是复制下来的json数据');
}));
Then index.htmlintroduce it in
<script src="./js/china.js"></script>
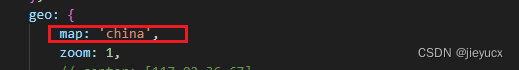
Set
the main configuration properties geoof echarts map. echarts.registerMapWhat is the first parameter in front? Just write whatever you want here.
var option = {


    backgroundColor: '#080a20',
    title: {


        left: 'left',
        textStyle: {


            color: '#fff'
        }
    },
    tooltip: {


        trigger: 'item'
    },
    geo: {


        map: 'china',
        zoom: 1,
        label: {


            emphasis: {


                show: false
            }
        },
        roam: true,
        itemStyle: {


            normal: {


                areaColor: '#142957',
                borderColor: '#0692a4'
            },
            emphasis: {


                areaColor: '#0b1c2d'
            }
        }
    },
};
var myecharts = echarts.init($('.map .geo')[0])
myecharts.setOption(option)
html
<div class="map">
    <div class="geo"></div>
</div>