I have been in contact with ANR analysis for a while, but when encountering related problems, there is always a sense of jerkyness. I will start a blog and make some notes after reading the articles, and continue to accumulate. (Friendly reminder: The subtitle of each blue word is a link, you can click to jump to the original text of the boss.)
1. Theory
1 The design principle of Android ANR
ANR is summarized as three steps: burying mines, demolishing mines, and detonating mines. The main content is to combine the source code and analyze the principle of service ANR. I will copy the final summary:
1. Add the service to be executed to the executingServices of the system process.
2 Turn on the detection logic, the detection will be executed after the specified time, and the specific time determines whether it is a foreground service or a background service.
3 Once the service is executed, it tries to remove the detection logic.
4 If the detection logic is not removed, it will be executed, and then to detect which service has ANR.
5. If ANR occurs, provide the system with ANR information, otherwise, detect and execute the next round of ANR detection.
2. Practical articles
1 How to analyze the ANR problem?
This article is highly recommended. Although it is 17 years old, it is all dry goods. It is difficult to simplify it. It mainly summarizes the analysis ideas of ANR logs, and the examples given are also very classic.
1 ANR classification
Broadcast ANR
Service ANR
ContentProvider ANR
Input ANR
System-oriented: WatchDog
generates ANR for the following reasons:
time-consuming operation
self-service blocking
system blocking
memory shortage
CPU resource preemption
2 Analysis ideas
Which logs should I see for ANR problems? Mainly Trace log, log log (recommended order is logcat, kernel, cpuinfo and meminfo.
Analyze logcat ideas
Keywords: anr in, low_memory, slow_operation
anr in displays the location of the fault, cpu usage and other information;
low_memory is the print related to low memory;
slow_operation indicates that the scheduling of the system process is slow.
Analyze kernel ideas
Keyword: lowmemorykiller
The print is that the system is killing, if it is very frequent, it may be that the memory is low. Free Memory is free physical memory, and File Free is file Cache. When the overall values of Free and Other are low, Kernel will perform memory swap, causing the entire system to freeze.
Analyze cpuinfo ideas
If there is a process that occupies a high amount of CPU, ANR may be related to the preemption of CPU by this process;
if the kswapd and emmc processes are in top, it means that the system memory pressure or file IO overhead is encountered.
Analyze meminfo ideas
See which type of application or system occupies high memory;
if the application or system memory usage is relatively normal, but the overall memory is low, it means that a large number of processes have been cached in the system and have not been released in time.
3 some examples
The main thread performs time-consuming operations, or is blocked by other threads in the process
First observe the stack of the main thread, usually there will be blocked information, and the cause of such problems can usually be found from the stack.
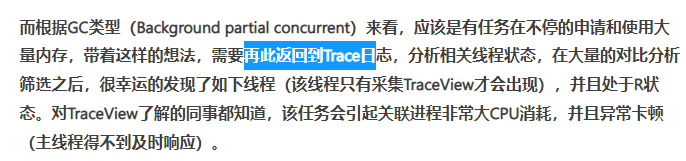
Here is an example of waiting for other threads to GC. Learn to look at the pair of keywords WaitingForGcToComplete and WaitingPerformingGc. The reason for the long GC time is from the memory usage.
The application internal thread logic dependency causes a timeout and triggers ANR
This is an example of the main thread being blocked during binder communication. Find the peer thread of the binder (the next line of Binder.java) by looking at the function name when the binder is called, and then look at the state of the corresponding thread, followed by the doll process, and finally find a deadlock link in which the binder participates.
The system memory is too low, and the memory exchange process of the kernel will cause the entire system to run slowly
Reasons for the Suspend state of the main thread: (1) The process itself is too busy, and the time slice is not enough; (2) The system is busy, and the low priority cannot get the time slice.
There is no obvious reason from the stack, so go to logcat according to the idea.
(1) ANR in. Pay attention to the cpu load information (Load: 22.72 / 20.06 / 15.54 / corresponding to 1 minute / 5 minutes / 15 minutes / respectively), cpu ratio. It is found that the system load is heavy (usually about 10), and the memory is low.
(2) The slow_operation search found that the system function takes a long time to execute once;
(3) I already suspected that it was a memory problem, so I just looked at meminfo directly.
Binder resources are exhausted, making it difficult to respond to communication requests in a timely manner
This problem is also that the stack did not find valid information, go to logcat to find it.
Find the log according to the order of the analysis ideas, and find that there is no problem with the memory. According to the high CPU ratio of the anr process itself, it is suspected to go to the CPU direction. The following speculation by the boss is very spiritual, and I personally feel that it requires experience.
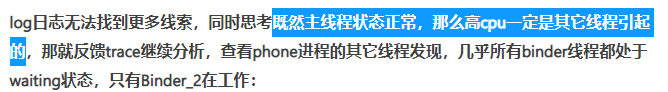
After finding other threads, continue to look at the stack, and return to logcat according to the last call.
High CPU excessively preempts time slices, making it difficult for other applications or tasks to be scheduled in time
The main thread is mostly in the idle or suspend state.
The idea is still in the order we said before, to find valid information according to the pid before and after anr in. Then repeat between trace and logcat.
Incomplete logs, lack of Trace or other logs
In short, it is to dig out effective information as much as possible according to the idea of analyzing the log. The system level is nothing more than the two main angles of cpu and memory.