Article Directory
Recently, ChatGPT has been popular, and NLP students will definitely feel more deeply. It is a good thing that the application of NLP is known and actively deployed, but every application scenario at the application level is a task that has been continuously overcome by the SOTA model in the past domain. But unfortunately, in recent years, breakthroughs in solving a single task at the algorithm level have slowed down significantly, but the application level has accelerated.
ps: At present, the word "Skynet" has not been mentioned in the information, hhhhhhh, back then when VR and AR didn't have anything, mentions of "Skynet" were coming all over the mountains and plains. what is
Here we use a relatively simple and commonly used machine learning model SVM to help timing and obtain excess returns

Application of Machine Learning to Quantitative Models
Machine Learning Quantification Application Scenarios
The machine learning application and quantitative strategy summarized by the blogger have the following three scenarios:
- Construct a quantitative strategy with a winning rate greater than 50. No matter whether the model is explainable or not, by increasing the number of transactions, the comprehensive income will be shifted towards the moving average to obtain the expected excess return
- On a logical framework that may obtain excess returns, use the machine learning model to optimize the details, so that the average expected return will shift to a higher return under the blessing of the model
- Based on the pricing model, earn excess returns from the revised market
And each scenario corresponds to different quantification ideas, and also corresponds to the knowledge system of different researchers:
- The first type is suitable for engineering backgrounds with sufficient professionalism. The difficulty lies in the premise that "history will not repeat itself". The demonstration model can obtain excess returns, and obtaining excess returns is also a high-probability event. Mainly high-frequency trading
- The second type is suitable for financial personnel with programming ability. The difficulty lies in demonstrating the logical chain that can obtain excess returns
- The third type is suitable for financial personnel with programming ability and experience. The difficulty lies in identifying and eliminating noise information in the market, or correcting and optimizing the pricing model
Thinking about the Effectiveness of Quantitative Models
The current consensus is that the complexity of investment tasks is far beyond the scope of machine learning, so it is usually necessary to use machine learning models to optimize within a logical framework artificially framed.
After studying so far, I have read a lot of quantitative books and strategies. The blogger has some thoughts and wants to share with you:
- In fact, many students, like bloggers, have transferred from computer science to finance, so "quantification" is a good entry point for us. The more we lean towards data analysis, the more comfortable it is for us. But humans versus algorithms:
- The advantages of human beings are: stripping away noise, summarizing, and being able to read books less and less
- The advantages of machines are: statistics, reasoning, and the ability to read books thicker and thicker
The econometric model, which has been developed for more than half a century, has shown that the "result data" of finance and pricing are chaotic and random in their information composition. Therefore, it is best not to let machines "replace Think for yourself", the results of the algorithm can only give some inspiration at most, far from assisting thinking. At the same time, don't "have more features, the better". Garbage features are the source of noise, and machines cannot filter them by themselves. Therefore, "humans" must first understand finance and have logic, and then "humans" construct algorithms.
- In addition to tuning parameters, there are generally two effects of improving machine learning models:
- Artificially constructed feature sequences that can withstand logical scrutiny
- Do not pre-eliminate features according to the inherent rules of data analysis
Experience, such as the random forest model commonly used by bloggers, when you want to improve the effect only by adjusting features and data without tuning parameters, first of all, don’t remove this feature based on a biased distribution or something. Because each feature is a perspective, some perspectives are more accurate, but some perspectives are clear and strange. But every perspective is valuable. At this time, we need human participation to construct some suitable perspectives to match these features and reprocess the features. The less important the feature, the more the source of inspiration, the greater the room for improvement! It would be a big loss to eliminate it in advance.
- The difference in professional knowledge will make us look at the world from a different perspective. As the saying goes, "everyone who learns becomes a character." Students majoring in finance will put "risk management" in the first place, and at the same time have an almost instinctive recognition of "survivor bias" incidents, which is very powerful! However, according to my observation, in order to pursue the "theoretical mean", many quantitative strategies will rely on data theory and indulge the model, which requires special attention.
This blog only uses the SVM model for calculations. For more machine learning models, please refer to: https://blog.csdn.net/weixin_35757704/article/details/89280669
Application of Machine Learning Models in Quantitative Timing
Training and Prediction Process
Using machine learning usually has the following steps:
- data cleaning
- Split training set and test set
- Using the training set, cross-validate the stability of the model
- The test set judges the effectiveness of the model
- Application model calculation and backtesting
Therefore, we divide the time into the following two parts:
- Training and test data time: 2015-01-01 to 2020-01-01
- Application model calculation and backtest time: 2020-01-01 to 2023-01-01
Training Data Feature Construction
Here we construct a simpler feature for your convenience:
- Average turnover rate in the past 5 days
- Average turnover rate in the past 10 days
- Change in the past 5 days
- Change in the past 10 days
- MACD indicator DIF value
- MACD indicator DEA value
- MACD value
- Aroon indicator (a momentum indicator) DOWN value
- Aroon index UP value
SVM model and calculation
SVM training and prediction
Usually, after getting the data, the model with the final income as the goal mainly has the following training objectives:
- Directly predict the rate of return for a period of time in the future
- Forecast the range of earnings for a period of time in the future
Due to the limited performance of the machine learning model, when the ultimate goal is usually the rate of return, it will choose to "predict the range of earnings for a period of time in the future"
Therefore, we train and predict according to the following rules:
- 70% of the data is used as the training set, and 30% of the data is used as the test set
- Take the [rise and fall in the next 5 days] as the forecast target, and at the same time divide the data into bins and divide them into:
- Yield range: [minus infinity, -1]
- Yield interval: [-1, 1]
- Yield range: [1, positive infinity]
- In the training set, do 10 times of cross-validation
- The test set calculates the confusion matrix and visualizes it
The above "cross-validation" is to judge the problem of over-fitting and under-fitting. Many articles tend to blame "over-fitting" for poor results, but there is obviously a problem. For overfitting and underfitting, please refer to: https://blog.csdn.net/weixin_35757704/article/details/123931046
Effect measurement
The calculation process is as follows:
- Collect every non-ST stock from 2015-01-01 to 2020-01-01
- Then according to the stock price trend of individual stocks, construct the above 9 characteristics
- According to 70% of the data as the training set, 30% of the data as the test set
- Do 10 cross-validations on the training set
According to the above rules for training and prediction, the following model results are obtained:
-
Calculated according to the above calculation process, the accuracy rate on the test set is 0.4751
-
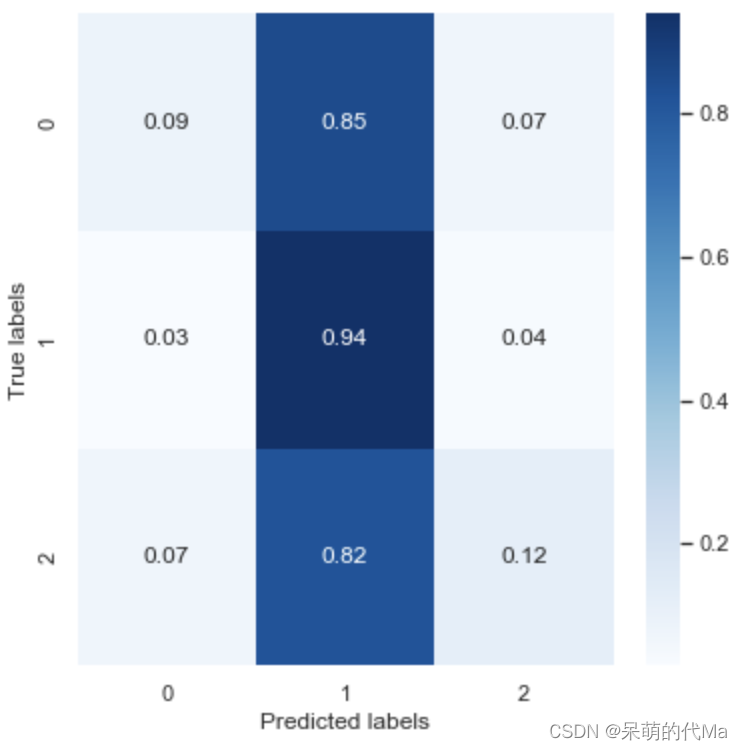
The normalized confusion matrix is as follows:
-
The results using 10-fold cross-validation are as follows:
| Accuracy effect | 0.492502 | 0.488092 | 0.478529 | 0.473529 | 0.485882 | 0.477647 | 0.477059 | 0.484118 | 0.480882 | 0.486176 |
|---|
In actual use, we will judge according to the logical effect of the model: if the model predicts a positive return, we will buy; if the model predicts a negative return, we will sell;
Effectiveness analysis
- The effect of cross-validation is similar to the prediction effect of the test set, indicating that the performance of the SVM model is relatively stable
- SVM predicts almost no difference in categories such as 0, 1, and 2 as category 1, and the accuracy rate of calculating 0 and 2 is only 10%, regardless of the category itself.
This effect is quite satisfactory, because there is no optimization, adjustment, or subjective structural features, the effect of the naked model is almost the same effect...